. 2017 Dec 1;77(23):6679-6691.
doi: 10.1158/0008-5472.CAN-17-1077. Epub 2017 Sep 28.

Secretory Autophagy in Cancer-Associated Fibroblasts Promotes Head and Neck Cancer Progression and Offers a Novel Therapeutic Target

Affiliations

Secretory Autophagy in Cancer-Associated Fibroblasts Promotes Head and Neck Cancer Progression and Offers a Novel Therapeutic Target

Jacob New et al. Cancer Res. .

Abstract

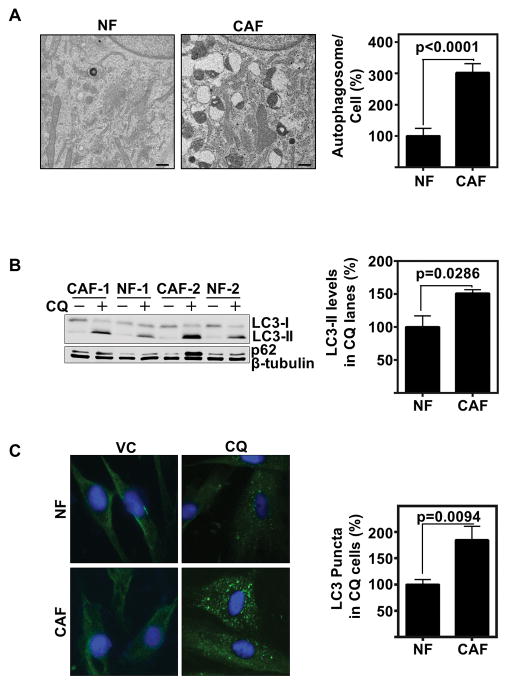
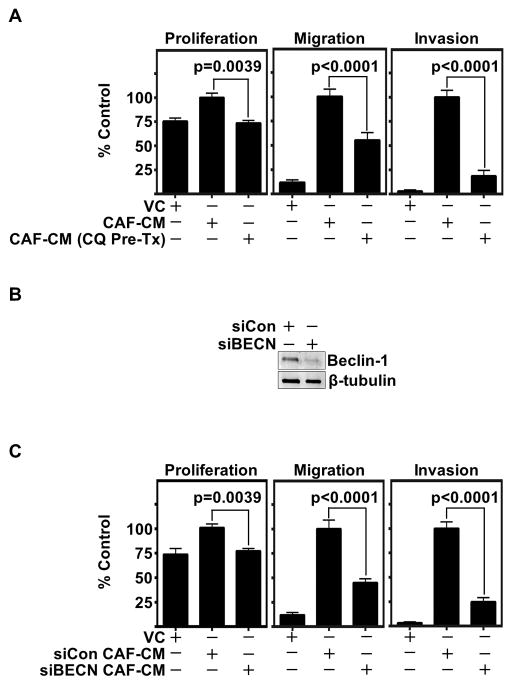
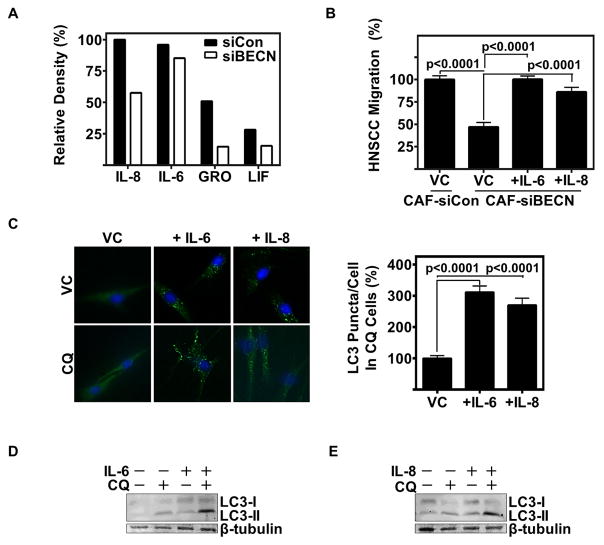
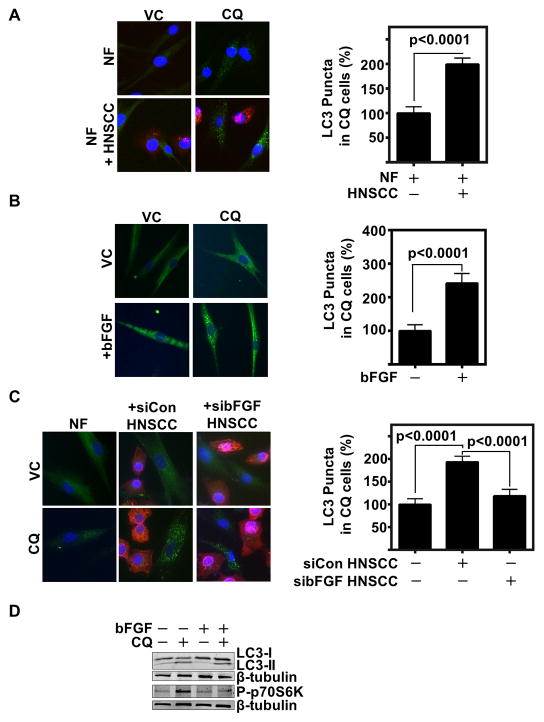
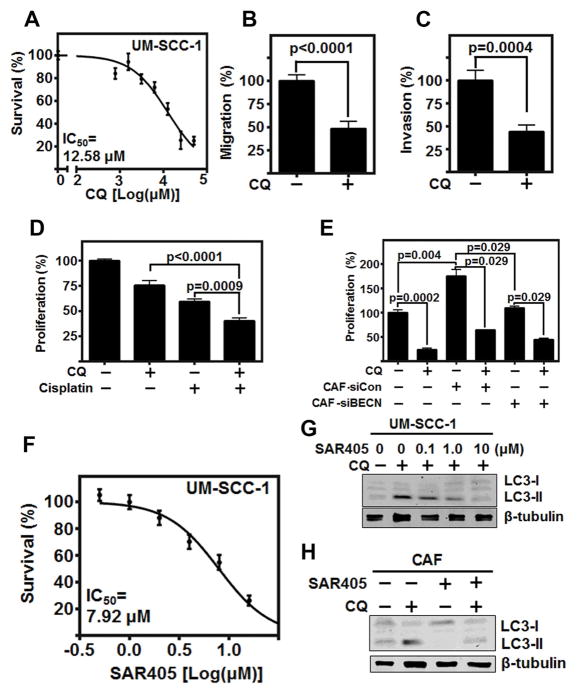
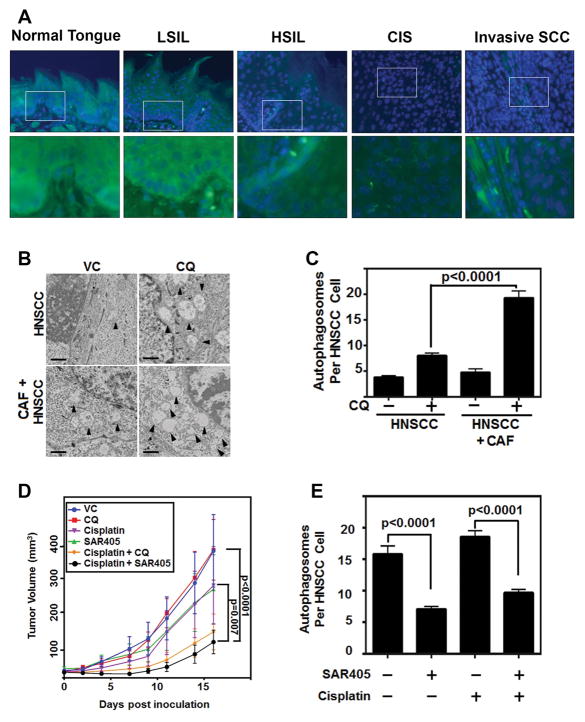
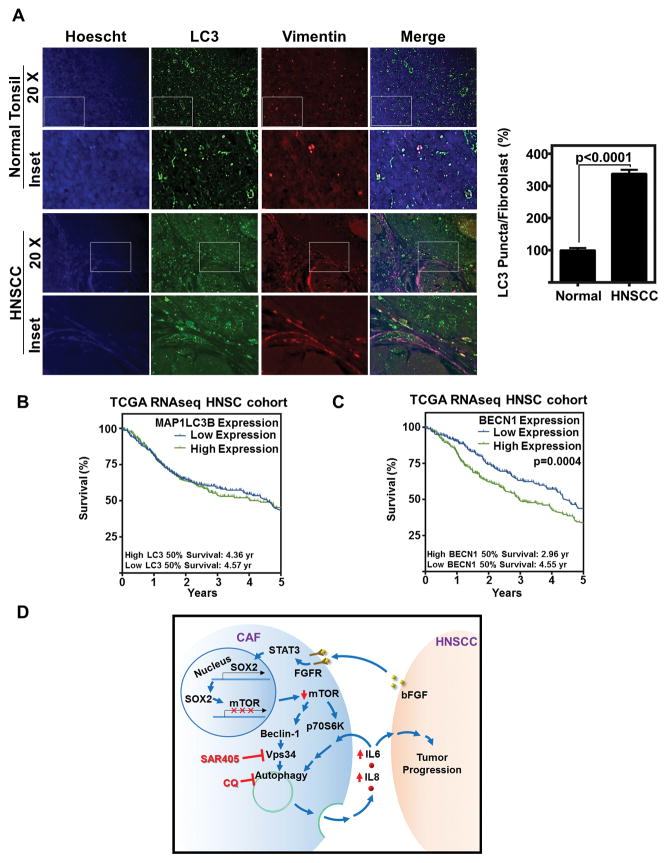
Despite therapeutic advancements, there has been little change in the survival of patients with head and neck squamous cell carcinoma (HNSCC). Recent results suggest that cancer-associated fibroblasts (CAF) drive progression of this disease. Here, we report that autophagy is upregulated in HNSCC-associated CAFs, where it is responsible for key pathogenic contributions in this disease. Autophagy is fundamentally involved in cell degradation, but there is emerging evidence that suggests it is also important for cellular secretion. Thus, we hypothesized that autophagy-dependent secretion of tumor-promoting factors by HNSCC-associated CAFs may explain their role in malignant development. In support of this hypothesis, we observed a reduction in CAF-facilitated HNSCC progression after blocking CAF autophagy. Studies of cell growth media conditioned after autophagy blockade revealed levels of secreted IL6, IL8, and other cytokines were modulated by autophagy. Notably, when HNSCC cells were cocultured with normal fibroblasts, they upregulated autophagy through IL6, IL8, and basic fibroblast growth factor. In a mouse xenograft model of HNSCC, pharmacologic inhibition of Vps34, a key mediator of autophagy, enhanced the antitumor efficacy of cisplatin. Our results establish an oncogenic function for secretory autophagy in HNSCC stromal cells that promotes malignant progression. Cancer Res; 77(23); 6679-91. ©2017 AACR.


Conflict of interest statement

Disclosure statement

The authors declare no conflicts of interest

Figures

Figure 1
Figure 1. CAFs have greater basal autophagic flux than NFs
(A) Electron microscopy exhibits highly vesicular architecture of CAFs with heterogeneous electron dense and electron poor organelles compared to NFs. Scale bars represent 0.5 μm. Graph depicts percent autophagosomes/fibroblast relative to NF. Autophagosomes were counted in a total of 36 fibroblasts from each group including 4 explants each from HNSCC or cancer-free subjects. Error bars represent ± SEM. (B) Representative immunoblot of CAFs compared with NFs with and without CQ (20 μM for 6 h) for LC3 protein conversion and p62. Graph depicts percent cumulative density of LC3 levels in CQ treated lanes relative to NF, in 4 explants each of HNSCC or cancer-free subjects. LC3-II levels were normalized to β-tubulin levels. Error bars represent ± SEM. (C) Representative immunofluorescent of LC3 (green) puncta, Hoechst nuclear stain (blue), comparing NF with CAFs with and without CQ (80 μM for 2 h) (60x magnification). Cumulative results of LC3 puncta per cell counted by a blinded observer of at least 30 cells each of NFs and CAFs. The experiment was repeated 3 times using 3 explants each from HNSCC or cancer-free subjects. Error bars represent ± SEM.
Figure 2
Figure 2. CAF autophagy inhibition significantly decreases CAF-facilitated HNSCC progression in vitro
(A) CAFs pretreated with CQ (20 μM for 6 h) were washed extensively to remove excess chloroquine and then conditioned media (CM) was collected with and without CQ pre-treatment. HNSCC (OSC19) migration, invasion, and proliferation are significantly reduced in CAF autophagy inhibited CM. Graph depicts cumulative results from three independent experiments including triplicate treatments, using CAFs derived from two HNSCC patients. Migration and invasion experiments were normalized to cell viability. Error bars represent ± SEM. (B) Representative immunoblot confirming Beclin-1 knockdown throughout CAF-CM collection. (C) Significant reduction observed in HNSCC migration, invasion, and proliferation with Beclin-1 knockdown CAF-CM (siBECN) compared to Control siRNA (siCon). Graph depicts combined results of at least three trials per experiments plated in triplicate using at least two different CAF patient samples. Migration and invasion experiments normalized to cell viability. Error bars represent ± SEM.
Figure 3
Figure 3. CAFs secrete IL-6 and IL-8 through autophagy, which further induce autophagy in an autocrine pathway
(A) Relative density of top 4 cytokines recognized on cytokine array of CAF-CM with Beclin-1 siRNA knockdown (siBECN) or Control siRNA (siCon). (B) Reconstitution of HNSCC (UM-SCC-1) migration in Beclin-1 knockdown CAF-CM with recombinant IL-6 (10 ng/mL) and IL-8 (80 ng/mL); data cumulative of two trials plated in duplicate using different CAF patient samples. (C) Representative IF of NF treated with vehicle control (water), IL-6 (10 ng/mL), or IL-8 (80 ng/mL) for 24 h with and without CQ (80 μM for last 2 h of cytokine treatment) (20x magnification). Graph depicts cumulative results of LC3 puncta per cell counted by a blinded observer of at least 30 cells per experimental arm in three separate experiments. Error bars represent ±SEM. (D&E) Representative immunoblot of NF treated with (D) IL-6 (10 ng/mL), or (E) IL-8 (80 ng/mL) for 24 h with and without CQ (20 μM for last 6 h of treatment).
Figure 4
Figure 4. HNSCC induces CAF autophagy through paracrine secretion of bFGF
(A) Representative IF of NFs in a 1:1 co-culture with HNSCC (HN5) with and without CQ (80 μM for 2 h) with cytokeratin 14 HNSCC label (red), LC3 (green) and hoescht (blue) nuclear stain (20x magnification). Graph depicts cumulative results of LC3 puncta per cell counted by a blinded observer of CQ treated wells in at least 20 cells per group, results cumulative of three experiments using two different NF patient samples and presented relative to NF. (B) Representative IF of NF with and without bFGF (100 ng/mL for 24 h) with CQ flux inhibition (80 μM for final 2 h of bFGF treatment), LC3 (green), hoescht nuclear (blue) (20x magnification). Graph depicts cumulative results of LC3 puncta per cell counted by blinded observer of NF +/− bFGF + CQ in at least 20 cells per group, and results are cumulative of three experiments using two different NF patient samples. (C) Representative IF of NF, or NF co-cultured with either control siRNA transfected HNSCC (HN5) (siCon) or bFGF siRNA transfected HNSCC (sibFGF) in a 1:1 ratio. CQ (80 μM for 2 h) was used to inhibit flux. LC3 (green) and hoescht (blue) are visualized at 20X magnification. Graph depicts cumulative results of LC3 puncta counted per cell in CQ treated wells of at least 39 cells per group, and presented relative to NF alone. (E) Representative immunoblot of bFGF (100 ng/mL for 24 h) with and without CQ (20 μM for 6 h) treated NF of LC3 and phospho-p70S6K (Thr389).
Figure 5
Figure 5. Autophagy inhibition significantly reduces HNSCC progression observed by in vitro models
(A) CQ reduces HNSCC (UM-SCC-1) proliferation with IC50=11.51 μM over 72 h. (B&C) CQ mitigates HNSCC (UM-SCC-1) (B) migration and (C) invasion at IC50 concentration. Migration and Invasion normalized to cell viability, and graph depicts three experiments plated in duplicate. (D) Combination of CQ (IC50) and Cisplatin (4 μM) significantly reduces HNSCC (UM-SCC-1) proliferation over 72 h graph depicts three experiments plated in triplicate. (E) CFSE labeled HNSCC (HN5) proliferation over 72 h co-cultured in 1:1 ratio with CAFs with and without pre-treatment of Beclin-1 siRNA knockdown, and with and without CQ (IC50) throughout 72-hour co-culture. Graph depicts results of two separate experiments using two different CAF patient samples, plated in duplicate (F) SAR405 reduces HNSCC proliferation with IC50=7.92 μM over 72 h, graph depicts three experiments plated in triplicate. (G) Representative immunoblot of increasing doses of SAR405 with and without CQ flux inhibition (20 μM for 6 h). Experiment repeated twice. (H) Representative immunoblot of 1.0 μM SAR405 on CAF with and without CQ flux inhibition (20 μM for 6 h). Experiment repeated twice. All error bars represent ±SEM.
Figure 6
Figure 6. Autophagy inhibition significantly reduces HNSCC progression in vivo
(A) Representative IF images of LC3 (green) puncta in 4-NQO induced HNSCC model progression from normal tongue epithelium, low grade squamous intraepithelial lesion (LSIL), high grade squamous intraepithelial lesion (HSIL), carcinoma in situ (CIS), and invasive squamous cell carcinoma (Invasive SCCa) at 20x magnification, top, and 60x magnification, bottom. Arrowheads depict LC3 puncta accumulation. Blue is nuclear stain. White box indicates area of 60x image. (B) Representative electron microscopy images of sections from CAF and HNSCC (UM-SCC-1) injected subcutaneously into nude male mice. CQ (162 μg/mL oral gavage) treatment significantly enhanced autophagosome accumulation. (C) Autophagosomes per cell were counted by blinded observer from at least 48 cells from two different mice per treatment group. (D) Autophagy inhibition potentiates standard of care therapy. 1:1 admixture of CAF & HNSCC (UM-SCC-1) were injected subcutaneously in nude female mice. Mice were treated with cisplatin (3 mg/kg i.p. 1x/week), chloroquine (162 mg/kg oral gavage, 5 days/week) or SAR405 (50 μL intratumoral injection of 10μM SAR405 in PBS) (n=9/group). Tumor volumes were assessed by a blinded observer. (E) Autophagosomes counted by blinded observer of at least 13 cells from two different mice per treatment group of Vehicle control, SAR405, Cisplatin, and combination Cisplatin & SAR405.
Figure 7
Figure 7. Autophagy is overexpressed in patient fibroblasts, and overexpression of autophagy initiator, BECN1, is correlated with poor survival
(A) Representative IF of LC3 (green) vimentin (red), or hoesct (blue) in normal tonsil from cancer free patients and HNSCC. Graph depicts LC3 puncta/fibroblast (as determined by vimentin positivity in spindle shaped cells) of 12 fibroblasts from 10 each of cancer-free and HNSCC patients (120 fibroblasts per group) and normalized to normal tonsil, error bars represent ±SEM. (B) LC3 (MAP1LC3B) overexpression does not significantly correlate with survival. Data downloaded from TCGA HNSC cohort, and stratified by median MAP1LC3B RNA expression (RSEM). High expression was determined by primary tumor patient samples that had greater expression than median (Log2 Expression RSEM) (High Expression n=283; low expression n=283). (C) BECN1 overexpression correlates with poor patient survival. Data downloaded from TCGA HNSC cohort, and stratified by median BECN1 RNA expression (RSEM). High expression was determined by primary tumor patient samples that had greater expression than median (0.00525 Log2 Expression RSEM) (High Expression n=283; low expression n=283). (D) Schematic representation of the mechanism of autophagy induction in CAFs by HNSCC that facilitates HNSCC progression.

References

    1. Siegel RL, Miller KD, Jemal A. Cancer statistics, 2015. CA Cancer J Clin. 2015;65:5–29. - PubMed
    1. Leemans CR, Braakhuis BJM, Brakenhoff RH. The molecular biology of head and neck cancer. Nat Rev Cancer. 2011;11:9–22. - PubMed
    1. Quail DF, Joyce JA. Microenvironmental regulation of tumor progression and metastasis. Nat Med. 2013;19:1423–37. - PMC - PubMed
    1. Wheeler SE, Shi H, Lin F, Dasari S, Bednash J, Thorne S, et al. Tumor associated fibroblasts enhance head and neck squamous cell carcinoma proliferation, invasion, and metastasis in preclinical models. Head & neck. 2014;36:385–92. - PMC - PubMed
    1. Bergers G, Hanahan D. Modes of resistance to anti-angiogenic therapy. Nat Rev Cancer. 2008;8:592–603. - PMC - PubMed

MeSH terms