. 2017 Nov 1;199(9):3212-3221.
doi: 10.4049/jimmunol.1700982. Epub 2017 Oct 2.

CD8+ T Cells Prevent Lethality from Neonatal Murine Roseolovirus Infection

Affiliations

CD8+ T Cells Prevent Lethality from Neonatal Murine Roseolovirus Infection

Swapneel J Patel et al. J Immunol. .

Abstract

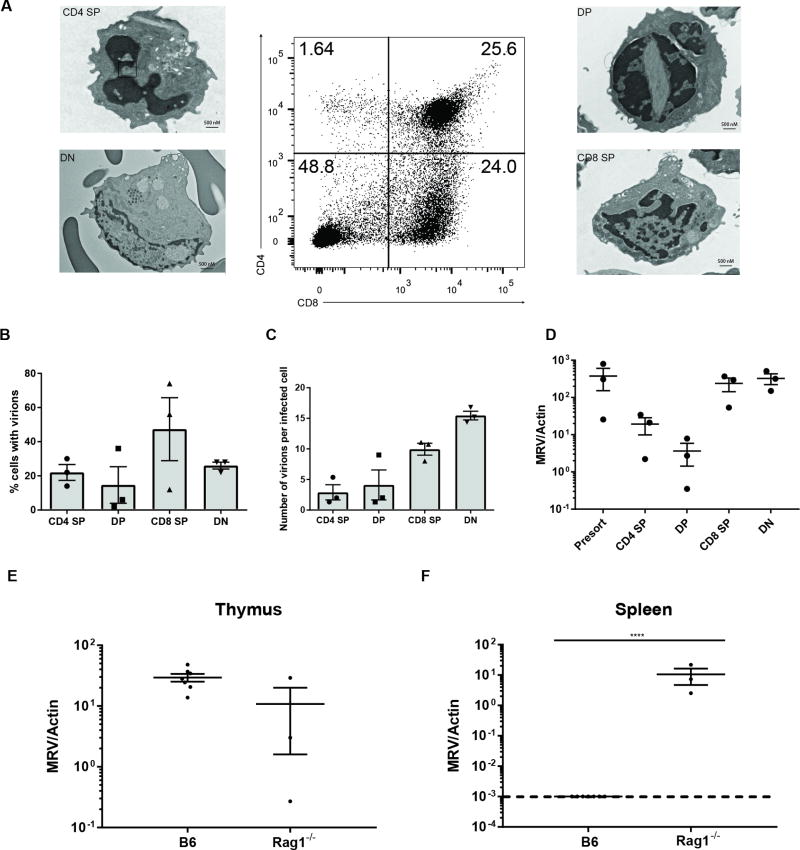
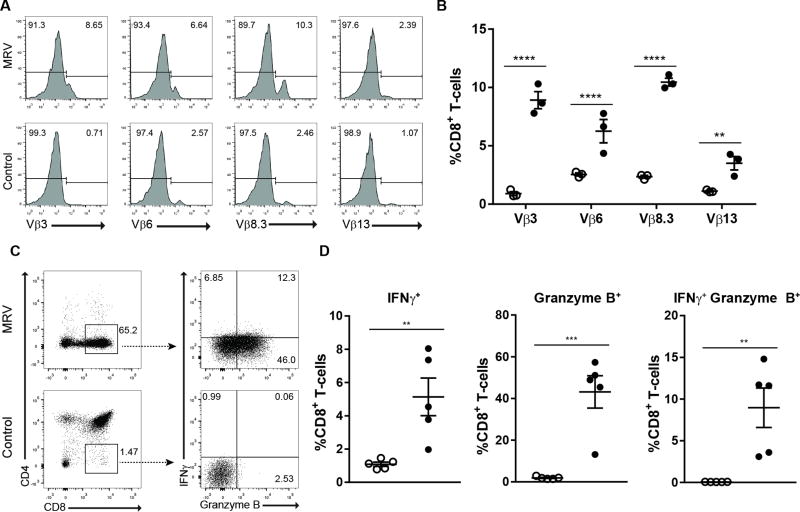
A recently described mouse homolog of the human roseoloviruses, murine roseolovirus (MRV), causes loss of peripheral and thymic CD4+ cells during neonatal infection of BALB/c mice. Despite significant disruptions to the normal adaptive immune response, infected BALB/c mice reproducibly recover from infection, consistent with prior studies on a related virus, mouse thymic virus. In this article, we show that, in contrast to published studies on mouse thymic virus, MRV appears to robustly infect neonatal C57BL/6 (B6) mice, causing severe depletion of thymocytes and peripheral T cells. Moreover, B6 mice recovered from infection. We investigated the mechanism of thymocyte and T cell loss, determining that the major thymocyte subsets were infected with MRV; however, CD4+ and CD4+CD8- T cells showed increased apoptosis during infection. We found that CD8+ T cells populated MRV-infected thymi. These CD8+ T cells expressed markers of activation, had restricted TCR repertoire, and accumulated intracellular effector proteins, consistent with a cytotoxic lymphocyte phenotype and suggesting their involvement in viral clearance. Indeed, absence of CD8+ T cells prevented recovery from MRV infection and led to lethality in infected animals, whereas B cell-deficient mice showed CD4+ T cell loss but recovered from infection without lethality. Thus, these results demonstrate that CD8+ T cells are required for protective immunity against a naturally occurring murine pathogen that infects the thymus and establish a novel infection model for MRV in B6 mice, providing the foundation for detailed future studies on MRV with the availability of innumerable mutant mice on the B6 background.


Figures

FIGURE 1
FIGURE 1
C57BL/6 mice have CD4+ T-cell depletion after neonatal MRV infection. P0 neonatal C57BL/6 mice were infected i.p. with MRV. (A and B) Flow cytometry on thymus and spleen 10 days p.i. with MRV. Thymus cells were gated on live lymphocytes and spleen cells were gated on live, CD3+, TCRβ+, lymphocytes with dot plots (A), frequency, and absolute quantification (B). (C) MRV genome copy numbers expressed as a ratio to mouse actin genome copy numbers at 1 week p.i. Open circles represent uninfected mice; filled circles represent infected mice. Data in A and B are representative of three independent experiments with N=6–8 per experiment. Data in C are representative of two independent experiments N=4–6 per experiment. Cell number and frequency were compared using unpaired, two-tailed t tests. Statistical significance defined as **** p < 0.0001
FIGURE 2
FIGURE 2
C57BL/6 mice recover from MRV infection. P0 neonatal C57BL/6 mice were infected i.p. with MRV. (A and B) Flow cytometry on thymus and spleen 7 weeks p.i. with MRV. Thymus cells were gated on live lymphocytes and spleen cells were gated on live, CD3+, TCRβ+, lymphocytes with dot plots (A), frequency, and absolute quantification (B). (C and D) MRV genome copy numbers (expressed as a ratio to mouse actin genome copy numbers) at 1 week or 7 weeks p.i. in the thymus(C) or the spleen (D) Open circles represent uninfected mice; filled circles represent infected mice. Data are representative of three independent experiments with N=5–6 per experiment. Cell number and frequency were compared using unpaired, two-tailed t tests. Statistical significance defined as *** p < 0.001, * p < 0.05
FIGURE 3
FIGURE 3
Thymocytes are directly infected with MRV. (A–D) P0 neonatal C57BL/6 mice were infected i.p. with Murine Roseolovirus (MRV). (A–C) Transmission Electron Microscopy (TEM) of FACS sorted fractions. Thymocytes were pregated on live lymphocytes (A) Representative images of sorted fractions from day 5–6 p.i.. (B) Percentage of cells scored positive for presence of herpesvirus virions (N=100 per fraction) (C) Number of scored virions per infected cell (D) MRV genome copy number expressed as a ratio to mouse actin genome copy numbers from the indicated sorted fraction of thymus from mice 5–6 days p.i.. (E and F) MRV genome copy numbers (expressed as a ratio to mouse actin genome copy numbers) from B6 or Rag1−/− mice at 10 days p.i. in the thymus (E) or the spleen (F) Data are pooled from three independent experiments. Cell number and frequency were compared using unpaired, two-tailed t tests. Viral titers were compared using unpaired, two tailed t tests on log10 relative genome copies. Statistical significance defined as ** p < 0.01; *** p < 0.001, **** p < 0.0001
FIGURE 4
FIGURE 4. CD4 expressing thymocytes undergo increased apoptosis after MRV infection
(A–C) Flow cytometry from thymi of mice day 5.5 p.i.. Early apoptotic cells defined as Annexin V+ Viability Dye. Late apoptotic cells defined as Annexin V+ Viability Dye+. Open circles represent uninfected mice; filled circles represent infected mice (D) Representative flow cytometry. Cell frequency was compared using unpaired, two-tailed t tests. Statistical significance defined as ** p < 0.01; *** p < 0.001, **** p < 0.0001
FIGURE 5
FIGURE 5
Mature CD8+ T-cells with effector phenotype infiltrate MRV infected thymi. P0 neonatal C57BL/6 mice were infected i.p. with Murine Roseolovirus (MRV). Thymi analyzed by flow cytometry. Thymocytes were pregated on live lymphocytes (A and B) Representative flow cytometry, absolute number and frequency of CD8ISP (CD8+CD4 CD24+ TCRβlow) cells or mature CD8+ T-cells (CD8+CD4 CD24 TCRβhigh) in infected or control thymi. (C) Representative flow cytometry for surface CD8β on CD8+ T-cells (D) Geometric mean fluorescence intensity of TCRβ from infected or control thymi. (E and F) Representative flow cytometry (E) and absolute number (F) of CD62L, CD44, CD69 and KLRG1 expression on CD8+ T-cells Open circles represent uninfected mice; filled circles represent infected mice. Data are representative of two or more independent experiments with N=3–5 per experiment. Cell number and frequency were compared using unpaired, two-tailed t tests. Statistical significance defined as ** p < 0.01; *** p < 0.001, **** p < 0.0001
FIGURE 6
FIGURE 6
Thymic CD8+ T-cells with a restricted TCR Vβ repertoire and intracellular effector molecules accumulate in MRV infected mice.(A and B) Representative flow cytometry (A) and frequency (B) of TCR Vβ3, 6, 8.3 and 13 on CD8+ T-cells (C and D) Representative flow cytometry (C) and frequencies (D) from intracellular staining of unstimulated thymocytes for Interferon γ (IFNγ) and Granzyme B. Open circles represent uninfected mice; filled circles represent infected mice. Data are representative of two or more independent experiments with N=3–5 per experiment. Cell number and frequency were compared using unpaired, two-tailed t tests. Statistical significance defined as ** p < 0.01; *** p < 0.001, **** p < 0.0001
FIGURE 7
FIGURE 7
CD8+ T-cells but not mature B-cells are required for recovery after MRV infection. P0 neonatal C57BL/6 mice were infected i.p. with Murine Roseolovirus (MRV). (A) Time course from flow cytometry on peripheral blood from CD8−/− mice. (B) Kaplan Meier curve comparing infected with uninfected CD8−/− animals. (C) Time course from flow cytometry on peripheral blood from µMT mice. (D) Kaplan Meier curve comparing infected with uninfected µMT animals. (E and F) MRV genome copy number from thymus (E) or spleen (F) of P0 infected mice harvested on day 7 p.i. from B6 mice or CD8−/− mice. (G and H) MRV genome copy number from thymus (G) or spleen (H) of P0 infected mice harvested on day 21 p.i. from B6 mice or CD8−/− mice. (I) Kaplan Meier curve comparing infected with uninfected TCRβ−/− animals. Gray points and lines represent uninfected mice; black points and lines represent infected mice. Data in A and C are representative of two independent experiments with N=3–6 in each group. Data in B and D are pooled from two independent experiments with N=12 and N=10 respectively. Data in E–H are pooled from two independent experiments N=4–7. Data in I are pooled from two independent experiments N=6–9. Viral titers were compared using unpaired, two tailed t tests on log10 relative genome copies. Survival analyses were conducted using the log-rank Mantel-Cox test. Statistical significance defined as ** p < 0.01; *** p < 0.001, **** p < 0.0001

References

    1. Braun DK, Dominguez G, Pellett PE. Human herpesvirus 6. Clinical microbiology reviews. 1997;10:521–567. - PMC - PubMed
    1. Blazsek A, Sillo P, Ishii N, Gergely P, Jr, Poor G, Preisz K, Hashimoto T, Medvecz M, Karpati S. Searching for foreign antigens as possible triggering factors of autoimmunity: Torque Teno virus DNA prevalence is elevated in sera of patients with bullous pemphigoid. Exp Dermatol. 2008;17:446–454. - PubMed
    1. Shimazu Y, Kondo T, Ishikawa T, Yamashita K, Takaori-Kondo A. Human herpesvirus-6 encephalitis during hematopoietic stem cell transplantation leads to poor prognosis. Transplant infectious disease : an official journal of the Transplantation Society. 2013;15:195–201. - PubMed
    1. Yamashita N, Morishima T. HHV-6 and seizures. Herpes : the journal of the IHMF. 2005;12:46–49. - PubMed
    1. Kondo K, Nagafuji H, Hata A, Tomomori C, Yamanishi K. Association of human herpesvirus 6 infection of the central nervous system with recurrence of febrile convulsions. J Infect Dis. 1993;167:1197–1200. - PubMed

Publication types

MeSH terms

LinkOut - more resources