. 2017 Nov 6;216(11):3831-3846.
doi: 10.1083/jcb.201703042. Epub 2017 Sep 28.

Postsynaptic adhesion GPCR latrophilin-2 mediates target recognition in entorhinal-hippocampal synapse assembly

Affiliations

Postsynaptic adhesion GPCR latrophilin-2 mediates target recognition in entorhinal-hippocampal synapse assembly

Garret R Anderson et al. J Cell Biol. .

Abstract

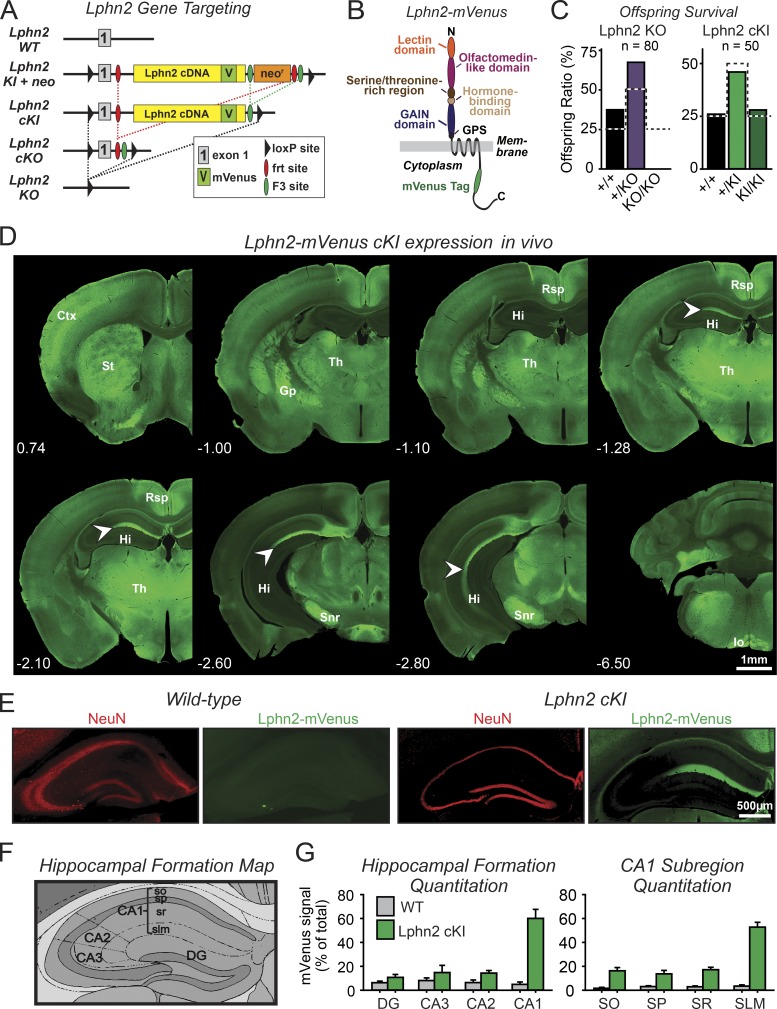
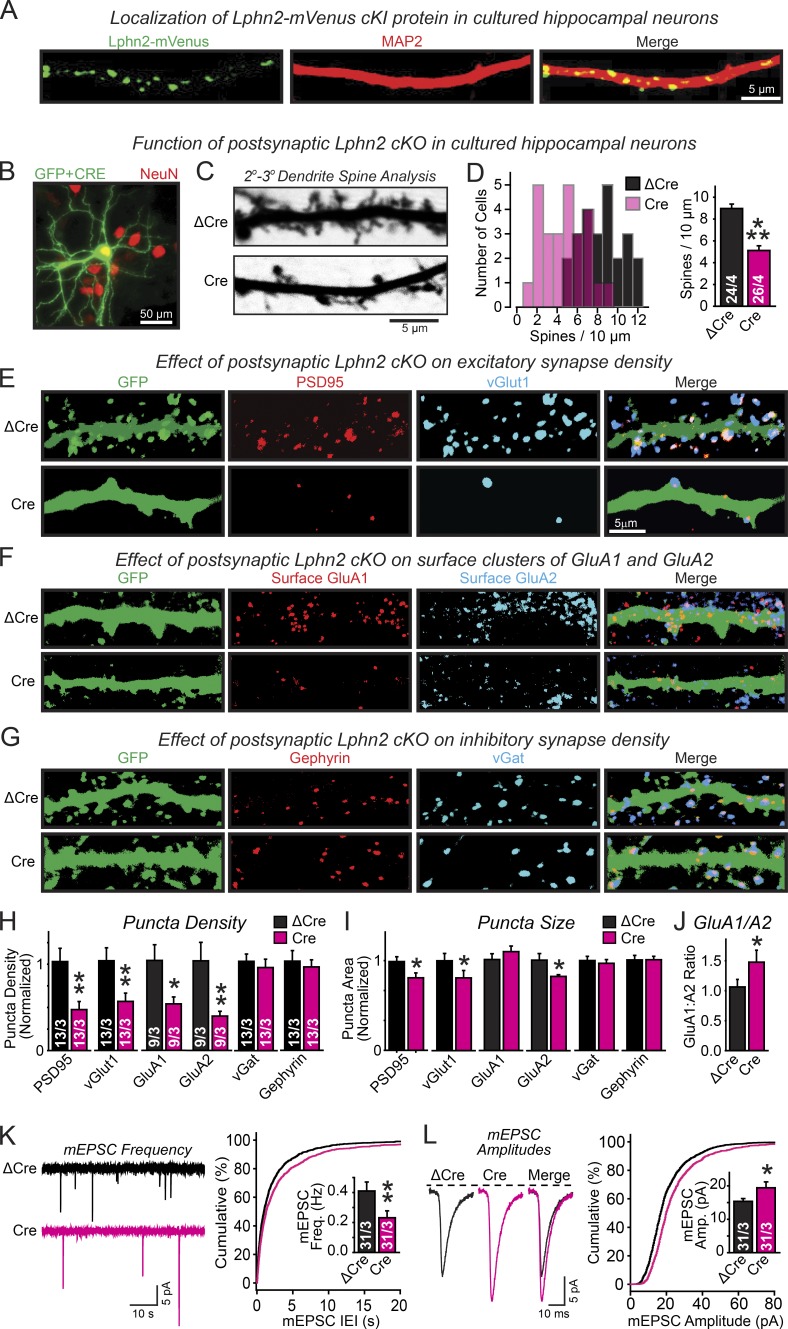
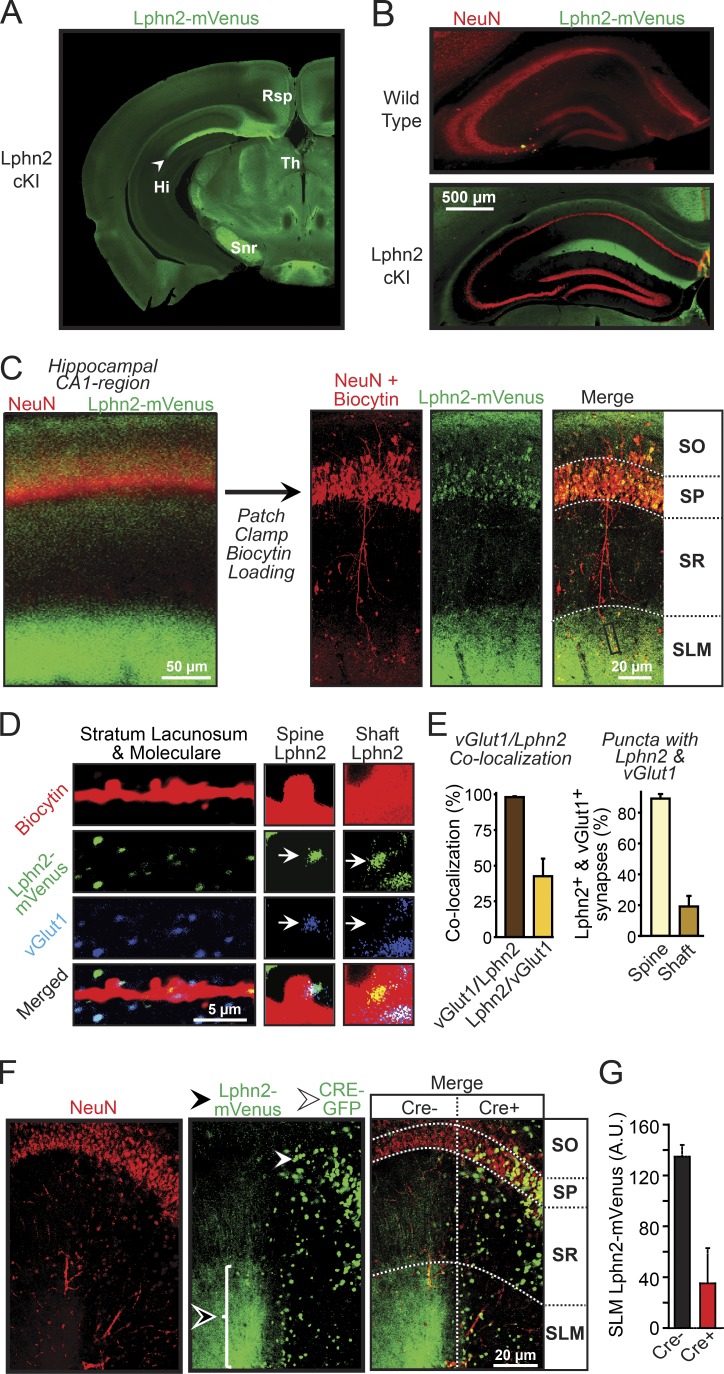
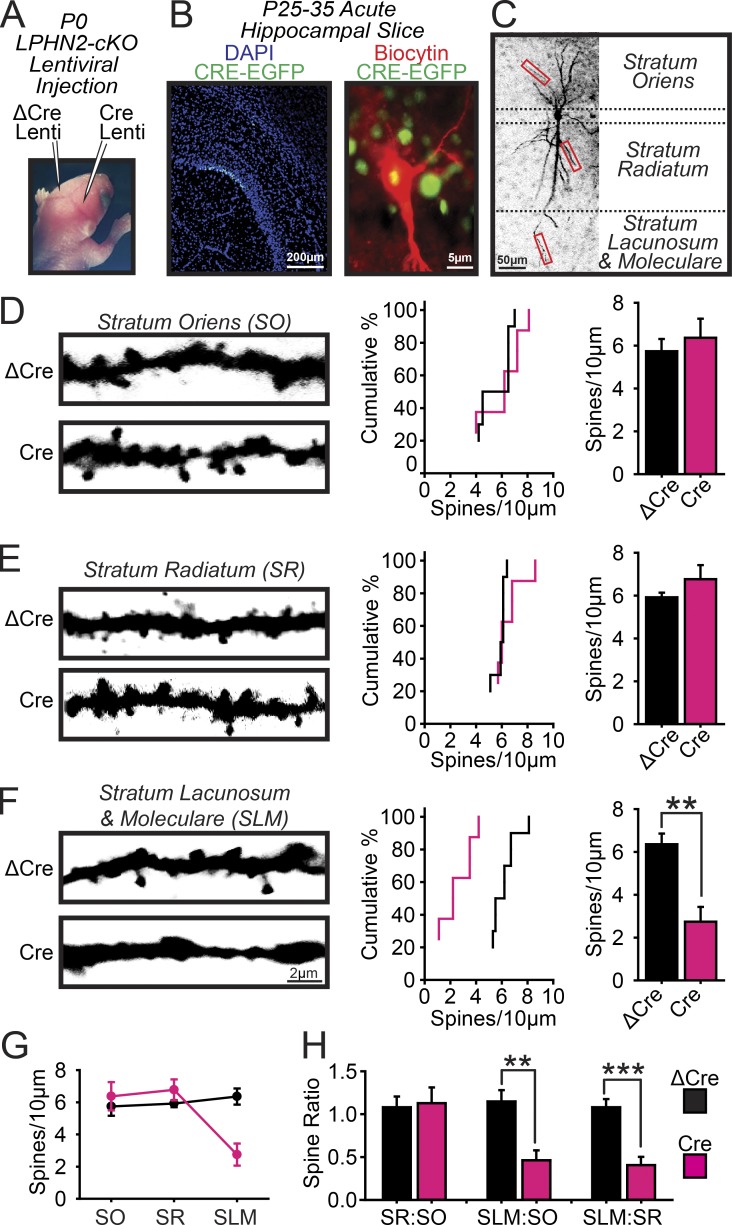
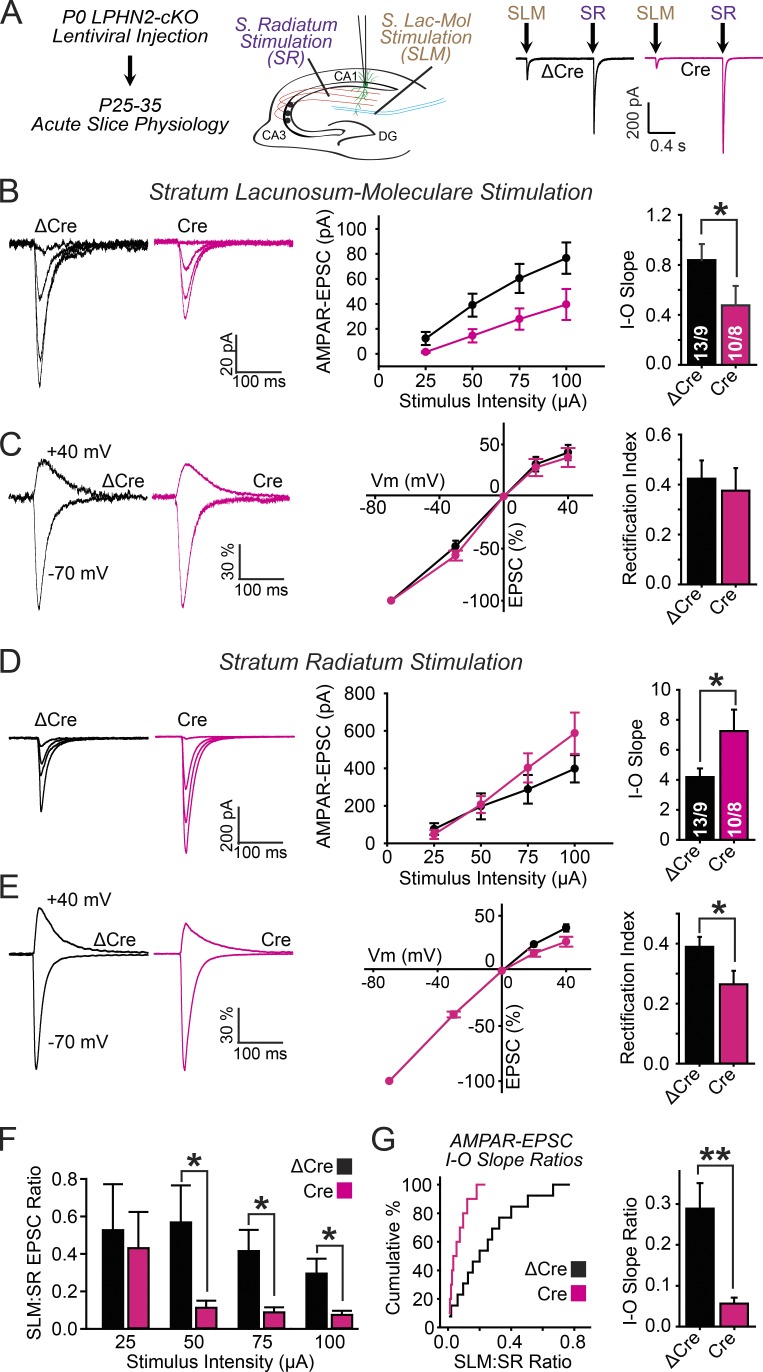
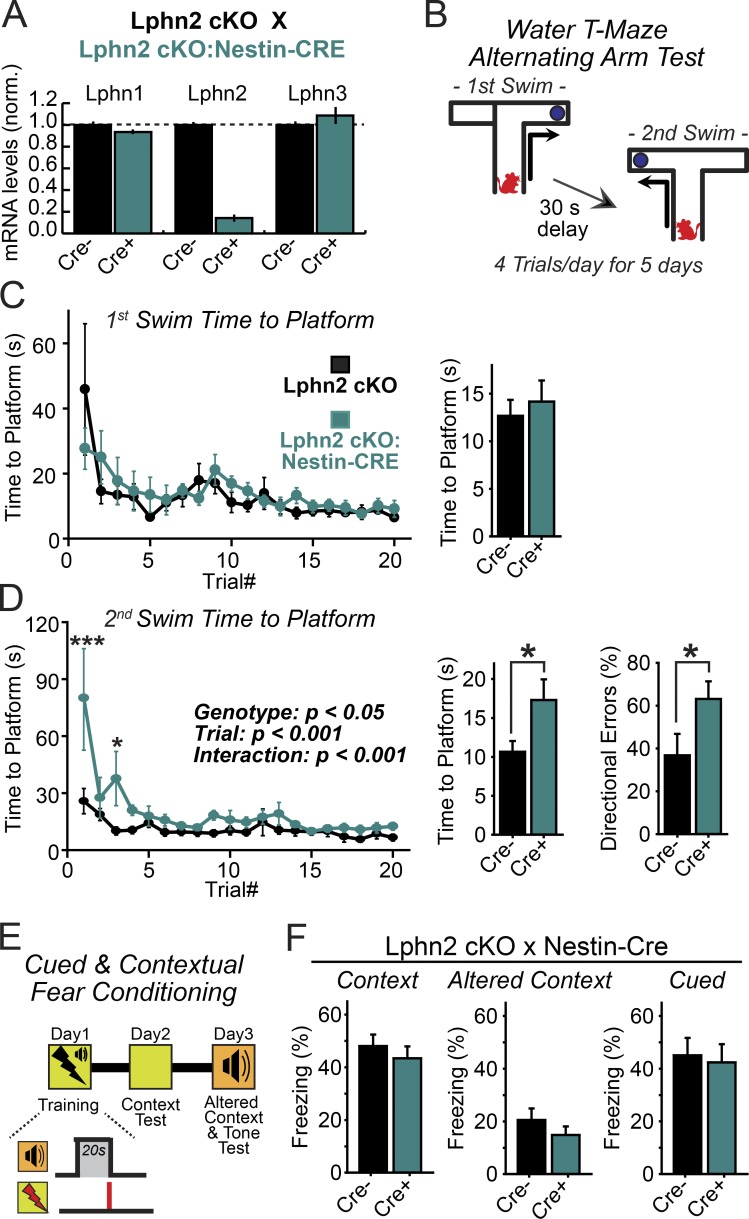
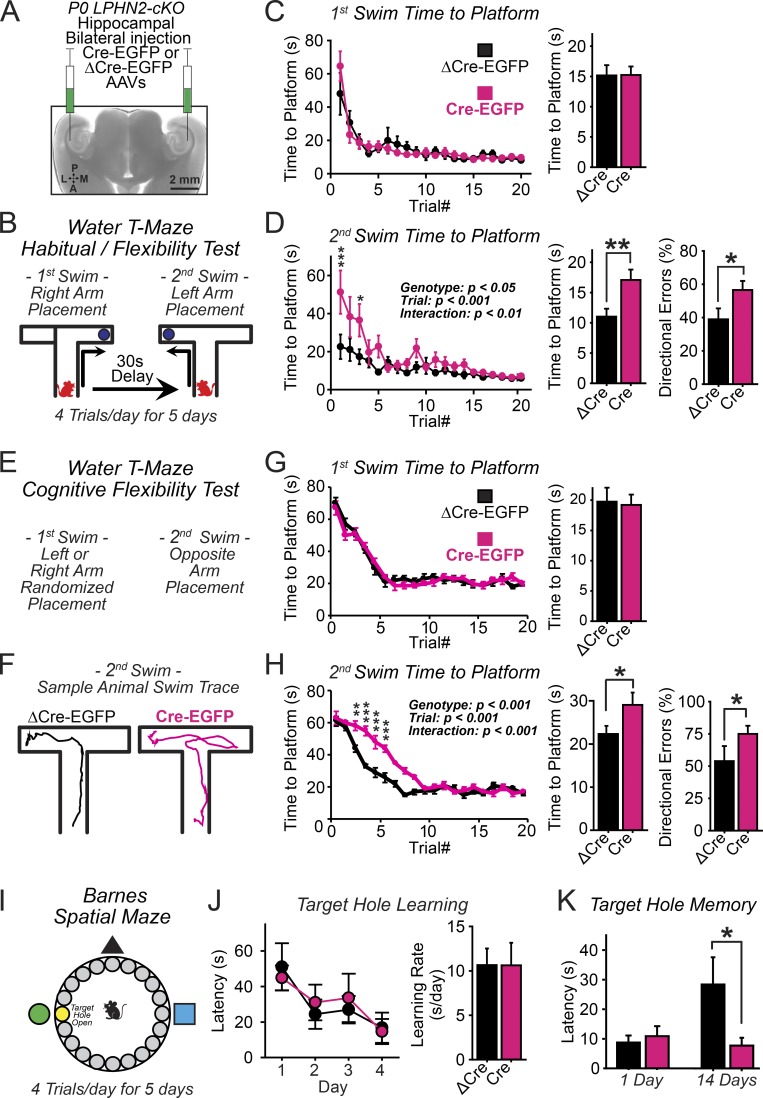
Synapse assembly likely requires postsynaptic target recognition by incoming presynaptic afferents. Using newly generated conditional knock-in and knockout mice, we show in this study that latrophilin-2 (Lphn2), a cell-adhesion G protein-coupled receptor and presumptive α-latrotoxin receptor, controls the numbers of a specific subset of synapses in CA1-region hippocampal neurons, suggesting that Lphn2 acts as a synaptic target-recognition molecule. In cultured hippocampal neurons, Lphn2 maintained synapse numbers via a postsynaptic instead of a presynaptic mechanism, which was surprising given its presumptive role as an α-latrotoxin receptor. In CA1-region neurons in vivo, Lphn2 was specifically targeted to dendritic spines in the stratum lacunosum-moleculare, which form synapses with presynaptic entorhinal cortex afferents. In this study, postsynaptic deletion of Lphn2 selectively decreased spine numbers and impaired synaptic inputs from entorhinal but not Schaffer-collateral afferents. Behaviorally, loss of Lphn2 from the CA1 region increased spatial memory retention but decreased learning of sequential spatial memory tasks. Thus, Lphn2 appears to control synapse numbers in the entorhinal cortex/CA1 region circuit by acting as a domain-specific postsynaptic target-recognition molecule.


Figures

Figure 1.
Figure 1.
Development of conditional Lphn2-mVenus knock-in and Lphn2 KO mice. Lphn2-mVenus protein localized to discrete brain nuclei and subcellular domains including the SLM of the hippocampal CA1 region. (A) Gene targeting strategy for Lphn2-mVenus cKI and Lphn2 cKO and constitutive KO mice. (B) Domain architecture of Lphn2-mVenus protein. GPS, GPCR proteolysis site. (C) Constitutive KO of Lphn2 caused embryonic lethality, whereas the Lphn2-mVenus knock-in (KI) did not impair survival (summary graphs of surviving offspring from heterozygous matings; dotted lines indicate survival expected from Mendelian inheritance). (D) Lphn2 mVenus expression in vivo. Coronal sections of the brain from an adult Lphn2-mVenus cKI mouse were labeled using GFP antibodies to detect Lphn2-mVenus protein (green). Indicated coronal section distances are in millimeters relative to Bregma. Arrowheads indicate spine- or shaft-associated Lphn2 puncta. Ctx, cortex; Gp, globus pallidus; Hi, hippocampus; Io, inferior olive; Rsp, retrosplenial cortex; Snr, substantia nigra pars reticulata; St, striatum; Th, thalamus. Note that one of the panels is presented again in Fig. 3 A. (E) Representative immunohistochemistry images of WT and Lphn2-mVenus cKI coronal sections of the hippocampus stained for GFP (to label Lphn2-mVenus) and NeuN (to label neuronal nuclei). Note that a GFP/NeuN merged image of this panel is presented again in Fig. 3 B. (F) Topographical map of the major regions and subregions of the hippocampal formation (CA3, CA2, and CA1, equivalent regions; DG, dentate gyrus; stratum oriens [so], stratum pyramidale [sp], stratum radiatum [sr], and SLM, CA1–3 subregions). Image adapted from the Allen Institute for Brain Science. (G) Quantitation of Lphn2-mVenus signal in indicated hippocampal regions (left) and CA1-region subregions (right). Graphs show means ± SEM (WT, n = 3; cKI, n = 4 mice at ~P30).
Figure 2.
Figure 2.
Lphn2 functions in cultured hippocampal neurons as a postsynaptic protein that is selectively essential for excitatory synapses. (A) Lphn2-mVenus localization probed in hippocampal neurons cultured from Lphn2-mVenus cKI mice by immunocytochemistry for GFP (labeling the mVenus-tagged Lphn2; green) and MAP2 (red). (B) Representative image of hippocampal neurons cultured from Lphn2 cKO mice and sparsely transfected with Cre-EGFP and cytosolic GPF to visualize neuron morphology. Transfections were performed at DIV 4 and analyzed at DIV 14–16 (green, GFP; red, NeuN counterstain to label of neuronal nuclei). (C) Representative images of dendrites from neurons cotransfected with GFP and either inactive (ΔCre) or active Cre recombinase (Cre). (D) Postsynaptic deletion of Lphn2 by sparse transfection of cultured hippocampal Lphn2 cKO neurons with Cre (using ΔCre as a control transfection) decreases the spine density (left, histogram of the number of neurons vs. spine density; right, summary graph of mean spine density). (E–G) Representative images of neurons analyzed by dual immunofluorescence labeling for the excitatory synapse markers PSD95 and vGlut1 (E), for surface AMPARs (GluA1 and GluA2; F), and for the inhibitory synapse markers gephyrin and vGat (G). (H–J) Summary graphs of the density (H) and apparent size of synaptic puncta (I) as well as of the ratio of synaptic puncta size for GluA1 compared with GluA2 (J) analyzed on secondary/tertiary dendrites in Lphn2-deficient (Cre) and control neurons (ΔCre) labeled as described in E–G. (K and L) Lphn2 deletion decreases the frequency of spontaneous mEPSCs (K; left, representative traces; right, cumulative distribution of interevent intervals [inset, mean event frequencies]), but increases the mEPSC amplitude (L; left, mean of mEPSC event traces; right, cumulative distributions of event amplitudes [inset, mean amplitudes]). Data are means ± SEM; numbers of neurons/independent cultures examined are shown in the graphs. Statistical analyses used Student’s t test. *, P < 0.05; **, P < 0.01; ***, P < 0.001. IEI, interevent interval.
Figure 3.
Figure 3.
Postsynaptic Lphn2 is specifically targeted to and essential for dendritic spines in the SLM of CA1-region pyramidal neurons. (A) Representative coronal brain section (−2.6 mm from Bregma) from Lphn2-mVenus cKI mice stained for mVenus analyzed at ~P30. Note that this image is same as one of the panels in Fig. 1 D. Hi, hippocampus; Rsp, retrosplenial cortex; Snr, substantia nigra pars reticulate; Th, thalamus. (B) Representative coronal sections of the hippocampus from WT and Lphn2-mVenus cKI mice stained for mVenus and the neuronal nuclear protein NeuN. Note that this image is an overlay of the same images shown in Fig. 1 E. (C) Biocytin loading of individual pyramidal neurons to analyze dendritic spines (left, image of a CA1-region hippocampal section labeled for NeuN and Lphn2-mVenus; right, similar images of sections that were additionally stained for biocytin after a single pyramidal neuron had been filled with biocytin via a patch pipette). (D) High-magnification image of the distal dendrites in the SLM of a biocytin-filled pyramidal CA1-region neuron from a Lphn2-mVenus cKI mouse (left), and further enlarged images (2.5×) of spines and shafts from these dendrites (right). CA1-region sections were stained for biocytin (red), mVenus (green), and vGluT1 (blue) after the filling of an individual pyramidal neuron with biocytin via the patch pipette. Arrows indicate spine- or shaft-associated puncta. (E) Quantification of the percent vGlut1-positive puncta that were also Lphn2 positive (left bar in left graph) or vice versa (right bar in left graph) and of the distribution of synaptic puncta positive for both Lphn2-mVenus and vGlut1 on dendritic spines or shafts (right graph; n = 2 mice). (F) Representative hippocampal sections from mice after lentiviral Cre recombinase expression in patches of CA1-region neurons using stereotactic injections at P21. Sections were stained for NeuN and GFP (detects both Lphn2-mVenus expression in the SLM [black arrowhead] as well as nuclear Cre-EGFP in infected cells [white arrowhead]). Note that Lphn2-mVenus signal is removed from SLM areas that are connected to pyramidal neurons expressing Cre-EGFP. Horizontal dotted lines indicate boundary lines for the subregions of the CA1 region; the vertical dotted line indicates Cre− and Cre+ regions. (G) Quantification of the Lphn2-mVenus signal in the SLM associated with CA1-region neurons lacking (Cre−) or containing Cre recombinase (Cre+; means ± SEM; n = 4 mice at ~P30). SO, stratum oriens; SP, stratum pyramidale; SR, stratum radiatum.
Figure 4.
Figure 4.
Postsynaptic deletion of Lphn2 ablates dendritic spines in the SLM but not the stratum oriens or stratum radiatum of CA1-region pyramidal neurons. (A–C) Experimental strategy. (A) The CA1 regions of opposite hemispheres in newborn Lphn2 cKO mice were stereotactically injected with lentiviruses expressing Cre (test) or ΔCre (control). (B) An individual pyramidal neuron was filled with biocytin via a patch pipette in acute hippocampal slices from injected mice (left, low-magnification image of sparsely CRE-EGFP–infected hippocampus; right, high-magnification view of the soma of a lentivirally infected biocytin-filled neuron surrounded by other lentivirally infected neurons with nuclear EGFP fluorescence). (C) Delineation of dendritic segments that were analyzed by quantitative immunohistochemistry (boxes indicate example areas where spine analysis was performed). (D–F) Lphn2 deletion decreases the spine density on CA1 pyramidal neuron dendrites selectively in the SLM. Spines were analyzed on dendrites in the stratum oriens (D), stratum radiatum (E), and SLM (F; left, representative confocal images of secondary dendrites; middle, cumulative probability plots of the number of spines per 10 µm dendrite; right, summary graphs of spine densities; n = 5 ΔCre and 4 Cre mice at P25–35). (G) Plot of the spine density in dendrites of pyramidal neurons from the CA1 region of the hippocampus shown in absolute densities as a function of the subregions in which the dendrites are present. (H) Ratio analysis of CA1 pyramidal neurons across the CA1 subregions including stratum oriens, stratum pyramidale, stratum radiatum, and SLM. Means ± SEM; statistical analyses were performed using Student’s t test. **, P < 0.01; ***, P < 0.001.
Figure 5.
Figure 5.
Postsynaptic Lphn2 deletion in CA1-region pyramidal neurons impairs excitatory synaptic transmission of entorhinal cortex inputs but enhances excitatory synaptic transmission of CA3-region Schaffer collateral inputs. (A) Experimental design. Lentiviruses expressing Cre (test) and ΔCre (control) were stereotactically injected into the CA1 region of P0 Lphn2 cKO mice (see Fig. 4 A). Dual-input patch-clamp recordings on the same lentivirally infected CA1-region pyramidal neurons in acute hippocampal slices at P25–35–aged mice were performed using independent stimulating electrodes that excited synaptic inputs from the entorhinal cortex (placed on the SLM proximal to the entorhinal cortex) and from CA3-region Schaffer collaterals (placed on the stratum radiatum proximal to the CA3 region). (B) Measurements of synaptic strength via input/output (I-O) curves (left, representative EPSC traces; middle, summary plot of the EPSC amplitudes as a function of the stimulus current; right, summary graph of fitted linear input/output slopes). (C) Rectification index analysis of AMPAR-EPSCs (left, representative EPSC traces monitored in neurons held at −70 or +40 mV; middle, summary plots of EPSC amplitudes as a function of the holding potential normalized to the EPSC amplitude recorded at a −70-mV holding potential; right, summary graphs of the rectification index calculated as the ratio of EPSC amplitudes recorded at +40 vs. −70 mV holding potentials). VM, membrane voltage. (D and E) Same as B and C, except that AMPAR-EPSCs were recorded in the same neurons as in B and C as a function of stratum radiatum stimulation. (F) Summary graphs of the ratio of AMPAR-EPSC amplitudes recorded for SLM and stratum radiatum inputs at the indicated electrode stimulation strengths. (G, left) SLM to stratum radiatum input/output slope ratio plotted as cumulative distributions; (right) SLM to stratum radiatum input/output slope ratio summary graph. Plots and graphs shown are means ± SEM; the numbers of neurons/animals examined are shown in the graphs. Statistical analyses were performed using Student’s t test. *, P < 0.05; **, P < 0.01.
Figure 6.
Figure 6.
Lphn2 is dispensable in the brain for spatial and contextual memory formation but is essential for establishing temporal memory sequences. (A) Lphn2 cKO female mice were crossed to male Lphn2 cKO (Nestin-Cre) mice to generate offspring that were homozygous for Lphn2 cKO and either negative (CRE−) or positive (CRE+) for the Cre transgene. Age-matched adult mice brains (>P30) were analyzed for Lphn1–3 mRNA expression by quantitative RT-PCR analysis (n = 4 mice). (B) Experimental design for the alternating water T-maze memory test. Mice were trained for 5 d four times a day to first swim into the right arm of a water T-maze and subsequently into the left arm after a 30-s delay. (C) Summary plots (left) and graphs (right; averaged across all trials) of the time to platform during the first T-maze swim. (D) Summary plots (left) and graphs (center; averaged across all trials) of the time to platform and directional error rate (right; averaged across all trials) during the second swim. Animals analyzed were littermate control mice or mice with Nestin-Cre recombinase–induced deletion of Lphn2 from brain (n = 8 littermate mice; P60–90). Summary plots: statistical analyses were performed using repeated-measure ANOVA with post hoc comparisons. Summary graphs: statistical analyses were performed using Student’s t test. *, P < 0.05; ***, P < 0.001. (E) Experimental design for fear memory analyses using mice with transgenic Nestin-Cre recombinase–mediated Lphn2 deletion from the entire brain. (F) Normal cued and contextual fear memory in both an altered and training context in littermate control mice or mice lacking Lphn2 in brain (n = 11 littermate mice; P60–90). Plots and graphs shown are means ± SEM.
Figure 7.
Figure 7.
Hippocampal specific elimination of Lphn2 expression impairs learning of temporal memory sequences but enhances long-term spatial memory. (A) Experimental strategy. The CA1 region of the hippocampus of newborn Lphn2 cKO mice was bilaterally injected with inactive (ΔCre) or active (Cre) Cre recombinase–expressing AAVs, and mice were analyzed behaviorally at 2–3 mo of age. (B) Design of the alternating water T-maze habit forming cognitive flexibility test. Mice were trained to first swim into the right arm of a water T-maze and then after a 30-s delay into the left arm (5 d of training with four trials daily). (C) Summary plots (left) and graphs (right; averaged across all trials) of the time to platform during the first T-maze swim. (D) Summary plots (left) and graphs (center; averaged across all trials) of the time to platform and directional error rate (right; averaged across all trials) during the second swim (n = 9 littermate mice at P60–90). Summary plots: statistical analyses were performed using repeated-measure ANOVA with post hoc comparisons. Summary graphs: statistical analyses were performed using Student’s t test. (E) Design of the water T-maze cognitive flexibility test. Same as B, but directions were randomly altered between trials. (F) Representative mouse paths during the second swim recorded using video tracking software. (G) Summary plots (left) and graphs (right; averaged across all trials) of the time to platform during the first T-maze swim. (H) Summary plots (left) and graphs (center; averaged across all trials) of the time to platform and directional error rate (right; averaged across all trials) during the second swim. (n = 10 ΔCre and 10 Cre mice; P60–90). Summary plots: statistical analyses were performed using repeated-measure ANOVA with post hoc comparisons. Summary graphs: statistical analyses were performed using Student’s t test. (I) Experimental design of the Barnes maze test. (J) Summary plot (left) and graph of the target-hole learning rate, calculated as the slope of a fitted linear regression. (K) Summary graph of the target-hole memory at 1 and 14 d after training, analyzed in mice with AAV injections into the hippocampal CA1 region (n = 9 littermate mice; P60–90). Statistical analyses were performed using Student’s t test. Plots and graphs shown are means ± SEM. *, P < 0.05; **, P < 0.01; ***, P < 0.001.

References

    1. Akins M.R., and Biederer T.. 2006. Cell-cell interactions in synaptogenesis. Curr. Opin. Neurobiol. 16:83–89. 10.1016/j.conb.2006.01.009 - DOI - PubMed
    1. Aoto J., Martinelli D.C., Malenka R.C., Tabuchi K., and Südhof T.C.. 2013. Presynaptic neurexin-3 alternative splicing trans-synaptically controls postsynaptic AMPA receptor trafficking. Cell. 154:75–88. 10.1016/j.cell.2013.05.060 - DOI - PMC - PubMed
    1. Araç D., Boucard A.A., Bolliger M.F., Nguyen J., Soltis S.M., Südhof T.C., and Brunger A.T.. 2012. A novel evolutionarily conserved domain of cell-adhesion GPCRs mediates autoproteolysis. EMBO J. 31:1364–1378. 10.1038/emboj.2012.26 - DOI - PMC - PubMed
    1. Barnes C.A. 1979. Memory deficits associated with senescence: a neurophysiological and behavioral study in the rat. J. Comp. Physiol. Psychol. 93:74–104. 10.1037/h0077579 - DOI - PubMed
    1. Boucard A.A., Ko J., and Südhof T.C.. 2012. High affinity neurexin binding to cell adhesion G-protein-coupled receptor CIRL1/latrophilin-1 produces an intercellular adhesion complex. J. Biol. Chem. 287:9399–9413. 10.1074/jbc.M111.318659 - DOI - PMC - PubMed

Publication types

MeSH terms

Associated data

LinkOut - more resources