. 2017 Nov 1;37(44):10611-10623.
doi: 10.1523/JNEUROSCI.3888-16.2017. Epub 2017 Sep 29.

Zic-Proteins Are Repressors of Dopaminergic Forebrain Fate in Mice and C. elegans

Affiliations

Zic-Proteins Are Repressors of Dopaminergic Forebrain Fate in Mice and C. elegans

Marie-Catherine Tiveron et al. J Neurosci. .

Abstract

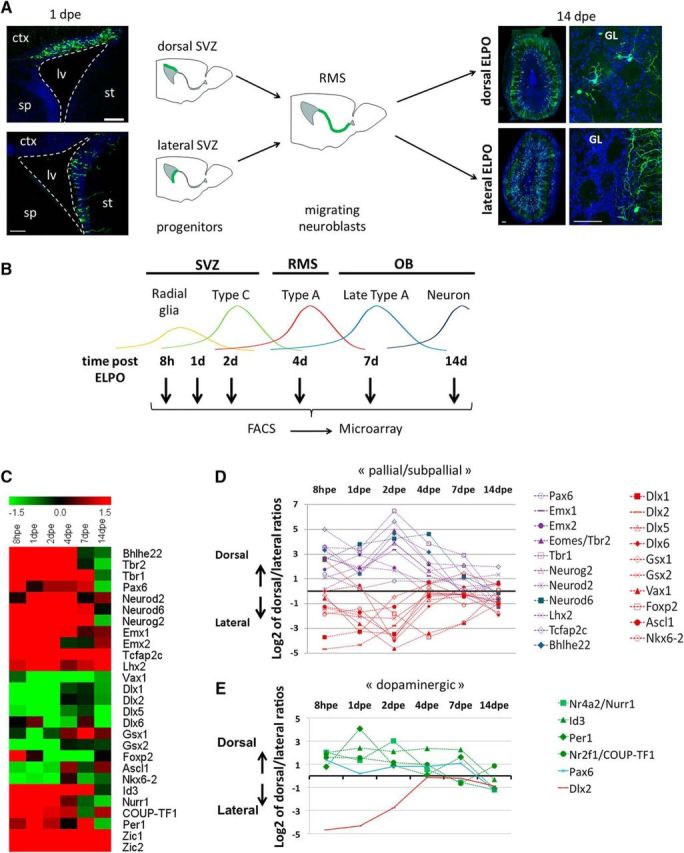
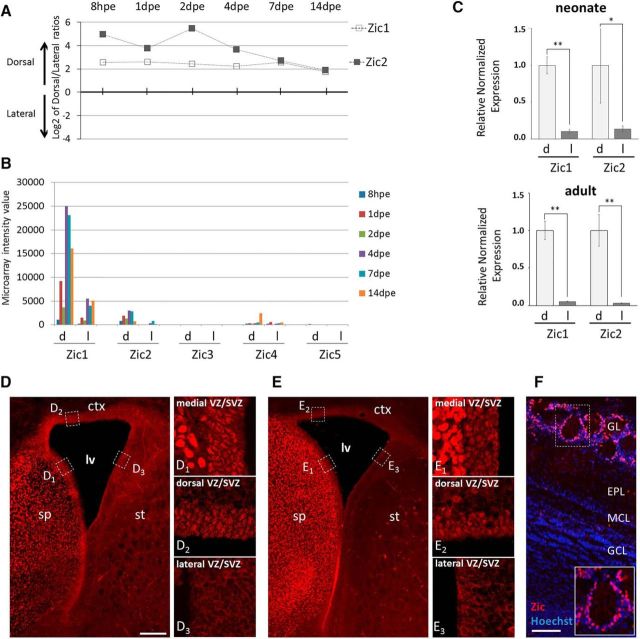
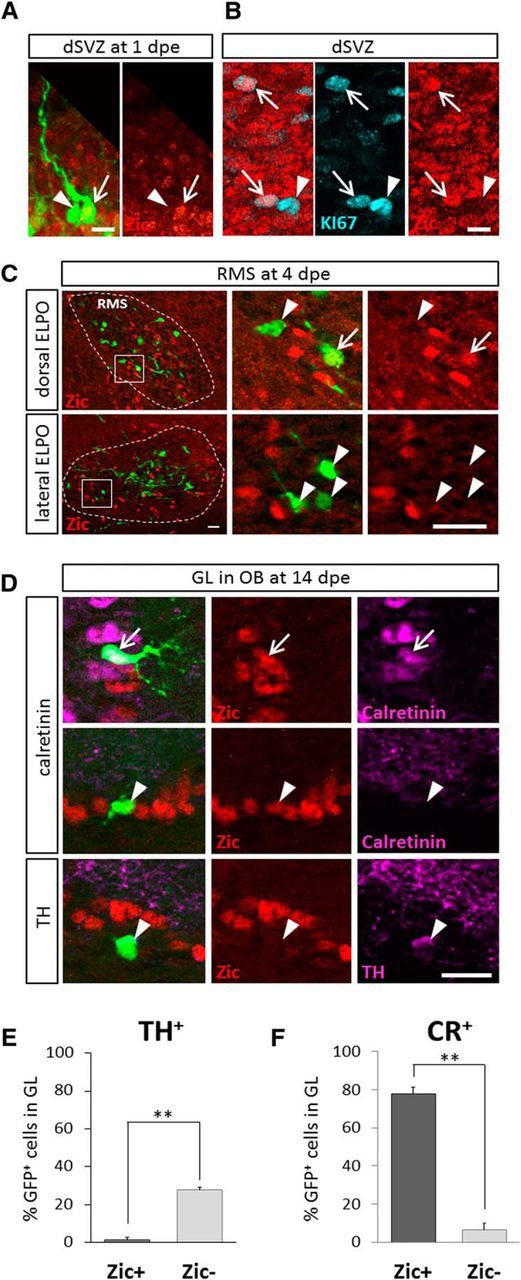
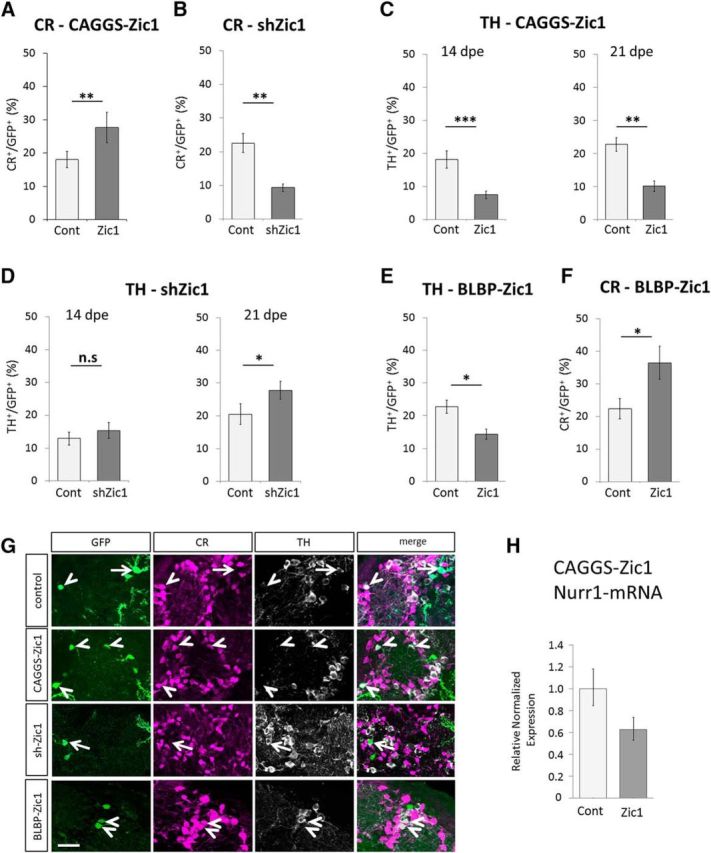
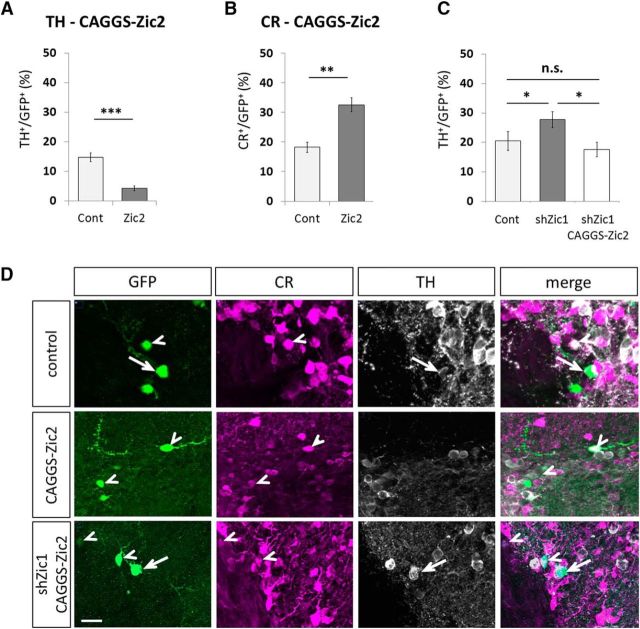
In the postnatal forebrain regionalized neural stem cells along the ventricular walls produce olfactory bulb (OB) interneurons with varying neurotransmitter phenotypes and positions. To understand the molecular basis of this region-specific variability we analyzed gene expression in the postnatal dorsal and lateral lineages in mice of both sexes from stem cells to neurons. We show that both lineages maintain transcription factor signatures of their embryonic site of origin, the pallium and subpallium. However, additional factors, including Zic1 and Zic2, are postnatally expressed in the dorsal stem cell compartment and maintained in the lineage that generates calretinin-positive GABAergic neurons for the OB. Functionally, we show that Zic1 and Zic2 induce the generation of calretinin-positive neurons while suppressing dopaminergic fate in the postnatal dorsal lineage. We investigated the evolutionary conservation of the dopaminergic repressor function of Zic proteins and show that it is already present in C. elegansSIGNIFICANCE STATEMENT The vertebrate brain generates thousands of different neuron types. In this work we investigate the molecular mechanisms underlying this variability. Using a genomics approach we identify the transcription factor signatures of defined neural stem cells and neuron populations. Based thereon we show that two related transcription factors, Zic1 and Zic2, are essential to control the balance between two defined neuron types in the postnatal brain. We show that this mechanism is conserved in evolutionary very distant species.

Keywords: neural stem cells; olfactory bulb; transcription factor.


Figures

Figure 1.
Figure 1.
Gene expression analyses in dorsal and lateral neurogenic lineages from stem cells to neurons. A, Schematic representation of the experimental procedure underlying the gene expression screen. V/SVZ was dorsally or laterally transfected by targeted brain electroporation (ELPO). Photomicrographs (left) represent examples for electroporation of the dorsal and lateral ventricular walls at 1dpe. After migration in the RMS GFP-expressing cells segregate into the different layers of the OB. Dorsally electroporated cells integrate after 14 d mainly into peripheral layers while laterally targeted cells remain centrally (right). B, GFP-expressing cells were harvested at 8 hpe, 1 dpe, and 2 dpe from the V/SVZ, at 4 dpe from the RMS and at 7 and 14 dpe from the OB. Colored curves represent the predominant cell type at a given time point. C, Heat map representation of average ratios (log values) for dorsal versus lateral intensities for all genes mentioned in this study. D, Time course of gene expression dorsal/lateral ratios for key factors implicated in telencephalon development. Pallial (blue curves) and subpallial (red curves) gene expression signatures are maintained in the postnatal dorsal (cortical) and lateral (striatal) lineages. E, Factors implicated in dopaminergic pathways are predominant in the dorsal lineage. Note the progressive induction of expression of the subpallial gene Dlx2 in the dorsal lineage. D, E, The values plotted in graphs represent for each time point the log2 average of dorsal/lateral intensity value of all different experimental repetitions. ctx, Cortex; lv, lateral ventricle; sp, septum; st, striatum. Scale bars, 150 μm.
Figure 2.
Figure 2.
Expression of Zic1 and Zic2 in the mouse forebrain neurogenic system. A, Time course of gene expression ratios for Zic1 and Zic2 showing predominance in the dorsal lineage from stem cells to neurons. The values plotted in graphs represent for each time point the log2 average of dorsal/lateral intensity value of all different experimental repetitions. B, Microarray fluorescence intensity value at different time points of postnatal OB neurogenesis in the dorsal (d) and lateral (l) lineages for all five members of the Zic family. C, qRT-PCR analysis for Zic1 and Zic2 expression in microdissected tissue isolated from neonate and adult brains. This validated the dorsal over lateral predominance of both Zic transcripts in neonates. This predominance is maintained at adult stages. Error bars represent the variation between samples (neonate: n = 4, 2 animals/sample, pZic1 = 0.0102, pZic2 = 0.0318; adult: n = 5, 1 animal/sample, pZic1 = 0.0047, pZic2 = 0.0083). D, E, Immunohistochemistry using anti-pan Zic (D) and anti-Zic2 antibody (E) on coronal neonate (P2) brain sections. Comparable reactivity for both antibodies is detected in the medial (D1, E1) and dorsal (D2, E2) stem cell compartment lining the lateral ventricle (lv) but absent from the lateral wall (D3, E3). F, Anti pan-Zic immunohistochemistry on a P4 OB section. Strongly pan-Zic-positive cells are abundant in the GL (boxed area) but absent from the inner OB layers. ctx, cortex; sp, septum; st, striatum; EPL, external plexiform layer; MCL: mitral cell layer. Scale bars: D, E, 150 μm for left panel and 60 μm for right panels; F, 300 μm and 200μm in inset. Error bars represent SEM. *p ≤ 0.05, **p ≤ 0.01.
Figure 3.
Figure 3.
Zic-protein is expressed in the CR-positive GABAergic lineage but absent from dopaminergic neurons. A, B, In the dorsal V/SVZ, Zic protein is expressed in GFP-electroporated radial glia (A) at 1 dpe and in KI67+ dividing progenitors (B) at P2. C, In the RMS at 4dpe a subpopulation of GFP+ cells showed Zic immunoreactivity after dorsal electroporation. Lateral electroporation did not lead to labeled Zic+ cells in the RMS. D, In the GL of the OB, 14 d after dorsal electroporation the majority of Zic+ PGC coexpressed CR (top lane). However, some Zic+ cells were negative for CR (middle lane) but Zic-immunoreactivity was never found in TH-expressing PGC (bottom lane). AD, Arrows indicate double- and arrowheads single-labeled cells. E, F, Quantification of TH and CR expression among Zic+ or Zic GFP cells of the GL at 21 dpe obtained in two independent experiments. Histograms represent the mean per section calculated over randomly selected sections (TH: n = 4, p = 0.0094; CR: n = 5, p = 0.0047; 2–3 sections per animal). Scale bars: A, B, 15 μm; C, D, 20 μm. Error bars represent SEM of intersection variations. **p ≤ 0.01.
Figure 4.
Figure 4.
In vivo functional analyses of Zic1. A, Zic1 overexpression via in vivo brain electroporation increases the amount of CR GABAergic-expressing neurons in the OB at 14 dpe (3 independent experiments; animals: ncontrol = 17, nCAGGS-Zic1 = 17; cells: ncontrol = 1432, nCAGGS-Zic1 = 907; p = 0.0055). B, shRNA-induced Zic1 knockdown significantly reduces CR neurons in the OB at 14 dpe (2 independent experiments, animals: ncontrol = 7, nshZic1 = 8; cells: ncontrol = 537, nshZic1 = 573; p = 0.0056). C, Overexpression of Zic1 in the dorsal compartment decreases dopaminergic neurons at 14 and 21 dpe (14 dpe: 2 independent experiments, animals: ncontrol = 14, nCAGGS-Zic1 = 15; cells: ncontrol = 918, nCAGGS-Zic1 = 656, p = 0.0005; 21 dpe: 1 experiment, animals: ncontrol = 6, nCAGGS-Zic1 = 5; cells: ncontrol = 418, nCAGGS-Zic1 = 388, p = 0.0077). D, shRNA-induced knockdown increases dopaminergic neurons in the OB at 21 dpe but not at 14 dpe (14 dpe: 2 experiments, animals: ncontrol = 11, nshZic1 = 9; cells: ncontrol = 813, nshZic1 = 459, p = 0.4341; 21 dpe: 1 experiment, animals: ncontrol = 7, nshZic1 = 7; cells: ncontrol = 330, nshZic1 = 330, p = 0.0351). E, F, Overexpression of Zic1 under the control of the BLBP promoter reduces TH-expressing neurons in the OB at 21 dpe and increases the amount of CR+ GABAergic neurons (1 experiment, animals: ncontrol = 6, nBLBP-Zic1 = 6; cells: ncontrol = 448, nBLBP-Zic1 = 392; p for TH = 0.0358; p for CR = 0.0291). n.s.: p > 0.05, *p ≤ 0.05, **p ≤ 0.01, ***p ≤ 0.001. Error bars represent SEM. G, Representative images of TH and CR-expressing cells among the GFP electroporated GFP+ cells in the GL at 21 dpe for electroporation with the control vector, pCAGGS-Zic1, pU6-shZic1, and pBLBP-Zic1 vectors. H, qRT-PCR analysis of Nurr1 expression performed on mRNA isolated from FACS sorted SVZ cells 6 d after Zic1 overexpression. RNA samples are issued from the dissection of 10 animals. Error bars represent the variation between four technical repetitions. Arrows: CR-expressing GFP+ neurons. Arrowheads: TH-expressing GFP+ neurons. Scale bars, 20 μm.
Figure 5.
Figure 5.
In vivo functional analyses of Zic2. A, B, Overexpression of Zic2 by in vivo brain electroporation does not significantly change the quantity of CR neurons (A) but does not significantly change the quantity of CR neurons (B); 1 experiment, animals: ncontrol = 8, nCAGGS-Zic2 = 8; cells: ncontrol = 568, nCAGGS-Zic2 = 568; p for CR = 0.00084; p for TH = 0.0023). C, Increase in TH neurons in the OB at 21 dpe after Zic1 knockdown was rescued by overexpression of Zic2 (1 experiment, animals: ncontrol = 7, nshZic1 = 7, nshZic1+CAGGS-Zic2 = 8; cells: ncontrol = 330, nshZic1 = 330, nshZic1+CAGGS-Zic2 = 290; p value Cont vs shZic1 = 0.0351, p value shZic1 vs shZic1+CAGGS-Zic2 = 0.0127). n.s.: p > 0.05, *p ≤ 0.05, **p ≤ 0.01, ***p ≤ 0.001. Error bars represent SEM. D, Representative images of TH and CR-expressing cells among the GFP electroporated GFP+ cells in the GL at 21 dpe, for electroporation with the control vector, pCAGGS-Zic2 vector, and pU6-shZic1 together with pCAGGS-Zic2. Arrows: CR-expressing GFP+ neurons. Arrowheads: TH-expressing GFP+ neurons. Scale bar, 20 μm.
Figure 6.
Figure 6.
Effect of the C. elegans Zic protein REF-2 on dopaminergic fate. A, In the head of wild-type C. elegans larvae six dopaminergic neurons are present (4 CEP and 2 ADE), in ref-2(gk178) mutants extra dopaminergic neurons are observed (marker of dopaminergic neurons used: dat-1::gfp (vtIs1); head of L1 larvae, lateral view, anterior is left, dorsal is up). Scale bar, 5 μm. B, Percentage of L1 larvae displaying one or two extra neurons expressing dat-1::gfp (n = number of animals, error bars show standard error of proportion; ***p = 3.9 × 10⁻²¹, Fisher's exact test). C, Percentage of L1 larvae displaying one extra neuron expressing cat-4::gfp (otIs225) in the dorsal region (n = number of animals, error bars show standard error of proportion; *** p = 1.4 × 10⁻⁶, Fisher's exact test). D, Percentage of L1 larvae expressing dat-1::gfp in 6, 5, …, 1, or 0 dopaminergic neurons in absence (black bar) or presence (gray bar) of ref-2 overexpression (n = number of animals). ref-2 Overexpression does not block all neuronal differentiation as it does not affect the expression of klp-6, a marker of the unrelated neuronal class IL2 (without ref-2 ectopic expression 20/20 animals express klp-6::gfp (myIs13) in the six IL2 neurons; with ref-2 ectopic expression 25/25 animals express klp-6::gfp in the six IL2 neurons). E, Percentage of L1 larvae displaying extra neurons expressing dat-1::gfp (vtIs1) in the dorsal region (dark gray) or ventral region (light gray; n = number of animals, error bars show standard error of proportion). The effect of ref-2 and ced-4 mutations is additive suggesting that the extra neurons expressing dat-1::gfp observed in ref-2 mutants do not come from a loss of cell death. F, The two extra dopaminergic neurons observed in ref-2(gk178) mutants (extra DA labeled with dat-1::gfp) are located just posterior to the pairs of cholinergic neurons IL2 dorsal (IL2D) and URA dorsal [URAD; labeled with cho-1::mcherry (otIs544)]. Dorsal view of the head of a L1 larva, anterior is left. Scale bar, 2 μm. G, Expression of ref-2::gfp (fosmid translational reporter, wgIs520) in the pair of IL1D glutamatergic neurons, located just posterior to the pairs of cholinergic neurons IL2D and URAD [labeled with cho-1::mcherry (otIs544)]. Dorsal view of the head of a L1 larva, anterior is left. Scale bar, 2 μm. H, Percentage of L1 larvae expressing the IL1 neuron marker flp-3 (flp-3::gfp, ynIs21) in 6, 5, or 4 IL1 neurons (n = number of animals, error bars show standard error of proportion; ***p = 1.1 × 10⁻¹⁶, Fisher's exact test). I, Percentage of L1 larvae expressing the URYD neuron marker ser-1 (ser-1::gfp, vuEx172) in one or both URYD neurons (n = number of animals, error bars show standard error of proportion; ***p = 0.002, Fisher's exact test). J, Percentage of L1 larvae expressing the IL2 neuron marker klp-6 (klp-6::gfp, myIs13) in every IL2 neurons (n = number of animals, error bars show standard error of proportion).

References

    1. Ali RG, Bellchambers HM, Arkell RM (2012) Zinc fingers of the cerebellum (Zic): transcription factors and co-factors. Int J Biochem Cell Biol 44:2065–2068. 10.1016/j.biocel.2012.08.012 - DOI - PubMed
    1. Alper S, Kenyon C (2002) The zinc finger protein REF-2 functions with the Hox genes to inhibit cell fusion in the ventral epidermis of C. elegans. Development 129:3335–3348. - PubMed
    1. Alvarez-Buylla A, Garcia-Verdugo JM (2002) Neurogenesis in adult subventricular zone. J Neurosci 22:629–634. - PMC - PubMed
    1. Alvarez-Buylla A, Kohwi M, Nguyen TM, Merkle FT (2008) The heterogeneity of adult neural stem cells and the emerging complexity of their niche. Cold Spring Harb Symp Quant Biol 73:357–365. 10.1101/sqb.2008.73.019 - DOI - PubMed
    1. Anderson DJ, Groves A, Lo L, Ma Q, Rao M, Shah NM, Sommer L (1997a) Cell lineage determination and the control of neuronal identity in the neural crest. Cold Spring Harb Symp Quant Biol 62:493–504. 10.1101/SQB.1997.062.01.056 - DOI - PubMed

Publication types