

Activity Patterns Elicited by Airflow in the Olfactory Bulb and Their Possible Functions
- PMID: 28972124
- PMCID: PMC6596515
- DOI: 10.1523/JNEUROSCI.2210-17.2017
Activity Patterns Elicited by Airflow in the Olfactory Bulb and Their Possible Functions
Abstract
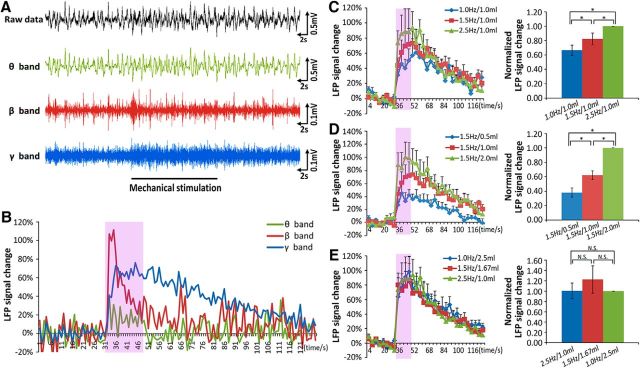
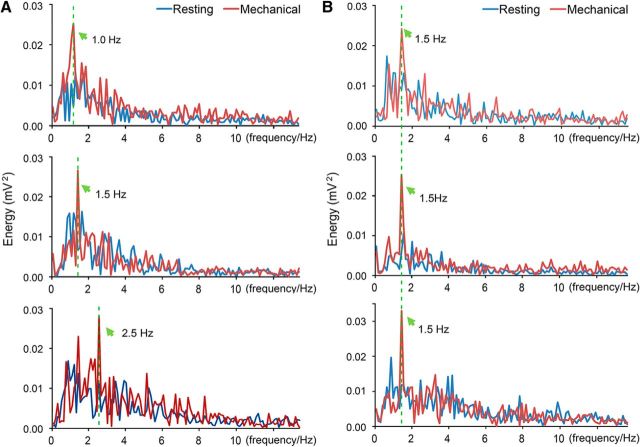
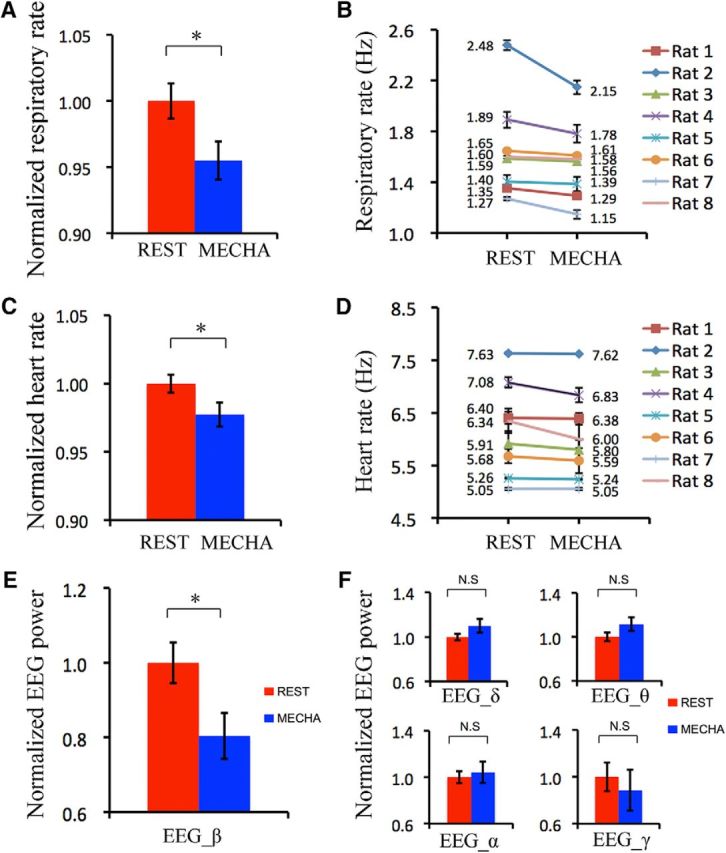
Olfactory sensory neurons (OSNs) can sense both odorants and airflows. In the olfactory bulb (OB), the coding of odor information has been well studied, but the coding of mechanical stimulation is rarely investigated. Unlike odor-sensing functions of OSNs, the airflow-sensing functions of OSNs are also largely unknown. Here, the activity patterns elicited by mechanical airflow in male rat OBs were mapped using fMRI and correlated with local field potential recordings. In an attempt to reveal possible functions of airflow sensing, the relationship between airflow patterns and physiological parameters was also examined. We found the following: (1) the activity pattern in the OB evoked by airflow in the nasal cavity was more broadly distributed than patterns evoked by odors; (2) the pattern intensity increases with total airflow, while the pattern topography with total airflow remains almost unchanged; and (3) the heart rate, spontaneous respiratory rate, and electroencephalograph power in the β band decreased with regular mechanical airflow in the nasal cavity. The mapping results provide evidence that the signals elicited by mechanical airflow in OSNs are transmitted to the OB, and that the OB has the potential to code and process mechanical information. Our functional data indicate that airflow rhythm in the olfactory system can regulate the physiological and brain states, providing an explanation for the effects of breath control in meditation, yoga, and Taoism practices.SIGNIFICANCE STATEMENT Presentation of odor information in the olfactory bulb has been well studied, but studies about breathing features are rare. Here, using blood oxygen level-dependent functional MRI for the first time in such an investigation, we explored the global activity patterns in the rat olfactory bulb elicited by airflow in the nasal cavity. We found that the activity pattern elicited by airflow is broadly distributed, with increasing pattern intensity and similar topography under increasing total airflow. Further, heart rate, spontaneous respiratory rate in the lung, and electroencephalograph power in the β band decreased with regular airflow in the nasal cavity. Our study provides further understanding of the airflow map in the olfactory bulb in vivo, and evidence for the possible mechanosensitivity functions of olfactory sensory neurons.
Keywords: airflow map; airflow rhythm; functional MRI; mechanosensitivity; olfactory bulb.
Copyright © 2017 the authors 0270-6474/17/3710700-12$15.00/0.
Figures
Similar articles
-
Mechanosensory-Based Phase Coding of Odor Identity in the Olfactory Bulb.Neuron. 2017 Dec 6;96(5):1139-1152.e7. doi: 10.1016/j.neuron.2017.11.008. Neuron. 2017. PMID: 29216451
-
Differences in olfactory bulb mitral cell spiking with ortho- and retronasal stimulation revealed by data-driven models.PLoS Comput Biol. 2021 Sep 20;17(9):e1009169. doi: 10.1371/journal.pcbi.1009169. eCollection 2021 Sep. PLoS Comput Biol. 2021. PMID: 34543261 Free PMC article.
-
Timing of odor stimulation does not alter patterning of olfactory bulb unit activity in freely breathing rats.J Neurophysiol. 1993 Apr;69(4):1331-7. doi: 10.1152/jn.1993.69.4.1331. J Neurophysiol. 1993. PMID: 8492167
-
Odor maps in the brain: spatial aspects of odor representation in sensory surface and olfactory bulb.Cell Mol Life Sci. 2001 Apr;58(4):520-30. doi: 10.1007/PL00000877. Cell Mol Life Sci. 2001. PMID: 11361087 Free PMC article. Review.
-
Odor representations in the mammalian olfactory bulb.Wiley Interdiscip Rev Syst Biol Med. 2010 Sep-Oct;2(5):603-611. doi: 10.1002/wsbm.85. Wiley Interdiscip Rev Syst Biol Med. 2010. PMID: 20836051 Review.
Cited by
-
TMC6 functions as a GPCR-like receptor to sense noxious heat via Gαq signaling.Cell Discov. 2024 Jun 18;10(1):66. doi: 10.1038/s41421-024-00678-9. Cell Discov. 2024. PMID: 38886367 Free PMC article.
-
Olfactory Epithelium Stimulation Using Rhythmic Nasal Air-Puffs Improves the Cognitive Performance of Individuals with Acute Sleep Deprivation.Brain Sci. 2024 Apr 13;14(4):378. doi: 10.3390/brainsci14040378. Brain Sci. 2024. PMID: 38672027 Free PMC article.
-
Complex neural representation of odour information in the olfactory bulb.Acta Physiol (Oxf). 2020 Jan;228(1):e13333. doi: 10.1111/apha.13333. Epub 2019 Jul 2. Acta Physiol (Oxf). 2020. PMID: 31188539 Free PMC article. Review.
-
Brief Sensory Deprivation Triggers Cell Type-Specific Structural and Functional Plasticity in Olfactory Bulb Neurons.J Neurosci. 2021 Mar 10;41(10):2135-2151. doi: 10.1523/JNEUROSCI.1606-20.2020. Epub 2021 Jan 22. J Neurosci. 2021. PMID: 33483429 Free PMC article.
-
Augmentation of Whole-Body Metabolic Status by Mind-Body Training: Synchronous Integration of Tissue- and Organ-Specific Mitochondrial Function.Med Sci Monit Basic Res. 2019 Jan 11;25:8-14. doi: 10.12659/MSMBR.913264. Med Sci Monit Basic Res. 2019. PMID: 30631032 Free PMC article. Review.
References
Publication types
MeSH terms
LinkOut - more resources
Full Text Sources
Other Literature Sources
Miscellaneous