. 2017 Nov 8;37(45):10904-10916.
doi: 10.1523/JNEUROSCI.1188-17.2017. Epub 2017 Oct 2.

Distinct Laterality in Forelimb-Movement Representations of Rat Primary and Secondary Motor Cortical Neurons with Intratelencephalic and Pyramidal Tract Projections

Affiliations

Distinct Laterality in Forelimb-Movement Representations of Rat Primary and Secondary Motor Cortical Neurons with Intratelencephalic and Pyramidal Tract Projections

Shogo Soma et al. J Neurosci. .

Abstract

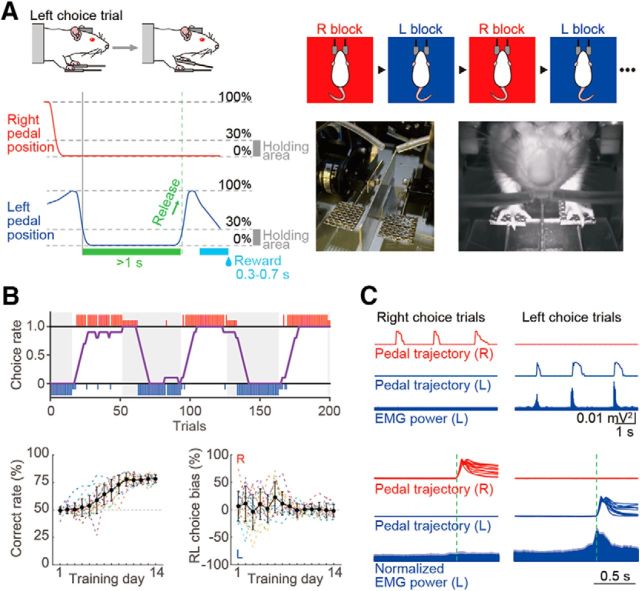
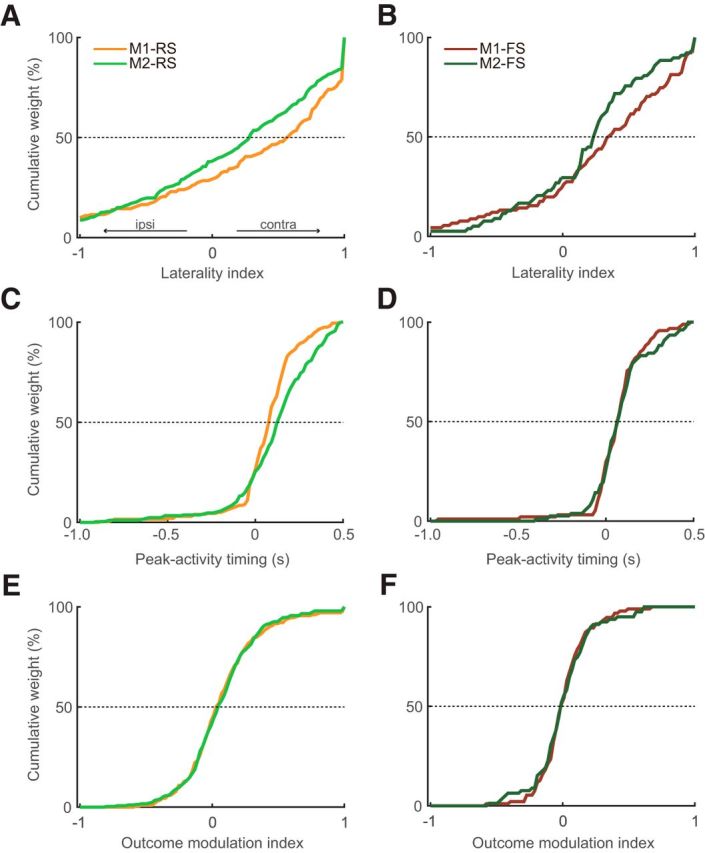
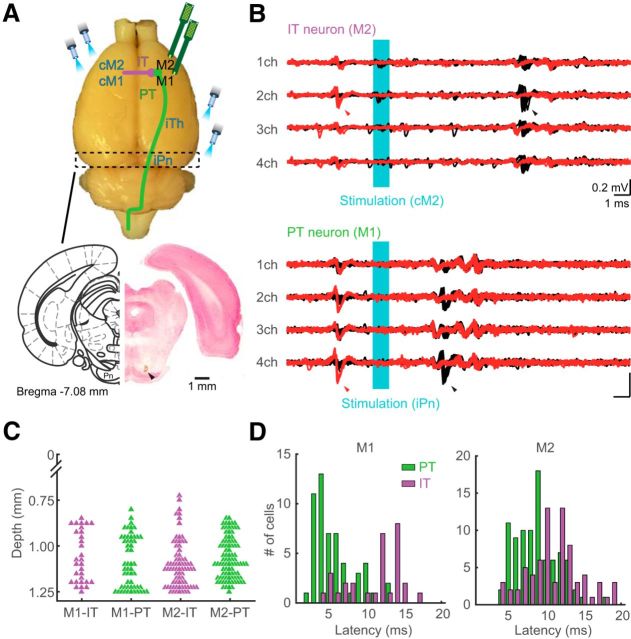
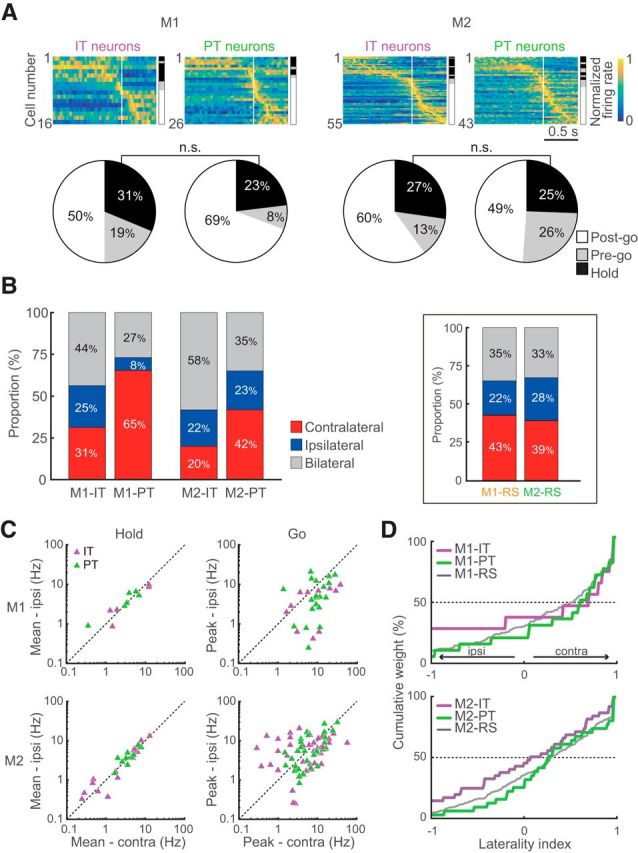
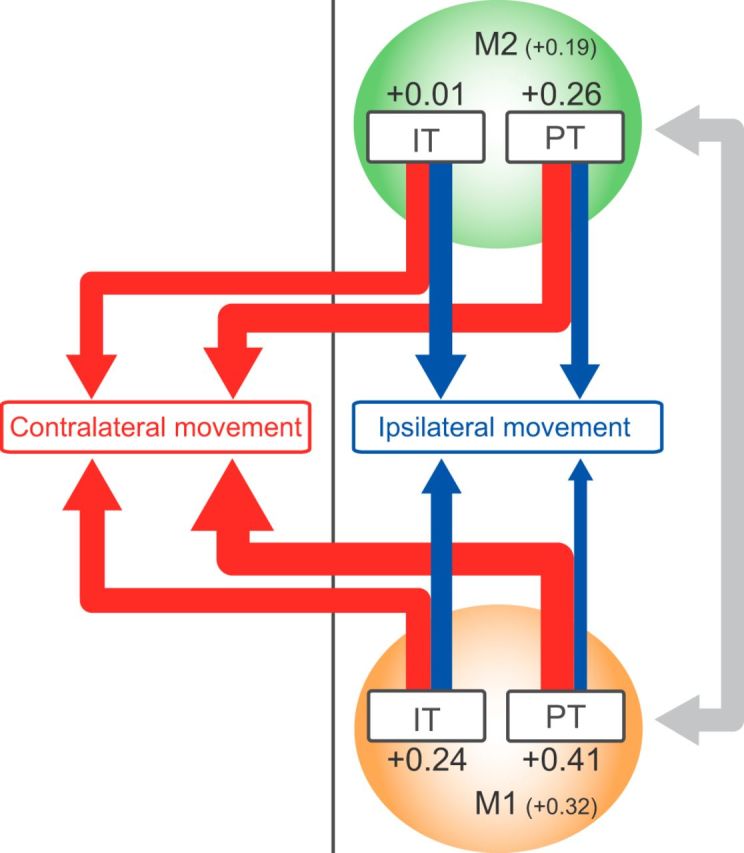
Two distinct motor areas, the primary and secondary motor cortices (M1 and M2), play crucial roles in voluntary movement in rodents. The aim of this study was to characterize the laterality in motor cortical representations of right and left forelimb movements. To achieve this goal, we developed a novel behavioral task, the Right-Left Pedal task, in which a head-restrained male rat manipulates a right or left pedal with the corresponding forelimb. This task enabled us to monitor independent movements of both forelimbs with high spatiotemporal resolution. We observed phasic movement-related neuronal activity (Go-type) and tonic hold-related activity (Hold-type) in isolated unilateral movements. In both M1 and M2, Go-type neurons exhibited bias toward contralateral preference, whereas Hold-type neurons exhibited no bias. The contralateral bias was weaker in M2 than M1. Moreover, we differentiated between intratelencephalic (IT) and pyramidal tract (PT) neurons using optogenetically evoked spike collision in rats expressing channelrhodopsin-2. Even in identified PT and IT neurons, Hold-type neurons exhibited no lateral bias. Go-type PT neurons exhibited bias toward contralateral preference, whereas IT neurons exhibited no bias. Our findings suggest a different laterality of movement representations of M1 and M2, in each of which IT neurons are involved in cooperation of bilateral movements, whereas PT neurons control contralateral movements.SIGNIFICANCE STATEMENT In rodents, the primary and secondary motor cortices (M1 and M2) are involved in voluntary movements via distinct projection neurons: intratelencephalic (IT) neurons and pyramidal tract (PT) neurons. However, it remains unclear whether the two motor cortices (M1 vs M2) and the two classes of projection neurons (IT vs PT) have different laterality of movement representations. We optogenetically identified these neurons and analyzed their functional activity using a novel behavioral task to monitor movements of the right and left forelimbs separately. We found that contralateral bias was reduced in M2 relative to M1, and in IT relative to PT neurons. Our findings suggest that the motor information processing that controls forelimb movement is coordinated by a distinct cell population.

Keywords: channelrhodopsin-2; collison test; contralateral/ipsilateral; cortical hierarchy; pyramidal cell; rat.


Figures

Figure 1.
Figure 1.
Behavioral task performance. A, Schematic diagram of the Right-Left Pedal task. The rats pushed down on both pedals for a short period (≥1 s) to initiate the trial, and then voluntarily chose either of the pedals to receive a reward (e.g., left release). This task consisted of two blocks (the right pedal- and left pedal-rewarded blocks), which were alternated after meeting the criteria (see Materials and Methods). Photographs show the right-left pedal device installed in a stereotaxic frame and a rat manipulating (pushing down) both pedals. B, Typical example of task performance and the rats' learning process. Top, Rat chose the correct pedal based on the reward. Large and small colored vertical bars (red represents right choice; blue represents left choice) indicate correct and incorrect trials, respectively. The choice rate of the right pedal (purple line) was calculated by averaging the number of right choices obtained from the past 10 trials. Bottom, On training day 14, the rats chose the rewarded pedal >75% (left), and choice bias disappeared throughout the training (right). Solid line indicates average. Dashed lines indicate individual rat. C, Right-left pedal trajectories and EMG activity in left forelimb. Top, Example pedal and EMG traces in three consecutive trials. Bottom, Averaged population EMG power (± SEM) aligned with the onset of pedal release (dashed line).
Figure 2.
Figure 2.
Recording and classification of RS and FS neurons in two motor cortices. A, Recording sites in the primary and secondary motor cortices [M1 (left) and M2 (right), respectively]. Tracks of electrode (arrowheads) for the M1 and M2 recordings in Nissl-stained sections (see Materials and Methods). B, Recorded neurons were divided into RS and FS neurons based on spike duration (RS: ≥0.6 ms, triangles; FS: <0.6 ms, circles). The spike duration was defined as the time from spike onset to the first positive peak. Top, Ongoing (all averaged) spike rate plotted against spike duration for individual neurons. Bottom, Bimodal distribution of spike durations. Insets, Normalized average spike waveforms with SD of RS and FS neurons, aligned by their troughs. Light and dark colors represent RS and FS neurons, respectively.
Figure 3.
Figure 3.
Different types of functional activity in the M1 and M2 neurons. A, Definition of task-related activity. The number of spikes during contralateral and ipsilateral movement trials was plotted against task relevance index for individual neurons (right scatter plot; see Materials and Methods). Black and gray dots indicate the task-related (blue line, p < 10−6; blue dashed line, ≥250 spikes) and non–task-related (discarded) neurons, respectively. Red numbers correspond to examples of activities (left panels). Top, Middle, and Bottom, Pedal trajectories, spike raster plots, and PETHs of preferred movement, respectively. Bin width, 20 ms. B, Categorization of Hold- and Pre-go-type activities by dependence on holding time. PETHs calculated from the different holding time trials (top). Intersection with criterion (red dashed line, 75% of activity in an averaged PETH) was plotted on the holding time, and the slope value of the regression was obtained (bottom). If a neuron had Hold-type-related activity, the slope value was negative (left column). By contrast, the slope value was ∼0 if neuronal activity was independent of holding time (right column). C, Distribution of slope in the motor cortices. Histograms of slopes exhibit a clear bimodality in both M1 and M2. D, Three types of task-related activity in RS and FS neurons in the motor cortices. Top, Each row shows normalized Gaussian-filtered PETH (σ = 12.5 ms, in 0.05 ms bins) for a single neuron (aligned with the onset of choice: vertical line at 0 s). The task-related neurons were sorted by the order of peak time (early to late). Hold-, Pre-go-, and Post-go-type activities are indicated on the right side. Bottom, Population ratios of different activity types for RS and FS neurons in the motor cortices. Black, gray, and white represent Hold-, Pre-go-, and Post-go-type activity, respectively. ***p < 0.001 (2 × 2 χ2 tests).
Figure 4.
Figure 4.
Selectivity of neuronal activity to contralateral and ipsilateral movements in the motor cortices. A–C, Examples of Post-go-, Pre-go-, and Hold-type functional activities in the M1 neurons in the contralateral (red) or ipsilateral trials (blue). Colored dots and lines indicate spike raster plots and normalized PETHs, respectively. D–F, Same as A–C for the M2 neurons. G–I, Population data of three types of functional activity in the M1 (top) and M2 (bottom). Left columns, Averaged PETHs of all Post-go-, Pre-go-, and Hold-type activities for the contralateral (red) and ipsilateral (blue) choice trials. Shaded regions represent 95% CIs. Right columns, Peak activity (G, H) and mean firing rate (I) of the contralateral (abscissa) and ipsilateral (ordinate) choice trials. Triangles and circles represent individual RS and FS neurons, respectively.
Figure 5.
Figure 5.
Laterality indices, peak-activity timing, and outcome modulation indices of Go-type activity in M1 and M2 neurons. A, B, Cumulative distributions of the laterality indices for RS (A) and FS (B) neurons in the M1 and M2. Positive and negative values indicate greater activity for contralateral and ipsilateral movements, respectively. M1 neurons preferentially represented the contralateral forelimb movements to a greater extent than M2 neurons (rightward shift). C, D, Cumulative distributions of the peak-activity timing for RS (C) and FS (D) neurons. E, F, Cumulative distributions of the outcome modulation indices for RS (E) and FS (F) neurons. Positive and negative values indicate greater activity for rewarded and nonrewarded trials, respectively (see Materials and Methods).
Figure 6.
Figure 6.
Identification of IT and PT neurons. A, Top, Schema showing the position of optical fibers for identifying the IT and PT neurons. The contralateral motor cortex (cM1 or cM2), and either ipsilateral ventral nuclei of thalamus (iTh) or pontine nuclei (iPn) were stimulated for identification of IT and PT neurons, respectively. Bottom, Stimulation site for identification of PT neuron. Track of an optical fiber (arrowhead) into the iPn in a Nissl-stained section. B, Examples of recordings from IT (top) and PT (bottom) neurons during optical stimulation (cyan area), with spike collisions. Black and red traces represent the antidromic spikes to optical stimulation and spike collision tests, respectively. Black arrowheads indicate antidromic spikes. Red arrowheads indicate the precedence of spontaneous spikes used as triggers for optical stimulation in collision tests. C, Reconstructed recording position of IT (purple) and PT (green) neurons in the motor cortices. The electrode insertion based on the antidromic identification of PT neurons enabled to specify putative layer 5 (see Materials and Methods). D, Distribution of spike latency after antidromic stimulation in IT (purple) and PT (green) neurons of M1 (left) and M2 (right).
Figure 7.
Figure 7.
Functional activity and motor laterality of IT and PT neurons. A, Functional activity (top) and fraction (bottom) of IT and PT neurons in M1 and M2. Legend is the same as Figure 3D. B, Proportion of neurons selective for contralateral, ipsilateral, or bilateral movement. Stacked bar graphs represent the ratios of selectivity in IT and PT neurons in the motor cortices. Each category is color-coded: red represents contralateral neurons; blue represents ipsilateral neurons; gray represents bilateral neurons. Insets, Same as B for unidentified RS neurons in the M1 and M2. C, Mean activity (for Hold-type; left column) and peak activity (for Go-type; right column) of the contralateral and ipsilateral movement trials in the IT (purple) and PT (green) neurons. D, Cumulative distributions of the laterality indices for IT and PT neurons in M1 (top) and M2 (bottom). Gray lines are the same as Figure 5A.
Figure 8.
Figure 8.
Schematic summary of laterality in motor representation in IT and PT neurons in M1 and M2. Red and blue arrows indicate neuronal activity for contralateral and ipsilateral movements, respectively. The relative strength is indicated by thickness of arrow. The number indicates averaged laterality index for each neuron type. The M1 and M2 neurons may cooperatively communicate with each other to control the movements (gray arrow).

Similar articles

Cited by

References

    1. Bruno RM, Simons DJ (2002) Feedforward mechanisms of excitatory and inhibitory cortical receptive fields. J Neurosci 22:10966–10975. - PMC - PubMed
    1. Carvell GE, Simons DJ (1990) Biometric analyses of vibrissal tactile discrimination in the rat. J Neurosci 10:2638–2648. - PMC - PubMed
    1. Catsman-Berrevoets CE, Lemon RN, Verburgh CA, Bentivoglio M, Kuypers HG (1980) Absence of callosal collaterals derived from rat corticospinal neurons. Exp Brain Res 39:433–440. - PubMed
    1. Chang SW, Snyder LH (2012) The representations of reach endpoints in posterior parietal cortex depend on which hand does the reaching. J Neurophysiol 107:2352–2365. 10.1152/jn.00852.2011 - DOI - PMC - PubMed
    1. Chang SW, Dickinson AR, Snyder LH (2008) Limb-specific representation for reaching in the posterior parietal cortex. J Neurosci 28:6128–6140. 10.1523/JNEUROSCI.1442-08.2008 - DOI - PMC - PubMed

Publication types

MeSH terms

LinkOut - more resources