

A conserved energetic footprint underpins recognition of human leukocyte antigen-E by two distinct αβ T cell receptors
- PMID: 28972140
- PMCID: PMC5743087
- DOI: 10.1074/jbc.M117.807719
A conserved energetic footprint underpins recognition of human leukocyte antigen-E by two distinct αβ T cell receptors
Abstract
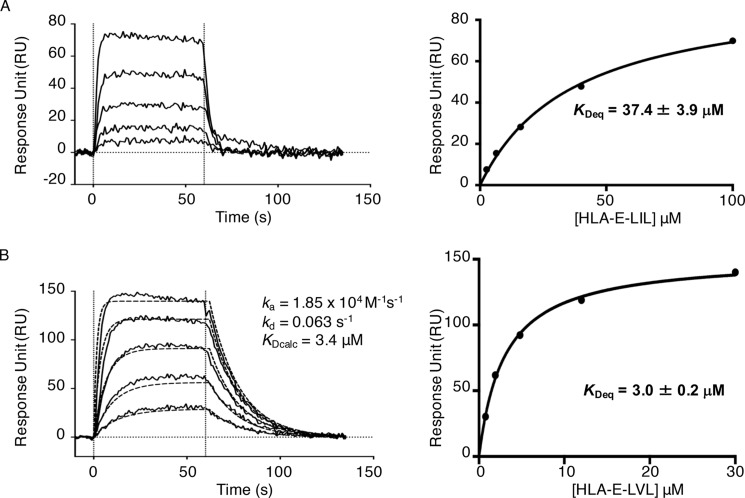
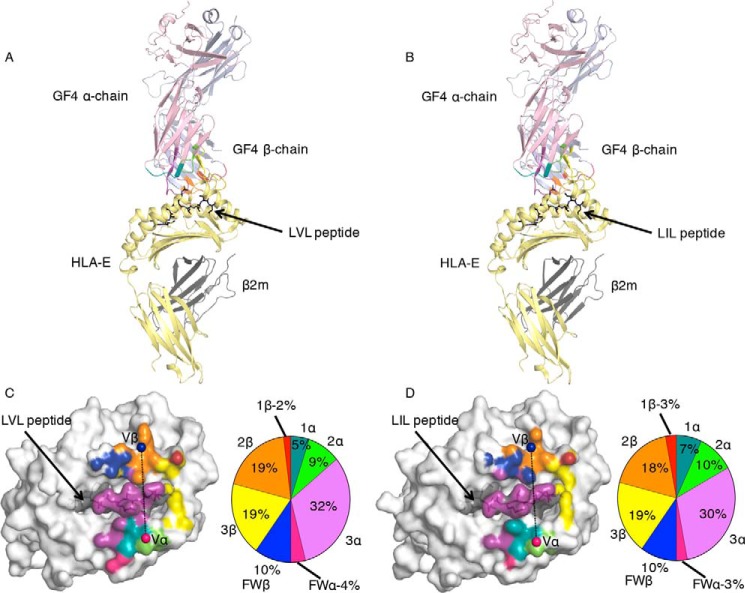
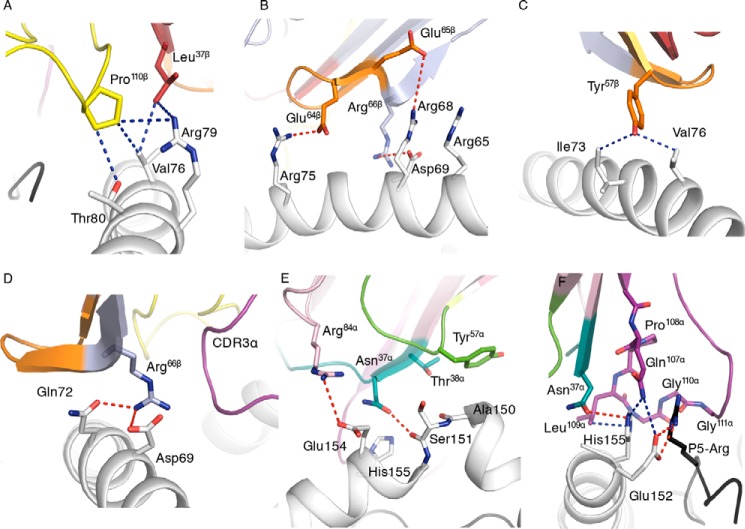
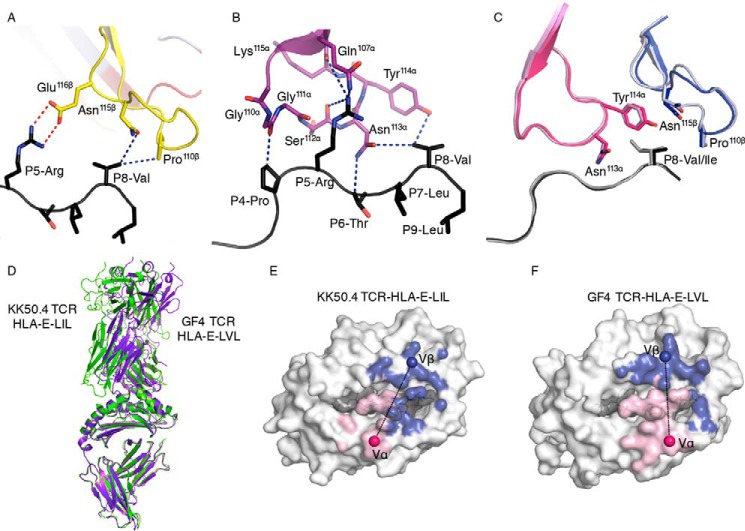
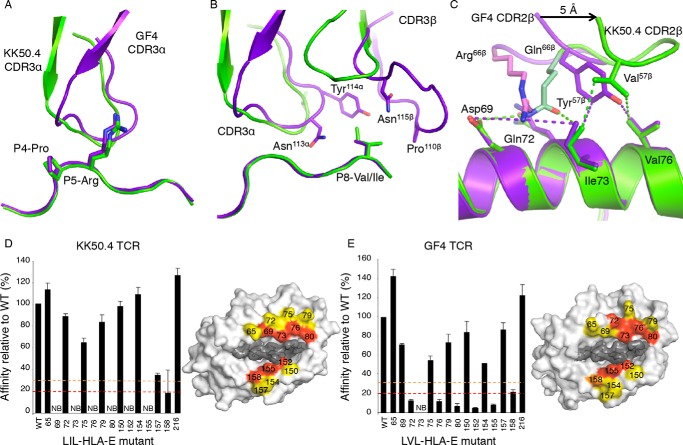
αβ T cell receptors (TCRs) interact with peptides bound to the polymorphic major histocompatibility complex class Ia (MHC-Ia) and class II (MHC-II) molecules as well as the essentially monomorphic MHC class Ib (MHC-Ib) molecules. Although there is a large amount of information on how TCRs engage with MHC-Ia and MHC-II, our understanding of TCR/MHC-Ib interactions is very limited. Infection with cytomegalovirus (CMV) can elicit a CD8+ T cell response restricted by the human MHC-Ib molecule human leukocyte antigen (HLA)-E and specific for an epitope from UL40 (VMAPRTLIL), which is characterized by biased TRBV14 gene usage. Here we describe an HLA-E-restricted CD8+ T cell able to recognize an allotypic variant of the UL40 peptide with a modification at position 8 (P8) of the peptide (VMAPRTLVL) that uses the TRBV9 gene segment. We report the structures of a TRBV9+ TCR in complex with the HLA-E molecule presenting the two peptides. Our data revealed that the TRBV9+ TCR adopts a different docking mode and molecular footprint atop HLA-E when compared with the TRBV14+ TCR-HLA-E ternary complex. Additionally, despite their differing V gene segment usage and different docking mechanisms, mutational analyses showed that the TCRs shared a conserved energetic footprint on the HLA-E molecule, focused around the peptide-binding groove. Hence, we provide new insights into how monomorphic MHC molecules interact with T cells.
Keywords: T-cell receptor (TCR); major histocompatibility complex (MHC); mutagenesis; receptor structure-function; structural biology; viral immunology.
© 2017 by The American Society for Biochemistry and Molecular Biology, Inc.
Conflict of interest statement
The authors declare that they have no conflicts of interest with the contents of this article.
Figures
Similar articles
-
Topology of T cell receptor-peptide/class I MHC interaction defined by charge reversal complementation and functional analysis.J Mol Biol. 1997 Aug 15;271(2):278-93. doi: 10.1006/jmbi.1997.1169. J Mol Biol. 1997. PMID: 9268659
-
TCR alpha genes direct MHC restriction in the potent human T cell response to a class I-bound viral epitope.J Immunol. 2006 Nov 15;177(10):6804-14. doi: 10.4049/jimmunol.177.10.6804. J Immunol. 2006. PMID: 17082594
-
Structural basis for clonal diversity of the human T-cell response to a dominant influenza virus epitope.J Biol Chem. 2017 Nov 10;292(45):18618-18627. doi: 10.1074/jbc.M117.810382. Epub 2017 Sep 20. J Biol Chem. 2017. PMID: 28931605 Free PMC article.
-
HLAs, TCRs, and KIRs, a Triumvirate of Human Cell-Mediated Immunity.Annu Rev Biochem. 2020 Jun 20;89:717-739. doi: 10.1146/annurev-biochem-011520-102754. Annu Rev Biochem. 2020. PMID: 32569519 Review.
-
A structural voyage toward an understanding of the MHC-I-restricted immune response: lessons learned and much to be learned.Immunol Rev. 2012 Nov;250(1):61-81. doi: 10.1111/j.1600-065X.2012.01159.x. Immunol Rev. 2012. PMID: 23046123 Review.
Cited by
-
Evolution and molecular interactions of major histocompatibility complex (MHC)-G, -E and -F genes.Cell Mol Life Sci. 2022 Aug 4;79(8):464. doi: 10.1007/s00018-022-04491-z. Cell Mol Life Sci. 2022. PMID: 35925520 Free PMC article. Review.
-
High-throughput characterization of HLA-E-presented CD94/NKG2x ligands reveals peptides which modulate NK cell activation.Nat Commun. 2023 Aug 9;14(1):4809. doi: 10.1038/s41467-023-40220-1. Nat Commun. 2023. PMID: 37558657 Free PMC article.
-
Mobilizing unconventional T cells.Science. 2019 Oct 18;366(6463):302-303. doi: 10.1126/science.aay7079. Science. 2019. PMID: 31624196 Free PMC article. No abstract available.
-
Integrating Experiment and Theory to Understand TCR-pMHC Dynamics.Front Immunol. 2018 Dec 7;9:2898. doi: 10.3389/fimmu.2018.02898. eCollection 2018. Front Immunol. 2018. PMID: 30581442 Free PMC article. Review.
-
Structure-guided stabilization of pathogen-derived peptide-HLA-E complexes using non-natural amino acids conserves native TCR recognition.Eur J Immunol. 2022 Apr;52(4):618-632. doi: 10.1002/eji.202149745. Epub 2022 Feb 13. Eur J Immunol. 2022. PMID: 35108401 Free PMC article.
References
-
- Davis M. M., and Bjorkman P. J. (1988) T-cell antigen receptor genes and T-cell recognition. Nature 334, 395–402 - PubMed
-
- Sullivan L. C., Hoare H. L., McCluskey J., Rossjohn J., and Brooks A. G. (2006) A structural perspective on MHC class Ib molecules in adaptive immunity. Trends Immunol. 27, 413–420 - PubMed
-
- Rossjohn J., Gras S., Miles J. J., Turner S. J., Godfrey D. I., and McCluskey J. (2015) T cell antigen receptor recognition of antigen-presenting molecules. Annu. Rev. Immunol. 33, 169–200 - PubMed
-
- Grimsley C., Kawasaki A., Gassner C., Sageshima N., Nose Y., Hatake K., Geraghty D. E., and Ishitani A. (2002) Definitive high resolution typing of HLA-E allelic polymorphisms: identifying potential errors in existing allele data. Tissue Antigens 60, 206–212 - PubMed
-
- Lo W. F., Ong H., Metcalf E. S., and Soloski M. J. (1999) T cell responses to Gram-negative intracellular bacterial pathogens: a role for CD8+ T cells in immunity to Salmonella infection and the involvement of MHC class Ib molecules. J. Immunol. 162, 5398–5406 - PubMed
Publication types
MeSH terms
Substances
Associated data
- Actions
- Actions
LinkOut - more resources
Full Text Sources
Other Literature Sources
Research Materials
