. 2017 Nov 17;292(46):18832-18847.
doi: 10.1074/jbc.M117.807974. Epub 2017 Oct 2.

Structural analyses of the MazEF4 toxin-antitoxin pair in Mycobacterium tuberculosis provide evidence for a unique extracellular death factor

Affiliations

Structural analyses of the MazEF4 toxin-antitoxin pair in Mycobacterium tuberculosis provide evidence for a unique extracellular death factor

Do-Hwan Ahn et al. J Biol Chem. .

Abstract

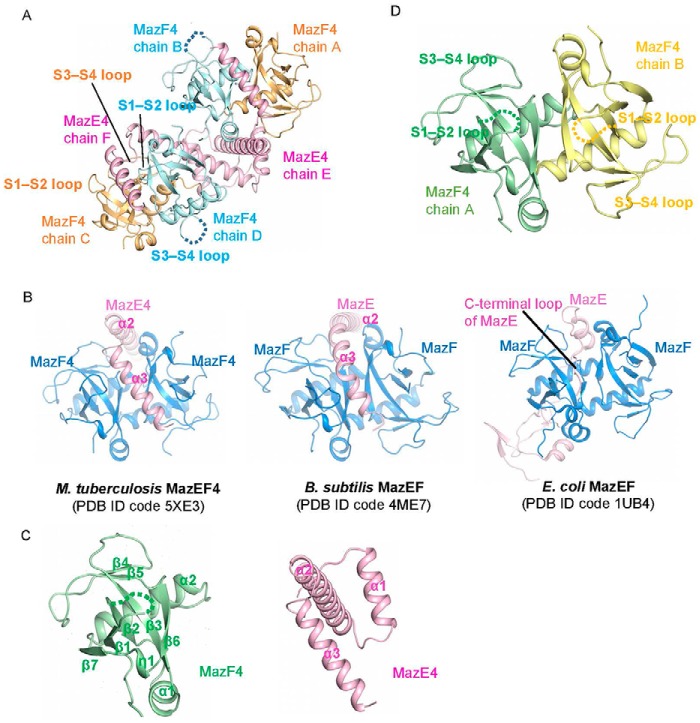
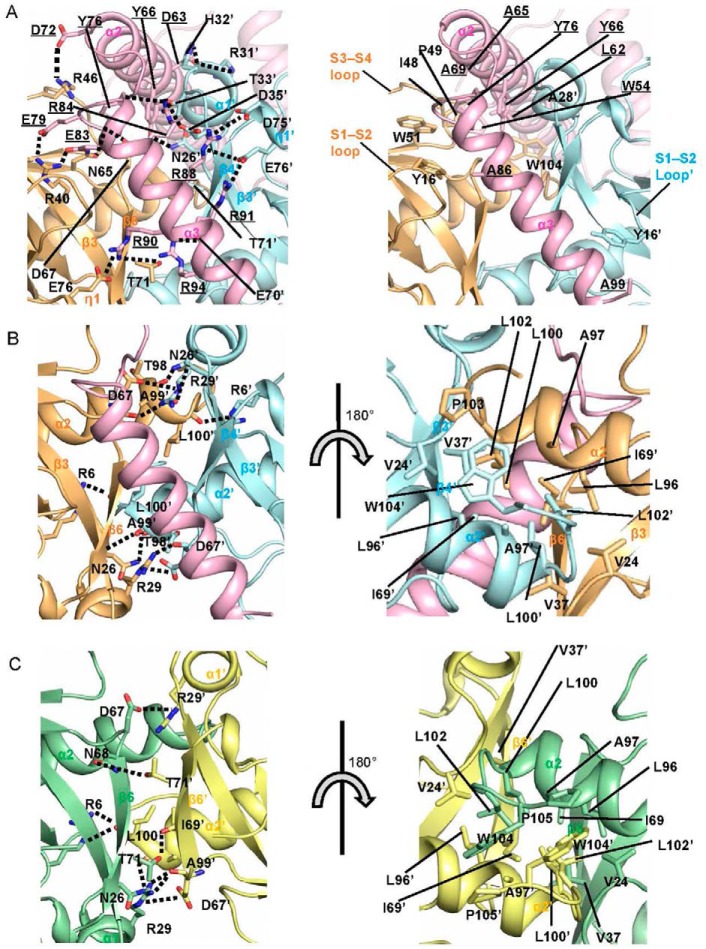
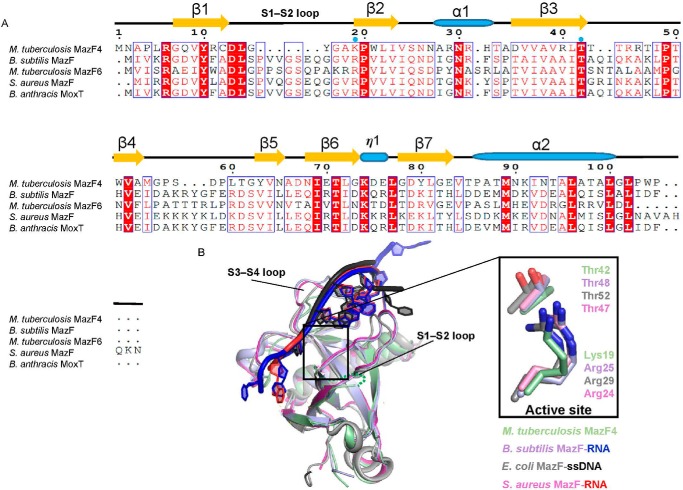
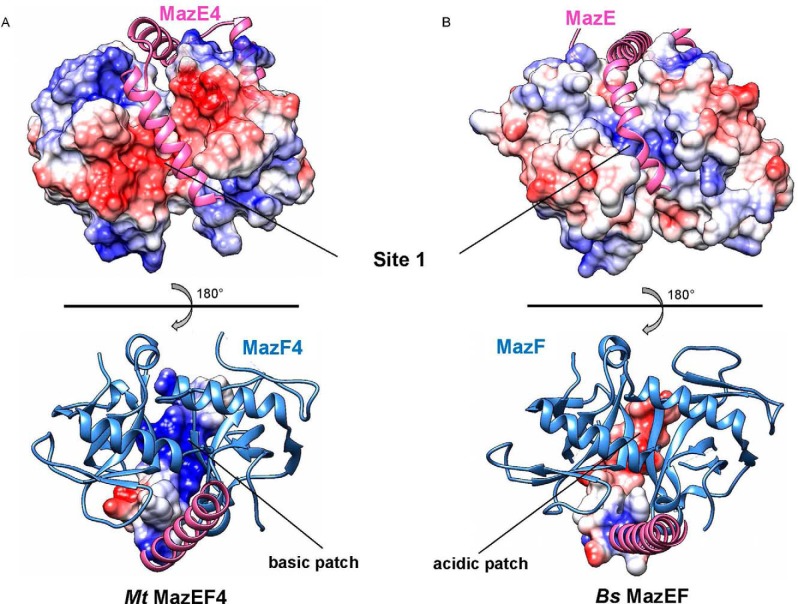
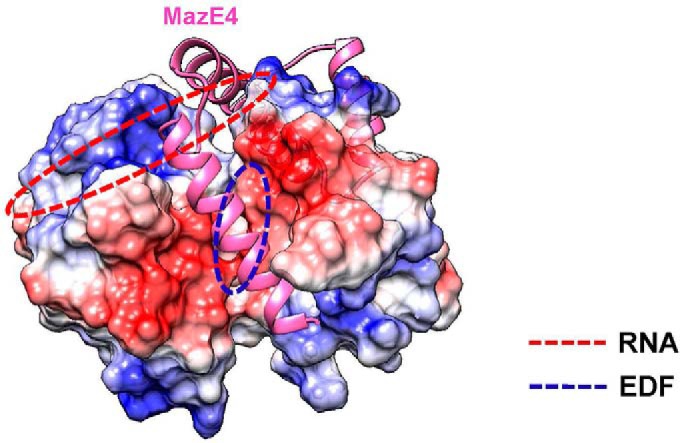
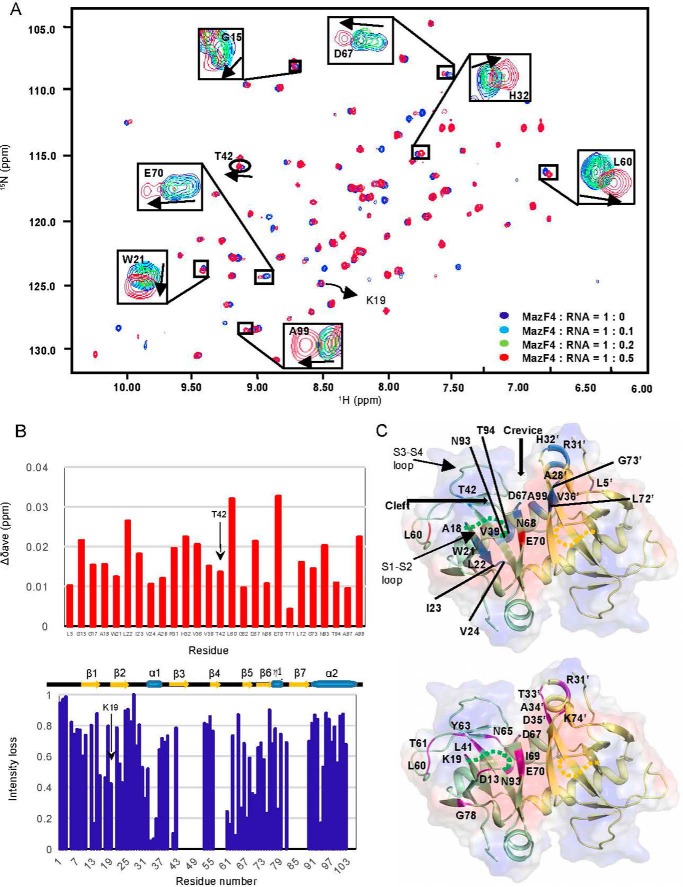
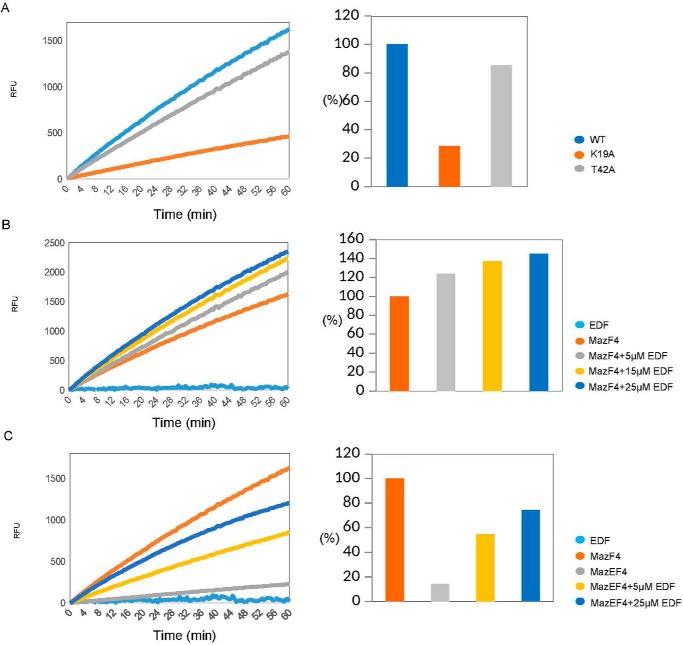
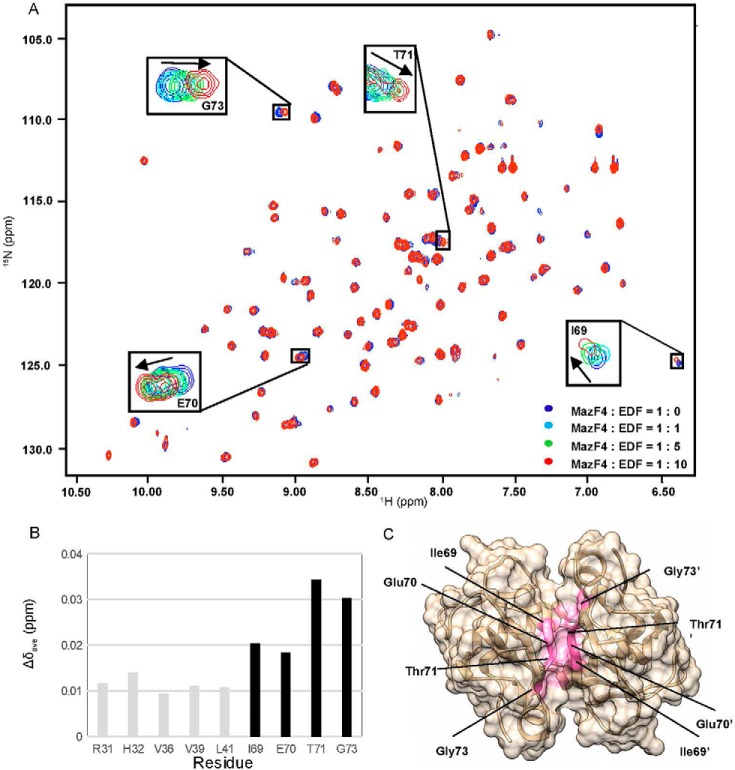
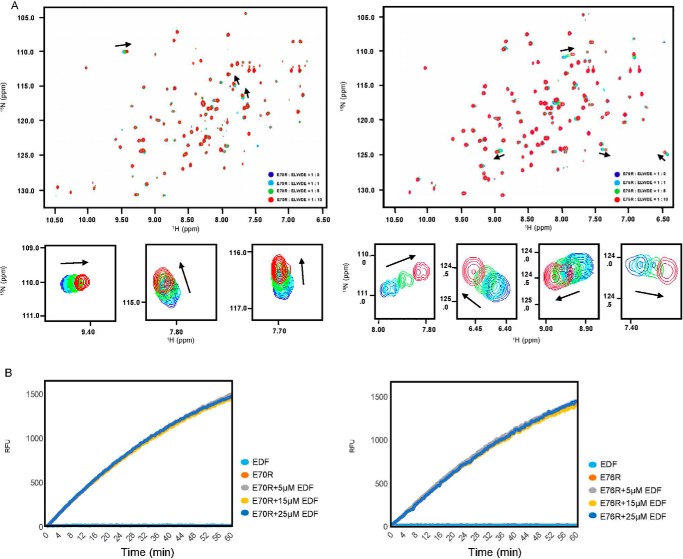
The bacterial toxin-antitoxin MazEF system in the tuberculosis (TB)-causing bacterium Mycobacterium tuberculosis is activated under unfavorable conditions, including starvation, antibiotic exposure, and oxidative stress. This system contains the ribonucleolytic enzyme MazF and has emerged as a promising drug target for TB treatments targeting the latent stage of M. tuberculosis infection and reportedly mediates a cell death process via a peptide called extracellular death factor (EDF). Although it is well established that the increase in EDF-mediated toxicity of MazF drives a cell-killing phenomenon, the molecular details are poorly understood. Moreover, the divergence in sequences among reported EDFs suggests that each bacterial species has a unique EDF. To address these open questions, we report here the structures of MazF4 and MazEF4 complexes from M. tuberculosis, representing the first MazEF structures from this organism. We found that MazF4 possesses a negatively charged MazE4-binding pocket in contrast to the positively charged MazE-binding pockets in homologous MazEF complex structures from other bacteria. Moreover, using NMR spectroscopy and biochemical assays, we unraveled the molecular interactions of MazF4 with its RNA substrate and with a new EDF homolog originating from M. tuberculosis The EDF homolog discovered here possesses a positively charged residue at the C terminus, making this EDF distinct from previously reported EDFs. Overall, our results suggest that M. tuberculosis evolved a unique MazF and EDF and that the distinctive EDF sequence could serve as a starting point for designing new anti-tuberculosis drugs. We therefore conclude that this study might contribute to the development of a new line of anti-tuberculosis agents.

Keywords: MazEF system; Mycobacterium tuberculosis; X-ray crystallography; extracellular death factor; nuclear magnetic resonance (NMR); protein structure; quorum sensing; toxin-antitoxin system.


Conflict of interest statement

The authors declare that they have no conflicts of interest with the contents of this article

Figures

Figure 1.
Figure 1.
Overall structure of M. tuberculosis MazF4 and MazF4 in complex with MazE4. A, the structure of the M. tuberculosis MazEF4 heterohexamer. The models of the MazF4 toxin are shown as pale orange (chains A and C) and pale cyan (chains B and D), respectively. The models of the MazE4 antitoxin are shown as light pink. The disordered regions (Thr44 to Arg47) of the loop connecting β3 and β4 are depicted as dotted lines. B, structural comparison of the M. tuberculosis MazEF4 heterohexamer with other MazEF complexes (B. subtilis MazEF (PDB code 4ME7); E. coli MazEF (PDB code 1UB4)). The models of the MazF toxin and MazE antitoxin are colored blue and pale pink, respectively. C, schematic presentation of the M. tuberculosis MazF4 monomer (pale green) and M. tuberculosis MazE4 monomer (light pink) in the MazEF4 complex. The α-helices, β-strands, and a 310 helix of the MazF4-fold are labeled α1 to α2, β1 to β7, and η1, respectively. The disordered regions of the loops are depicted as dotted lines. The α-helices of the MazE4-fold are labeled α1 to α3. D, the structure of the M. tuberculosis MazF4 homodimer. The models of the MazF4 toxin are shown as pale green (chain A) and pale yellow (chain B). The disordered regions (Gly15 to Gly17) of the loop connecting β1 and β2 are depicted as dotted lines.
Figure 2.
Figure 2.
Detailed structure of the interfaces in the MazF4 homodimer and MazEF4 heterohexamer. A, interactions between the MazF4 dimer and MazE4 in the MazEF4 complex (left, hydrophilic interaction; right, hydrophobic interaction). The residues involved in the hydrophilic interaction are shown as a stick representation. Hydrogen bonds and salt bridges are shown as black dotted lines. See also supplemental Fig. S1. B, interactions between two MazF4 monomers constituting the MazEF4 complex (left, hydrophilic interaction; right, hydrophobic interaction). C, interactions involved in M. tuberculosis MazF4 homodimer formation (left, hydrophilic interaction; right, hydrophobic interaction).
Figure 3.
Figure 3.
Sequence alignment and structural comparison of the MazF homologs. A, sequence alignment of M. tuberculosis MazF4, B. subtilis MazF, M. tuberculosis MazF6, S. aureus MazF, and B. anthracis MoxT. Highly conserved residues are indicated by boxes, and strictly conserved residues are highlighted using a red background in the boxes. The putative catalytic residues discussed in the text are marked with light blue dots. The secondary structural elements of M. tuberculosis MazF4 are presented above the sequence, where the helices and strands are indicated by cylinders and arrows, respectively. B, superposition of M. tuberculosis MazF4 (PDB code 5XE2; pale green), B. subtilis MazF-RNA (PDB code 4MDX; light purple), E. coli MazF-ssDNA (PDB code 5CR2; gray), and S. aureus MazF-RNA (PDB code 5DLO; pink). Residues involved in RNA recognition are drawn as sticks, and RNA molecules are similarly colored, but in a darker tone, to their corresponding proteins. The close-up view of the overlaid active sites is boxed.
Figure 4.
Figure 4.
The comparison of electrostatic surface potential with a homolog. A, upper, the electrostatic surface potential of the M. tuberculosis MazF4 dimer constituting the MazEF4 complex with ribbon representation of MazE4 (magenta). Lower, the electrostatic surface potential of M. tuberculosis MazE4 C terminus constituting MazEF4 complex with ribbon representations of MazE4 (magenta) and MazF4 dimer (cornflower blue). B, upper, the electrostatic surface potential of the B. subtilis MazF dimer constituting the MazEF complex with ribbon representation of MazE4 (magenta). Lower, the electrostatic surface potential of B. subtilis MazE C terminus constituting the MazEF complex with ribbon representations of MazE (magenta) and MazF dimers (cornflower blue) (PDB code 4ME7). The charged MazE-binding pockets (Site 1) and charged MazF-binding patches are marked.
Figure 5.
Figure 5.
The relative location of RNA substrate, EDF, and MazE4-binding area presented on the MazF4 surface. Electrostatic surface of the MazF4 with the MazE4 C-terminal α helix (magenta), the RNA-binding pocket (red dotted circle), and EDF-binding pocket (blue dotted circle) marked. The RNA-binding pocket is positively charged in contrast to the negatively charged EDF-binding pocket.
Figure 6.
Figure 6.
M. tuberculosis MazF4 residues involved in RNA recognition. A, overlaid [1H,15N]-HSQC titration spectra of 0.1 mm 15N-labeled MazF4 titrated with uncleavable RNA. Examples of peaks that exhibit large chemical shift changes following RNA titration are boxed and enlarged. The peak corresponding to Thr42 is circled. The arrows in the diagram indicate the direction of the chemical shift. Lys19 is indicated by an arrow. B, examples of peaks that exhibit chemical shift changes and intensity losses following RNA titration. Chemical shift changes of residues in MazF4 produced by RNA binding are plotted. Thr42 is indicated by an arrow. B, upper, the ratio of the cross-peak intensities of residues in MazF4 produced by RNA binding is plotted against the residue number. Lys19 is indicated by an arrow. B, lower, the ratio of the peak intensities was normalized to the ratio of the peak intensity of Asn27. The secondary structural elements of MazF4 are shown above the plot, where the helices and strands are indicated by cylinders and arrows, respectively. C, the chemical shift changes and reductions in the signal intensities produced by RNA titration were mapped onto the crystal structure of the MazF4 homodimer. The residues that showed the largest chemical shift changes are indicated in red, and the residues that showed moderate chemical shift changes are indicated in sky blue (C, upper). The residues that showed reductions in their signal intensities are indicated in purple (C, lower). Only one set of affected residues is colored for clarity.
Figure 7.
Figure 7.
The in vitro ribonuclease assay of M. tuberculosis MazF4. In vitro ribonuclease assays were performed as described under “Experimental procedures.” Different amounts of the EDF homolog (0–25 μm) were added to the reactions. Fluorometric assays were performed in triplicate. A, ribonuclease activities of 1 μm wild-type M. tuberculosis MazF4 and its mutants assessed by fluorometric assay. B, effects of the EDF homolog on the ribonuclease activities of 1 μm M. tuberculosis MazF4 evaluated by fluorometric assay. C, effects of the EDF homolog on the ribonuclease activities of the M. tuberculosis MazEF4 complex (0.5 μm MazE4 and 1 μm MazF4) evaluated by fluorometric assay. Reactions were recorded every 30 s for 60 min in all fluorometric assays. The slope between the 10th and 110th readings of each reaction was calculated and is shown on the right panels in A–C. We assigned the value of 100% to the MazF4 activity without EDF. Data shown are the mean of three independent experiments.
Figure 8.
Figure 8.
M. tuberculosis MazF4 residues involved in the interaction with the EDF homolog derived from M. tuberculosis G6PD 1. A, overlaid [1H,15N]-HSQC titration spectra of 0.1 mm 15N-labeled MazF4 titrated with different ratios of the EDF homolog. Examples of peaks that exhibit chemical shift changes following EDF homolog titration are boxed and enlarged. The arrows in the diagram indicate the direction of the chemical shift. B, examples of peaks that exhibit chemical shift changes following EDF homolog titration. Chemical shift changes of residues that showed relatively large chemical shift changes in MazF4 produced by EDF homolog binding are plotted. The residues that showed significant chemical shift changes are indicated in black, and the residues that showed slight chemical shift changes are indicated in gray. C, the chemical shift changes produced by EDF homolog titration were mapped onto the crystal structure of the MazF4 homodimer. The residues showing significant chemical shift changes are indicated in pink.
Figure 9.
Figure 9.
The interaction between Glu to Arg mutants of M. tuberculosis MazF4 (E70R and E76R) and the Arg to Glu swap peptide (ELWDE). A, overlaid [1H,15N]-HSQC titration spectra of 0.1 mm 15N-labeled MazF4 E70R titrated with different ratios of the Arg to Glu swap peptide (ELWDE) (A, upper left). Examples of E70R peaks that exhibited chemical shift changes following ELWDE titration are shown. The arrows in the diagram indicate the direction of the chemical shift (A, lower left). Overlaid [1H,15N]-HSQC titration spectra of 0.1 mm 15N-labeled MazF4 E76R titrated with different ratios of the Arg to Glu swap peptide (ELWDE) (A, upper right) are shown. Examples of E76R peaks that exhibited chemical shift changes following ELWDE titration are shown. The arrows in the diagram indicate the direction of the chemical shift (A, lower right). B, effects of the EDF homolog on the ribonuclease activities of 1 μm M. tuberculosis MazF4 E70R (B, left) and E76R (B, right) mutants evaluated by fluorometric assay. Reactions were recorded every 30 s for 60 min in all fluorometric assays.

Similar articles

Cited by

References

    1. Lönnroth K., and Raviglione M. (2008) Global epidemiology of tuberculosis: prospects for control. Semin. Respir. Crit. Care Med. 29, 481–491 - PubMed
    1. WHO. (2016) Global Tuberculosis Report 2016. World Health Organization, Geneva, Switzerland
    1. Gengenbacher M., and Kaufmann S. H. (2012) Mycobacterium tuberculosis: success through dormancy. FEMS Microbiol. Rev. 36, 514–532 - PMC - PubMed
    1. Schluger N. W. (2013) Advances in the diagnosis of latent tuberculosis infection. Semin. Respir. Crit. Care Med. 34, 60–66 - PubMed
    1. Hayes F., and Van Melderen L. (2011) Toxins-antitoxins: diversity, evolution and function. Crit. Rev. Biochem. Mol. Biol. 46, 386–408 - PubMed

Publication types

MeSH terms

LinkOut - more resources