. 2017 Nov 17;292(46):18916-18923.
doi: 10.1074/jbc.M117.810374. Epub 2017 Sep 29.

Mutant cycle analysis identifies a ligand interaction site in an odorant receptor of the malaria vector Anopheles gambiae

Affiliations

Mutant cycle analysis identifies a ligand interaction site in an odorant receptor of the malaria vector Anopheles gambiae

Suhaila Rahman et al. J Biol Chem. .

Abstract

Lack of information about the structure of insect odorant receptors (ORs) hinders the development of more effective repellants to control disease-transmitting insects. Mutagenesis and functional analyses using agonists to map the odorant-binding sites of these receptors have been limited because mutations distant from an agonist-binding site can alter agonist sensitivity. Here we use mutant cycle analysis, an approach for exploring the energetics of protein-protein or protein-ligand interactions, with inhibitors, to identify a component of the odorant-binding site of an OR from the malaria vector, Anopheles gambiae The closely related odorant-specificity subunits Agam/Or15 and Agam/Or13 were each co-expressed with Agam/Orco (odorant receptor co-receptor subunit) in Xenopus oocytes and assayed by two-electrode voltage clamp electrophysiology. We identified (-)-fenchone as a competitive inhibitor with different potencies at the two receptors and used this difference to screen a panel of 37 Agam/Or15 mutants, surveying all positions that differ between Agam/Or15 and Agam/Or13 in the transmembrane and extracellular regions, identifying position 195 as a determinant of (-)-fenchone sensitivity. Inhibition by (-)-fenchone and six structurally related inhibitors of Agam/Or15 receptors containing each of four different hydrophobic residues at position 195 served as input data for mutant cycle analysis. Several mutant cycles, calculated from the inhibition of two receptors by each of two ligands, yielded coupling energies of ≥1 kcal/mol, indicating a close, physical interaction between the ligand and residue 195 of Agam/Or15. This approach should be useful in further expanding our knowledge of odorant-binding site structures in ORs of disease vector insects.

Keywords: Xenopus; electrophysiology; insect; olfaction; oocyte; receptor; structure.


Conflict of interest statement

The authors declare that they have no conflicts of interest with the contents of this article

Figures

Figure 1.
Figure 1.
Identification of inhibitors of Agam/Or13 and Agam/Or15. A, left trace, current recording from an oocyte expressing Agam/Or15 + Agam/Orco. A 30-s application of 30 μm ACE was followed by a 10-min wash period. A 90-s application of 1 mm FEN was then immediately followed by a 30-s co-application of 1 mm FEN and 30 μm ACE. Right trace, current recording from an oocyte expressing Agam/Or15 + Agam/Orco. A 30-s application of 30 μm ACE was followed by a 10-min wash period. A 90-s application of 0.1% DMSO (Sham) was then immediately followed by a 30-s co-application of 0.1% DMSO and 30 μm ACE. B, current responses of oocytes expressing Agam/Or13 + Agam/Orco to 10 μm ACE (black symbols) or Agam/Or15 + Agam/Orco to 30 μm ACE (white symbols) in the presence of 1 mm of each inhibitor candidate are presented as percentages of the preceding response to ACE alone and normalized to the effect of sham applications (mean ± S.D. are shown, n = 3–8; see “Experimental procedures”). Structures and CID numbers for these compounds may be found in supplemental Table S1. Comparison of the effect of each compound on the ACE responses of the Agam/Or13 and Agam/Or15 receptors was done using an unpaired t test. *, p < 0.05; ***, p < 0.001; NS, not significant. C, concentration–inhibition analysis shows that FEN inhibition of 10 μm ACE activation of Agam/Or13 + Agam/Orco (IC50 = 240 ± 29 μm) and 30 μm ACE activation of Agam/Or15 + Agam/Orco (IC50 = 1200 ± 53 μm) differ (p < 0.0001, F-test, n = 4–8). D, concentration-response analysis of ACE activation of Agam/Or15 + Agam/Orco in the absence (filled circles) and presence (open circles) of 3 mm FEN. Responses were normalized to the response of the same oocyte to 10 μm ACE (means ± S.E., n = 10). The apparent EC50 values for ACE activation in the absence and presence of FEN (21 ± 4 and 77 ± 15 μm, respectively) were different (p < 0.0001, F-test, n = 10). The maximal responses did not differ (p = 0.51, F-test). E, concentration–inhibition analysis shows that FEN inhibition of 1 μm ACE activation of Agam/Or15 + Agam/Orco (IC50 = 54 ± 6 μm) and 30 μm ACE activation of Agam/Or15 + Agam/Orco (IC50 = 1200 ± 53 μm) differ (p < 0.0001, F-test, n = 4–9).
Figure 2.
Figure 2.
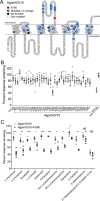
Mutation at position 195 alters inhibitor sensitivity of the Agam/Or15 receptor. A, positions of mutated residues within a predicted secondary structure of Agam/Or15. Residue locations that differ between Agam/Or15 and Agam/Or13 in predicted extracellular regions and transmembrane domains are colored: blue indicates mutations that did not significantly alter sensitivity to FEN; red indicates a mutation (A195I) that significantly altered sensitivity to FEN; and black indicates mutant receptors that were nonfunctional (L81W and T206I). The image was constructed as previously described (30), based on TMD locations estimated using TMRPres2D (48). B, WT Agam/Or15, Agam/Or15 mutants, WT Agam/Or13, and Agam/Or13-I195A, each co-expressed with Agam/Orco, were screened for sensitivity to antagonism by 300 μm FEN. WT Agam/Or15 and Agam/Or15 mutants were activated with 30 μm ACE, WT Agam/Or13, and Agam/Or13-I195A were activated with 10 μm ACE. ACE responses in the presence of 300 μm FEN are presented as percentages of the preceding response to ACE alone and normalized to the effect of sham applications run in parallel (mean ± S.D., n = 4–8; see “Experimental procedures”). Comparison of the values for Agam/Or15 mutants to the values for WT Agam/Or15 was done by one-way analysis of variance and Dunnett's post-test. Only Agam/Or15-A195I differed from Agam/Or15 (p < 0.001). The values for Agam/Or13-I195A differed from those of WT Agam/Or13 (unpaired t test, p < 0.001). C, WT Agam/Or15 (white symbols) and Agam/Or15-A195I (black symbols), each co-expressed with Agam/Orco were screened for sensitivity to antagonism by a series of cyclic compounds (300 μm). WT Agam/Or15 and Agam/Or15-A195I receptors were activated with 30 μm ACE. ACE responses in the presence of 300 μm of each compound are presented as a percentages of the preceding response to ACE alone and normalized to the effect of sham applications run in parallel (mean ± S.D. are shown, n = 3–7; see “Experimental procedures”). Comparison of the effect of each compound on the ACE responses of the WT Agam/Or15 and Agam/Or15-A195I receptors was done using an unpaired t test. *, p < 0.05; **, p < 0.01; ***, p < 0.001; NS, not significant. The data for FEN is from B.
Figure 3.
Figure 3.
Example mutant cycles. A–C, concentration–inhibition analysis of the inhibition of WT Agam/Or15 (Ala, black), Agam/Or15-A195I (Ile, red), Agam/Or15-A195L (Leu, blue), and Agam/Or15-A195V (Val, green) receptors by FEN (A), NOR (B), and DEB (C). IC50 values may be found in Table 1. The data are presented as means ± S.E. (n = 3–8). D, schematic representation of the 18 mutant cycles that can be derived from the IC50 values obtained in A. Each cycle is represented by a rectangle with the contributing ligand–residue pairs at the vertices. Ω values for each cycle are displayed in the same color as the cycle.
Figure 4.
Figure 4.
Mutant cycle analysis locates residue 195 at the ligand-binding site of Agam/Or15. Shown is a heat map representation of the Ω values from the 126 mutant cycles derived from inhibition of four versions of Agam/Or15 with Ala (WT), Ile, Leu, or Val at position 195 by seven cyclic inhibitors: FEN, NOR, DEB, CAM, ADM, CIN, and EUC. The Ω values were calculated as described under “Experimental procedures.” A continuous scale from white to black represents Ω values ranging from 1 to 8. The Ω value corresponding to a coupling, or interaction energy (ΔΔG) of 1 is indicated.

Similar articles

Cited by

References

    1. Guidobaldi F., May-Concha I. J., and Guerenstein P. G. (2014) Morphology and physiology of the olfactory system of blood-feeding insects. J. Physiol. Paris 108, 96–111 - PubMed
    1. Gibson G., and Torr S. J. (1999) Visual and olfactory responses of haematophagous Diptera to host stimuli. Med. Vet. Entomol. 13, 2–23 - PubMed
    1. Zwiebel L. J., and Takken W. (2004) Olfactory regulation of mosquito-host interactions. Insect Biochem. Mol. Biol. 34, 645–652 - PMC - PubMed
    1. Carey A. F., Wang G., Su C. Y., Zwiebel L. J., and Carlson J. R. (2010) Odorant reception in the malaria mosquito Anopheles gambiae. Nature 464, 66–71 - PMC - PubMed
    1. Erdelyan C. N., Mahood T. H., Bader T. S., and Whyard S. (2012) Functional validation of the carbon dioxide receptor genes in Aedes aegypti mosquitoes using RNA interference. Insect Mol. Biol. 21, 119–127 - PubMed

Publication types

MeSH terms

LinkOut - more resources