

Preferential association with ClC-3 permits sorting of ClC-4 into endosomal compartments
- PMID: 28972156
- PMCID: PMC5704486
- DOI: 10.1074/jbc.M117.801951
Preferential association with ClC-3 permits sorting of ClC-4 into endosomal compartments
Abstract
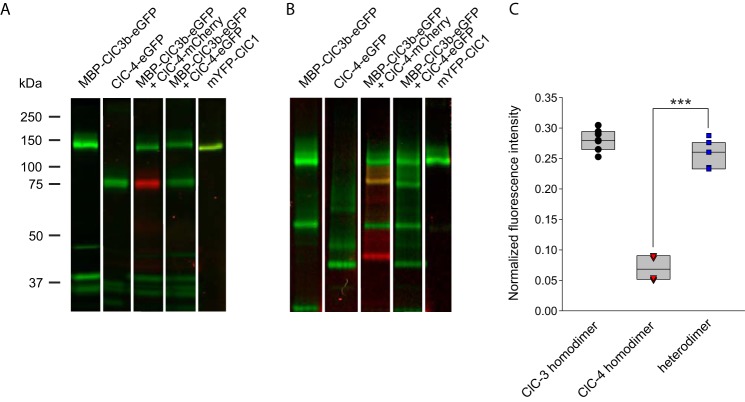
ClC-4 is an intracellular Cl-/H+ exchanger that is highly expressed in the brain and whose dysfunction has been linked to intellectual disability and epilepsy. Here we studied the subcellular localization of human ClC-4 in heterologous expression systems. ClC-4 is retained in the endoplasmic reticulum (ER) upon overexpression in HEK293T cells. Co-expression with distinct ClC-3 splice variants targets ClC-4 to late endosome/lysosomes (ClC-3a and ClC-3b) or recycling endosome (ClC-3c). When expressed in cultured astrocytes, ClC-4 sorted to endocytic compartments in WT cells but was retained in the ER in Clcn3-/- cells. To understand the virtual absence of ER-localized ClC-4 in WT astrocytes, we performed association studies by high-resolution clear native gel electrophoresis. Although other CLC channels and transporters form stable dimers, ClC-4 was mostly observed as monomer, with ClC-3-ClC-4 heterodimers being more stable than ClC-4 homodimers. We conclude that unique oligomerization properties of ClC-4 permit regulated targeting of ClC-4 to various endosomal compartment systems via expression of different ClC-3 splice variants.
Keywords: ClC-3; ClC-4; chloride transport; chloride/proton exchanger; intracellular compartments; protein sorting; protein–protein interaction; sorting signals; trafficking; transporter.
© 2017 by The American Society for Biochemistry and Molecular Biology, Inc.
Conflict of interest statement
The authors declare that they have no conflicts of interest with the contents of this article.
Figures


Similar articles
-
Neurodegeneration Upon Dysfunction of Endosomal/Lysosomal CLC Chloride Transporters.Front Cell Dev Biol. 2021 Feb 23;9:639231. doi: 10.3389/fcell.2021.639231. eCollection 2021. Front Cell Dev Biol. 2021. PMID: 33708769 Free PMC article. Review.
-
Sorting motifs of the endosomal/lysosomal CLC chloride transporters.J Biol Chem. 2010 Nov 5;285(45):34537-48. doi: 10.1074/jbc.M110.162545. Epub 2010 Sep 3. J Biol Chem. 2010. PMID: 20817731 Free PMC article.
-
Neuronal ClC-3 Splice Variants Differ in Subcellular Localizations, but Mediate Identical Transport Functions.J Biol Chem. 2015 Oct 23;290(43):25851-62. doi: 10.1074/jbc.M115.668186. Epub 2015 Sep 4. J Biol Chem. 2015. PMID: 26342074 Free PMC article.
-
Cl- and H+ coupling properties and subcellular localizations of wildtype and disease-associated variants of the voltage-gated Cl-/H+ exchanger ClC-5.J Biol Chem. 2020 Feb 7;295(6):1464-1473. doi: 10.1074/jbc.RA119.011366. Epub 2019 Dec 18. J Biol Chem. 2020. PMID: 31852738 Free PMC article.
-
A tale of two CLCs: biophysical insights toward understanding ClC-5 and ClC-7 function in endosomes and lysosomes.J Physiol. 2015 Sep 15;593(18):4139-50. doi: 10.1113/JP270604. Epub 2015 Jun 26. J Physiol. 2015. PMID: 26036722 Free PMC article. Review.
Cited by
-
ClC-7 drives intraphagosomal chloride accumulation to support hydrolase activity and phagosome resolution.J Cell Biol. 2023 Jun 5;222(6):e202208155. doi: 10.1083/jcb.202208155. Epub 2023 Apr 3. J Cell Biol. 2023. PMID: 37010469 Free PMC article.
-
Endosomal chloride/proton exchangers need inhibitory TMEM9 β-subunits for regulation and prevention of disease-causing overactivity.Nat Commun. 2025 Apr 1;16(1):3117. doi: 10.1038/s41467-025-58546-3. Nat Commun. 2025. PMID: 40169677 Free PMC article.
-
Neurodegeneration Upon Dysfunction of Endosomal/Lysosomal CLC Chloride Transporters.Front Cell Dev Biol. 2021 Feb 23;9:639231. doi: 10.3389/fcell.2021.639231. eCollection 2021. Front Cell Dev Biol. 2021. PMID: 33708769 Free PMC article. Review.
-
ClC-3 regulates the excitability of nociceptive neurons and is involved in inflammatory processes within the spinal sensory pathway.Front Cell Neurosci. 2022 Aug 24;16:920075. doi: 10.3389/fncel.2022.920075. eCollection 2022. Front Cell Neurosci. 2022. PMID: 37124866 Free PMC article.
-
Chloride Channel-3 (ClC-3) Modifies the Trafficking of Leucine-Rich Repeat-Containing 8A (LRRC8A) Anion Channels.J Membr Biol. 2023 Apr;256(2):125-135. doi: 10.1007/s00232-022-00271-9. Epub 2022 Nov 2. J Membr Biol. 2023. PMID: 36322172 Free PMC article.
References
-
- Friedrich T., Breiderhoff T., and Jentsch T. J. (1999) Mutational analysis demonstrates that ClC-4 and ClC-5 directly mediate plasma membrane currents. J. Biol. Chem. 274, 896–902 - PubMed
-
- Kawasaki M., Uchida S., Monkawa T., Miyawaki A., Mikoshiba K., Marumo F., and Sasaki S. (1994) Cloning and expression of a protein kinase C-regulated chloride channel abundantly expressed in rat brain neuronal cells. Neuron 12, 597–604 - PubMed
-
- van Slegtenhorst M. A., Bassi M. T., Borsani G., Wapenaar M. C., Ferrero G. B., de Conciliis L., Rugarli E. I., Grillo A., Franco B., Zoghbi H. Y., and Ballabio A. (1994) A gene from the Xp22.3 region shares homology with voltage-gated chloride channels. Hum. Mol. Genet. 3, 547–552 - PubMed
-
- Stobrawa S. M., Breiderhoff T., Takamori S., Engel D., Schweizer M., Zdebik A. A., Bösl M. R., Ruether K., Jahn H., Draguhn A., Jahn R., and Jentsch T. J. (2001) Disruption of ClC-3, a chloride channel expressed on synaptic vesicles, leads to a loss of the hippocampus. Neuron 29, 185–196 - PubMed
MeSH terms
Substances
LinkOut - more resources
Full Text Sources
Other Literature Sources
Molecular Biology Databases
Research Materials
