. 2017 Nov 17;292(46):18973-18987.
doi: 10.1074/jbc.M117.793984. Epub 2017 Sep 26.

Ligand-dependent corepressor (LCoR) represses the transcription factor C/EBPβ during early adipocyte differentiation

Affiliations

Ligand-dependent corepressor (LCoR) represses the transcription factor C/EBPβ during early adipocyte differentiation

Hongchao Cao et al. J Biol Chem. .

Abstract

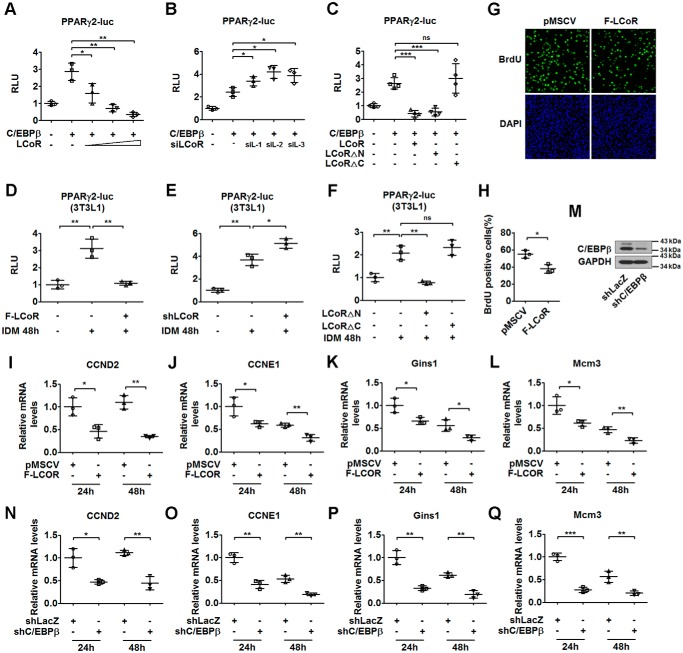
Nuclear receptors (NRs) regulate gene transcription by recruiting coregulators, involved in chromatin remodeling and assembly of the basal transcription machinery. The NR-associated protein ligand-dependent corepressor (LCoR) has previously been shown to suppress hepatic lipogenesis by decreasing the binding of steroid receptor coactivators to thyroid hormone receptor. However, the role of LCoR in adipogenesis has not been established. Here, we show that LCoR expression is reduced in the early stage of adipogenesis in vitro LCoR overexpression inhibited 3T3-L1 adipocyte differentiation, whereas LCoR knockdown promoted it. Using an unbiased affinity purification approach, we identified CCAAT/enhancer-binding protein β (C/EBPβ), a key transcriptional regulator in early adipogenesis, and corepressor C-terminal binding proteins as potential components of an LCoR-containing complex in 3T3-L1 adipocytes. We found that LCoR directly interacts with C/EBPβ through its C-terminal helix-turn-helix domain, required for LCoR's inhibitory effects on adipogenesis. LCoR overexpression also inhibited C/EBPβ transcriptional activity, leading to inhibition of mitotic clonal expansion and transcriptional repression of C/EBPα and peroxisome proliferator-activated receptor γ2 (PPARγ2). However, LCoR overexpression did not affect the recruitment of C/EBPβ to the promoters of C/EBPα and PPARγ2 in 3T3-L1 adipocytes. Of note, restoration of PPARγ2 or C/EBPα expression attenuated the inhibitory effect of LCoR on adipogenesis. Mechanistically, LCoR suppressed C/EBPβ-mediated transcription by recruiting C-terminal binding proteins to the C/EBPα and PPARγ2 promoters and by modulating histone modifications. Taken together, our results indicate that LCoR negatively regulates early adipogenesis by repressing C/EBPβ transcriptional activity and add LCoR to the growing list of transcriptional corepressors of adipogenesis.

Keywords: CCAAT-enhancer-binding protein (C/EBP); adipogenesis; nuclear receptor; peroxisome proliferator-activated receptor (PPAR); transcription corepressor.


Conflict of interest statement

The authors declare that they have no conflicts of interest with the contents of this article

Figures

Figure 1.
Figure 1.
Overexpression of LCoR inhibits adipogenesis. A–C, the expression levels of LCoR during adipogenesis. 3T3-L1 (A and B) or SVF (C) cells were harvested at the indicated times after adipogenic induction. The mRNA and protein levels of LCoR were measured by qPCR (A and C) or Western blotting (B), respectively. D and E, the overexpression of LCoR in 3T3-L1 preadipocytes was confirmed by qPCR (D) and Western blotting (E). 3T3-L1 preadipocytes were infected with a retroviral vector containing F-LCoR or an empty vector (pMSCV) as a control. F, Oil Red O staining of 3T3-L1 cells stably overexpressing F-LCoR or pMSCV was performed on day (d) 8 of differentiation. G–K, the expression levels of adipogenic genes in 3T3-L1 cells overexpressing LCoR during adipogenesis. 3T3-L1 cells stably overexpressing F-LCoR or pMSCV were harvested at the indicated times after adipogenic induction. The mRNA and protein levels of C/EBPβ, C/EBPα, PPARγ, and ap2 were examined by qPCR (G–J) or Western blotting (K), respectively. Immunoblots and Oil Red O staining shown here are representative of at least three independent experiments, which yielded similar results. Data are represented as mean ± S.D. (n = 3). Error bars represent S.D. ***, p < 0.001.
Figure 2.
Figure 2.
Knockdown of LCoR enhances adipogenesis. A and B, the efficiency of the knockdown of LCoR in 3T3-L1 preadipocytes was determined by qPCR (A) and Western blotting (B). 3T3-L1 preadipocytes were infected with a retroviral vector containing shLCoR or shRNA targeting LacZ (shLacZ) as a control. C, Oil Red O staining of 3T3-L1 cells stably overexpressing shLCoR or shLacZ was performed on day (d) 8 of differentiation. D–H, 3T3-L1 cells stably overexpressing shLCoR or shLacZ were harvested at the indicated times after adipogenic induction. The mRNA and protein levels of C/EBPβ, C/EBPα, PPARγ, and ap2 were investigated by qPCR (D–G) or Western blotting (H), respectively. The results of Western blotting and Oil Red O staining are typical of at least three independent experiments. Data are represented as mean ± S.D. (n = 3–4). Error bars represent S.D. *, p < 0.05; **, p < 0.01; ***, p < 0.001.
Figure 3.
Figure 3.
LCoR inhibits adipogenesis through directly interacting with C/EBPβ. A, 3T3-L1 preadipocytes stably overexpressing F-LCoR or an empty vector (pMSCV) were induced to differentiate for 2 days. LCoR-associated proteins purified from nuclear extracts of indicated cells were separated by SDS-PAGE and visualized by silver staining. The positions of identified proteins are indicated on the right, and molecular mass markers (kDa) are shown on the left. B, HEK 293T cells were transiently transfected with F-LCoR and C/EBPβ constructs. After 36 h, the cell lysates were immunoprecipitated with antibodies against IgG or FLAG and immunoblotted (IB) with antibodies against C/EBPβ or LCoR as indicated. C, the lysates of 3T3-L1 cells after differentiation for 48 h were immunoprecipitated with antibodies against IgG or C/EBPβ and then immunoblotted with antibodies against C/EBPβ or LCoR as indicated. D, schematic representation of full-length and truncated LCoR proteins with main functional motifs and boundaries indicated. E, HEK 293T cells were transiently transfected with the indicated constructs. After 36 h, the cell lysates were immunoprecipitated with antibodies against FLAG and immunoblotted with antibodies against C/EBPβ or LCoR. F, GST pulldown analysis was performed using in vitro translated C/EBPβ with GST control or with full-length or truncated LCoR GST fusion proteins as indicated. G, Oil Red O staining of 3T3-L1 cells stably overexpressing F-LCoR or truncated LCoR was performed on day 8 of differentiation. Blots and Oil Red O staining shown here are representative of at least three independent experiments, which yielded similar results.
Figure 4.
Figure 4.
LCoR inhibits the transcriptional activity of C/EBPβ and mitotic clonal expansion. A–C, HEK 293T cells were transiently transfected with a luciferase reporter plasmid containing PPARγ2 promoter (−602 to +52) (PPARγ2-luc) with or without a C/EBPβ construct in the absence or presence of increasing amounts of LCoR (A), siRNAs targeting LCoR (B), or full-length or truncated LCoR as indicated (C). The luciferase activity was measured and is shown as relative luciferase units (RLU). D–F, 3T3-L1 cells were infected with retrovirus expressing a PPARγ2 promoter (−602 to +52)-driven luciferase reporter with or without retrovirus expressing F-LCoR (D), shLCoR (E), or truncated LCoR (F) as indicated. The luciferase activities were analyzed before or 48 h after differentiation induction using insulin, dexamethasone, and 3-isobutyl-1-methylxanthine (IDM) and shown as relative luciferase units (RLU). G and H, representative image (G) and percentages of BrdU-positive cells (H) are shown. 18 h after adipogenic induction, 3T3-L1 cells stably overexpressing F-LCoR or an empty vector (pMSCV) were labeled with BrdU for 2 h and then stained with DAPI. The fluorescence of BrdU (green) and DAPI (blue) was detected with a fluorescence microscope. I–L, 3T3-L1 cells stably overexpressing F-LCoR or pMSCV were harvested at the indicated times after adipogenic induction. The mRNA levels of CCND2 (I), CCNE1 (J), Gins1 (K), and Mcm3 (L) were measured by qPCR analysis. M, the efficiency of the knockdown of C/EBPβ in 3T3-L1 cells was determined by Western blotting. 3T3-L1 preadipocytes were infected with a retroviral vector containing shC/EBPβ or shLacZ as a control. N–Q, 3T3-L1 cells infected with shC/EBPβ or shLacZ were harvested at the indicated times after adipogenic induction. The mRNA levels of CCND2 (N), CCNE1 (O), Gins1 (P), and Mcm3 (Q) were measured by qPCR analysis. Blots shown here are representative of at least three independent experiments. Data are represented as mean ± S.D. (n = 3–4). Error bars represent S.D. *, p < 0.05; **, p < 0.01; ***, p < 0.001; ns, not significant.
Figure 5.
Figure 5.
The interaction of LCoR with C/EBPβ does not affect the binding of C/EBPβ to DNA. A–D, ChIP analysis of C/EBPβ (A and B) or F-LCoRs (wild-type or truncated LCoR) (C and D) enrichment on the C/EBPα (A and C) or PPARγ2 (B and D) promoter. At 0 and 24 h after adipogenic induction, ChIP experiments were performed using antibodies against C/EBPβ or FLAG as indicated. The precipitated DNA was analyzed by analysis with primers targeting the C/EBPα or PPARγ2 promoter region. E, confocal microscope images of C/EBPβ (red) and F-LCoRs (green) in 3T3-L1 cells stably overexpressing FLAG-tagged wild-type or truncated LCoR. Cells were induced to differentiate for 24 h before they were fixed. C/EBPβ and LCoR proteins were detected using antibodies against C/EBPβ and FLAG, respectively. The confocal microscope images shown here are representative of at least three independent experiments. Data are represented as mean ± S.D. (n = 3). Error bars represent S.D. *, p < 0.05; **, p < 0.01; ns, not significant. IDM, insulin, dexamethasone, and 3-isobutyl-1-methylxanthine.
Figure 6.
Figure 6.
Overexpression of PPARγ2 or C/EBPα attenuates the inhibitory effect of LCoR on adipogenesis. A–D, the overexpression of PPARγ2 or C/EBPα in 3T3-L1 preadipocytes was confirmed by qPCR (A and B) and Western blotting (C and D). 3T3-L1 preadipocytes infected with retroviruses (pMSCVpuro) expressing F-LCoR were then infected with retroviruses (pMSCVhygro) expressing PPARγ2 or C/EBPα. E, Oil Red O staining was performed on day 8 of differentiation. Modified cells were induced to undergo adipogenesis in the presence or absence of 0.5 μm synthetic PPARγ ligand Rosi or vehicle (DMSO) alone. F–H, the expression levels of ap2, plin2, and adiponectin were examined by qPCR analysis on day 8 of differentiation. Immunoblots and Oil Red O staining shown here are representative of at least three independent experiments. Data are represented as mean ± S.D. (n = 3–4). Error bars represent S.D. *, p < 0.05; **, p < 0.01; ***, p < 0.001; ns, not significant.
Figure 7.
Figure 7.
LCoR inhibits adipogenesis through recruiting CtBP. A, GST pulldown analysis was performed using in vitro translated LCoR or C/EBPβ with GST or GST-CtBP1 fusion proteins as indicated. B, confocal microscope images of endogenous C/EBPβ (green) and CtBP1 (red) in 3T3-L1 cells stably expressing F-LCoR or an empty vector (pMSCV). Cells were induced to differentiate for 24 h before they were fixed. C, confocal microscope images of C/EBPβ (green) and CtBP1 (red) in 3T3-L1 cells. Cells were induced to differentiate for 24 h before they were fixed. The different localization of CtBP1 and C/EBPβ was much more obvious in 3T3-L1 cells undergoing mitosis. D, schematic representation of mutant LCoRs (LCoR D1 and LCoR D2) with CtBP-binding sites deleted. E, HEK 293T cells were transiently transfected with the indicated constructs. After 36 h, the cell lysates were immunoprecipitated with antibodies against C/EBPβ and immunoblotted with antibodies against CtBP1, C/EBPβ, or FLAG. F, the amount of CtBP1 that was coimmunoprecipitated with C/EBPβ was normalized to the amount of CtBP1 input (top panel) or further normalized by the amount of coimmunoprecipitated LCoR or LCoR mutants (bottom panel). G, HEK 293T cells were transiently transfected with a luciferase reporter plasmid containing PPARγ2 promoter (PPARγ2-luc) with or without a C/EBPβ construct in the absence or presence of LCoR, LCoR D1, or LCoR D2 as indicated. The luciferase activity was measured and is shown as relative luciferase units (RLU). H, Oil Red O staining of 3T3-L1 cells stably overexpressing F-LCoR, F-LCoR D1, or F-LCoR D2 was performed on day 8 of differentiation. I, the efficiency of the knockdown of CtBP1 and CtBP2 by shCtBP1 and shCtBP2, respectively, in 3T3-L1 preadipocytes was determined by Western blotting. J, Oil Red O staining of 3T3-L1 cells infected with F-LCoR or both F-LCoR and shCtBPs (shCtBP1 + shCtBP2) was performed on day 8 of differentiation. K–M, the mRNA levels of C/EBPα, PPARγ, and ap2 were examined by qPCR analysis in these differentiated 3T3-L1 cells infected with F-LCoR or both F-LCoR and shCtBPs. Immunoblots, confocal microscope images, and Oil Red O staining shown here are representative of at least three independent experiments. Luciferase assay and qPCR data are represented as mean ± S.D. (n = 3–4). Error bars represent S.D. **, p < 0.01; ***, p < 0.001; ns, not significant. aa, amino acids.
Figure 8.
Figure 8.
LCoR alters histone modifications on adipogenic promoters. A, ChIP analysis of the recruitment of CtBP1 on the PPARγ2 promoter in 3T3-L1 adipocytes overexpressing F-LCoR. B and C, ChIP analysis of histone modification on the PPARγ2 promoter in 3T3-L1 adipocytes overexpressing F-LCoR. ChIP experiments were performed using CtBP1 antibody (A), H3K9acK14ac antibody (B), and H3K9me2 antibody (C), respectively. D, ChIP analysis of the recruitment of CtBP1 on the PPARγ2 promoter in 3T3-L1 adipocytes infected with F-LCoR or both F-LCoR and shCtBPs. E and F, ChIP analysis of histone modification on the PPARγ2 promoter in 3T3-L1 adipocytes infected with F-LCoR or both F-LCoR and shCtBPs. ChIP experiments were performed using CtBP1 antibody (A), H3K9acK14ac antibody (E), and H3K9me2 antibody (F), respectively. G, schematic diagram of the working model of LCoR during early adipogenesis. Data are represented as mean ± S.D. of independent experiments (n = 3). Error bars represent S.D. *, p < 0.05; **, p < 0.01; ***, p < 0.001; ns, not significant.

References

    1. Fowler A. M., and Alarid E. T. (2004) Dynamic control of nuclear receptor transcription. Sci. STKE 2004, pe51. - PubMed
    1. Hermanson O., Glass C. K., and Rosenfeld M. G. (2002) Nuclear receptor coregulators: multiple modes of modification. Trends Endocrinol. Metab. 13, 55–60 - PubMed
    1. Collingwood T. N., Urnov F. D., and Wolffe A. P. (1999) Nuclear receptors: coactivators, corepressors and chromatin remodeling in the control of transcription. J. Mol. Endocrinol. 23, 255–275 - PubMed
    1. Fernandes I., Bastien Y., Wai T., Nygard K., Lin R., Cormier O., Lee H. S., Eng F., Bertos N. R., Pelletier N., Mader S., Han V. K., Yang X. J., and White J. H. (2003) Ligand-dependent nuclear receptor corepressor LCoR functions by histone deacetylase-dependent and -independent mechanisms. Mol. Cell 11, 139–150 - PubMed
    1. Palijan A., Fernandes I., Bastien Y., Tang L., Verway M., Kourelis M., Tavera-Mendoza L. E., Li Z., Bourdeau V., Mader S., Yang X. J., and White J. H. (2009) Function of histone deacetylase 6 as a cofactor of nuclear receptor coregulator LCoR. J. Biol. Chem. 284, 30264–30274 - PMC - PubMed

Publication types

Substances

LinkOut - more resources