Comparative Study
. 2017 Nov 10;292(45):18565-18576.
doi: 10.1074/jbc.M117.800771. Epub 2017 Sep 27.

Surfactant protein A down-regulates epidermal growth factor receptor by mechanisms different from those of surfactant protein D

Affiliations
Comparative Study

Surfactant protein A down-regulates epidermal growth factor receptor by mechanisms different from those of surfactant protein D

Yoshihiro Hasegawa et al. J Biol Chem. .

Abstract

We recently reported that the lectin surfactant protein D (SP-D) suppresses epidermal growth factor receptor (EGFR) signaling by interfering with ligand binding to EGFR through an interaction between the carbohydrate-recognition domain (CRD) of SP-D and N-glycans of EGFR. Here, we report that surfactant protein A (SP-A) also suppresses EGF signaling in A549 human lung adenocarcinoma cells and in CHOK1 cells stably expressing human EGFR and that SP-A inhibits the proliferation and motility of the A549 cells. Results with 125I-EGF indicated that SP-A interferes with EGF binding to EGFR, and a ligand blot analysis suggested that SP-A binds EGFR in A549 cells. We also found that SP-A directly binds the recombinant extracellular domain of EGFR (soluble EGFR or sEGFR), and this binding, unlike that of SP-D, was not blocked by EDTA, excess mannose, or peptide:N-glycosidase F treatment. We prepared a collagenase-resistant fragment (CRF) of SP-A, consisting of CRD plus the neck domain of SP-A, and observed that CRF directly binds sEGFR but does not suppress EGF-induced phosphorylation of EGFR in or proliferation of A549 cells. These results indicated that SP-A binds EGFR and down-regulates EGF signaling by inhibiting ligand binding to EGFR as well as SP-D. However, unlike for SP-D, SP-A lectin activity and EGFR N-glycans were not involved in the interaction between SP-A and EGFR. Furthermore, our results suggested that oligomerization of SP-A is necessary to suppress the effects of SP-A on EGF signaling.

Keywords: collectin; epidermal growth factor receptor (EGFR); lung cancer; oligomerization; pulmonary surfactant.


Conflict of interest statement

The authors declare that they have no conflicts of interest with the contents of this article

Figures

Figure 1.
Figure 1.
SP-A suppresses EGF signaling in A549 human lung cancer cells and CHOK1 cells stably expressing human EGFR. A, A549 human lung adenocarcinoma cells were serum-starved overnight and incubated with 1 μm gefitinib for 2 h at 37 °C. After incubation, the cells were stimulated with 10 ng/ml EGF for 10 min at 37 °C. The cell lysate was prepared, and 15 μg of protein/lane were subjected to Western blotting (WB) using indicated antibodies. The data are representative of three independent experiments. B, A549 cells were serum-starved overnight and incubated with various concentrations of SP-A for 2 h at 37 °C. After incubation, the cells were washed in a medium without serum and stimulated with 10 ng/ml EGF for 10 min at 37 °C. The cell lysate was prepared, and 15 μg of protein/lane were subjected to Western blotting using the indicated antibodies. The lower panels display the densitometric evaluation, and data are presented as mean ± S.D. (error bars) from three independent experiments. Data were expressed as percentage of phosphorylation relative to that of control cells treated with EGF and without SP-A. C, same experiment as B was performed using CHOK1 cells stably expressing human EGFR. Lower panels display densitometric analyses, and data are presented as mean ± S.D. (error bars) from three independent experiments. Student's t test or Welch's t test was used for statistical comparisons. *, p < 0.05; **, p < 0.01 (compared with control).
Figure 2.
Figure 2.
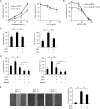
SP-A suppresses the cell proliferation, migration, and invasion in A549 cells. A, left panel, A549 cells were plated in a 96-well plate (1 × 10³ cells/well), maintained in DMEM with 10% (v/v) FCS, and incubated with 10 μg/ml SP-A at 37 °C. The cell proliferation was assayed after 24, 48, and 72 h using the WST-1 reagent. The absorbance at 440 nm was measured on the plate reader. Right panel, A549 cells were incubated with various concentrations of SP-A, and the cell proliferation was assayed after 72 h. The data shown are presented as mean ± S.D. (error bar) from three independent experiments. Data are expressed as percent changes in proliferation relative to that in untreated control cells. Student's t test or Welch's t test was used for statistical comparisons. *, p < 0.05; **, p < 0.01 (compared with the control). B, A549 cells were incubated with the indicated concentrations of gefitinib with or without 20 μg/ml SP-A. Cell proliferation was assessed after 48 h using the WST-1 reagent. The data shown are presented as mean ± S.D. (error bar) from three independent experiments. Data are expressed as percent changes in cell proliferation relative to that in control cells treated with 0.1% dimethyl sulfoxide (DMSO) only. Student's t test or Welch's t test was used for statistical comparisons. *, p < 0.05; **, p < 0.01 (compared with the control). C, A549 cells were seeded into the upper insert of a transwell double chamber in DMEM with 0.1% (v/v) BSA and EGF (10 ng/ml) with or without SP-A (10 μg/ml). DMEM with 10% (v/v) FCS was added to the bottom wells as a chemoattractant. A control insert was used for migration assay (left panel) and a Matrigel insert was used for invasion assay (right panel). After 22 h, migrating cells or invasive cells were fixed, stained with DAPI, and counted under a microscope. The data shown are the mean ± S.D. (error bar) from three independent experiments. Data were expressed as percentage of migration and invasion relative to that of EGF-treated control cells. Student's t test or Welch's t test was used for statistical comparisons. *, p < 0.05; **, p < 0.01. D, A549 cells were seeded into the upper insert of a transwell double chamber using DMEM with 0.1% (v/v) BSA and EGF (10 ng/ml), with or without SP-A (20 μg/ml) or gefitinib (10 μm). DMEM with 10% (v/v) FCS was then added to the bottom wells as a chemoattractant. A control insert was used for the migration assay (left panel), and a Matrigel insert was used for the invasion assay (right panel). After 22 h, migrating or invading cells were stained with DAPI and counted using a microscope. The data shown are the mean ± S.D. (error bar) from three independent experiments. Data are expressed as percent changes in the number of migrating or invading cells relative to those in control cultures treated with EGF plus 0.1% DMSO. Student's t test or Welch's t test was used for statistical comparisons. *, p < 0.05; **, p < 0.01. E, A549 cells were applied into each well of ibidi chambers. After incubation for 24 h, the culture inserts were removed, and the dishes were filled with a serum-free medium. EGF (100 ng/ml) and SP-A (20 μg/ml) were added to the medium, and the cells were incubated for 24 h. The migrated cells were measured under a microscope. The data shown are the mean ± S.D. (error bar) from three independent experiments. A Student's t test or Welch correction was used for statistical comparisons. *, p < 0.05; **, p < 0.01 (compared with EGF-treated control cells).
Figure 3.
Figure 3.
SP-A reduces the binding of EGF to EGFR in A549 cells. A, 125I-EGF binding to A549 cells in the presence and absence of SP-A. Binding of EGF to the cells was evaluated using a γ-counter as described under “Experimental procedures.” Experiments were performed in duplicate and were repeated three times. The data are representative of three independent experiments. B, dose-dependent suppression of EGF binding by SP-A. Binding of EGF to the cells was evaluated using a γ-counter as described under “Experimental procedures.” The data are expressed as relative values with the binding in the absence of SP-A being 100%. Experiments were performed in duplicate and were repeated three times. The data are representative of three independent experiments.
Figure 4.
Figure 4.
SP-A does not influence cell-surface expression of EGFR in A549 cells. A549 cells were serum-starved overnight. The next day, cells were incubated with 20 μg/ml SP-A for 2 h, washed, and incubated with 0.5 mg/ml Sulfo-NHS-LC-biotin for 30 min at 4 °C. Whole-cell lysates were immunoprecipitated with the monoclonal anti-EGFR antibody (clone Ab-11) or control IgG. Samples were separated by SDS-PAGE, transferred onto PVDF membranes, and probed with HRP-conjugated streptavidin (right panel) or the monoclonal anti-human EGFR antibody (clone D38B1), and the bands were detected using HRP-conjugated anti-rabbit IgG (left panel). The data are representative of three independent experiments.
Figure 5.
Figure 5.
SP-A binds to EGFR in A549 cells, H441 cells, and CHOK1 cells stably expressing EGFR. A, whole-cell lysate of A549 cells was immunoprecipitated (IP) with anti-EGFR monoclonal antibody Ab-11 or control IgG (0. 8 μg) at 4 °C for 16 h. The samples and BSA (200 ng/lane) were subjected to SDS-PAGE and transferred onto PVDF membranes. The membranes were incubated with or without SP-A (1 μg/ml) for 16 h. The membranes not incubated with SP-A were subjected to Western blotting using an anti-human EGFR monoclonal antibody (WB: EGFR). The membranes incubated with SP-A were then treated with an anti-human SP-A polyclonal antibody (SP-A pAb) or monoclonal antibodies PE10 (SP-A mAb (PE10)) or PC6 (SP-A mAb (PC6)), which was followed by incubation with HRP-labeled anti-rabbit IgG or anti-mouse IgG (upper panel). As a negative control, the membranes in the absence of incubation with SP-A were also incubated with an anti-human SP-A polyclonal antibody (WB: SP-A pAb) or monoclonal antibodies PE10 (WB: SP-A mAb (PE10)) or PC6 (WB: SP-A mAb (PC6)), which was followed by incubation with HRP-labeled anti-rabbit IgG or anti-mouse IgG (lower panel). The data are representative of three independent experiments. B and C, experimental paradigm described in A was performed in H441 cells (B) and CHOK1 cells stably expressing EGFR (C) by using an anti-human SP-A polyclonal antibody, which was followed by incubation with HRP-labeled anti-rabbit IgG. The data are representative of three independent experiments.
Figure 6.
Figure 6.
SP-A binds to the extracellular domain of EGFR. A, sEGFR was produced in Flp-In CHOK1 cells and purified as described under “Experimental procedures.” 0.5 μg of proteins with or without PNGase F treatment were subjected to SDS-PAGE, which was followed by Coomassie Brilliant Blue R-250 staining (CBB). sEGFR with or without PNGase F treatment was electrophoresed, transferred onto PVDF membranes, and subjected to immunoblotting using an anti-EGFR monoclonal antibody Ab-5 (WB: EGFR (Ab5)) and an anti-His tag polyclonal antibody (WB: His-tag) and then HRP-labeled anti-mouse or anti-rabbit IgG. The same membranes were incubated with biotinylated ConA (Con A) and DSA (DSA) and then HRP-labeled streptavidin. B, indicated concentrations of SP-A were incubated with sEGFR (100 ng/well) or BSA (100 ng/well) coated onto microtiter wells at room temperature for 2 h in the presence of 2 mm CaCl2. ELISA was performed as described under “Experimental procedures.” The data shown are the means ± S.D. (error bars) from three independent experiments. A Student's t test or Welch correction was used for statistical comparisons. *, p < 0.05; **, p < 0.01. C, same experiment as that in B was performed in the presence of 2 mm EDTA instead of CaCl2. D, same experiment as that in B was performed in the presence of 2 mm CaCl2 with 0.2 m mannose. E, same experiment as that in B was performed with sEGFR with or without PNGase F treatment. F, same experiment as that in B was performed in the presence of 2 mm CaCl2 with 0.5 m NaCl. G, parameters of bindings of sEGFR to SP-A were determined by surface plasmon resonance analysis as described under “Experimental procedures.” Sensorgrams for the bindings of various concentrations of SP-A to sEGFR immobilized on a sensor chip are shown. For the running buffer, 5 mm Tris-HCl (pH 7.4), containing 0.15 m NaCl and 2 mm CaCl2, was used. H, same experiment as that in G was performed in a running buffer containing 2 mm EDTA instead of CaCl2. I, same experiment as that in G was performed in a running buffer containing 0.2 m mannose. J, sensorgrams for the bindings of various concentrations of SP-A to sEGFR with PNGase F treatment immobilized on a sensor chip are shown. The same running buffer as that in G was used. K, sensorgrams for binding of SP-A (40 nm) to sEGFR immobilized on a sensor chip in a running buffer containing 0.15 or 0.5 m NaCl are superimposed. RU, response units.
Figure 7.
Figure 7.
CRF of SP-A binds to the extracellular domain of EGFR. A, recombinant SP-A and CRF of SP-A (1 μg/lane) were subjected to 12.5% SDS-PAGE under reducing or non-reducing conditions and visualized with Coomassie Brilliant Blue staining. B, parameters of bindings of sEGFR to CRF of SP-A were determined by surface plasmon resonance analysis as described under “Experimental procedures.” Sensorgrams for the bindings of various concentrations of CRF of SP-A to sEGFR immobilized on a sensor chip are shown. C, A549 cells were serum-starved overnight and incubated with various concentrations of CRF of SP-A for 2 h at 37 °C. After incubation, the cells were washed in a medium without serum and stimulated with 10 ng/ml EGF for 10 min at 37 °C. The cell lysate was prepared, and 15 μg of protein/lane were subjected to Western blotting (WB) using indicated antibodies. Lower panels display densitometric analyses, and data are presented as mean ± S.D. (error bars) from three independent experiments. Data were expressed as percentage of phosphorylation relative to that of control cells treated with EGF and without CRF. Student's t test or Welch's t test was used for statistical comparisons. D, A549 cells were incubated with various concentrations of SP-A or CRF of SP-A, and the cell proliferation was assayed after 72 h. The data shown are the mean ± S.D. (error bar) from three independent experiments. Data were expressed as percentage of proliferation relative to that of untreated control cells. Student's t test or Welch correction was used for statistical comparisons. **, p < 0.01 (compared with CRF with SP-A at the same concentration).

Similar articles

Cited by

References

    1. Kuroki Y., and Voelker D. R. (1994) Pulmonary surfactant proteins. J. Biol. Chem. 269, 25943–25946 - PubMed
    1. Whitsett J. A., and Weaver T. E. (2002) Hydrophobic surfactant proteins in lung function and disease. N. Engl. J. Med. 347, 2141–2148 - PubMed
    1. Kuroki Y., Takahashi M., and Nishitani C. (2007) Pulmonary collectins in innate immunity of the lung. Cell. Microbiol. 9, 1871–1879 - PubMed
    1. Wright J. R. (2005) Immunoregulatory functions of surfactant proteins. Nat. Rev. Immunol. 5, 58–68 - PubMed
    1. Crouch E., Hartshorn K., and Ofek I. (2000) Collectins and pulmonary innate immunity. Immunol. Rev. 173, 52–65 - PubMed

Publication types

MeSH terms