

Functional analysis of an unusual porin-like channel that imports chitin for alternative carbon metabolism in Escherichia coli
- PMID: 28972167
- PMCID: PMC5702672
- DOI: 10.1074/jbc.M117.812321
Functional analysis of an unusual porin-like channel that imports chitin for alternative carbon metabolism in Escherichia coli
Abstract
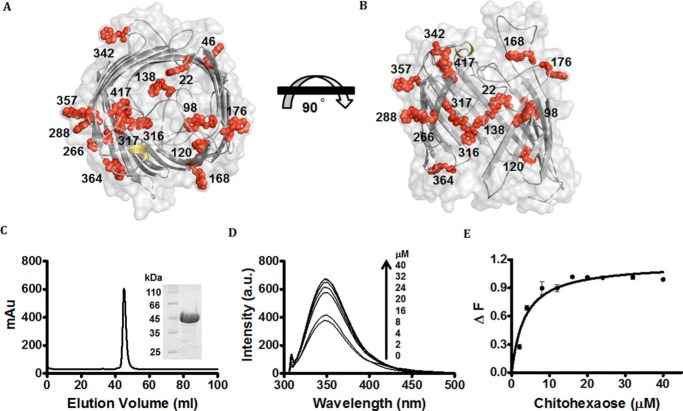
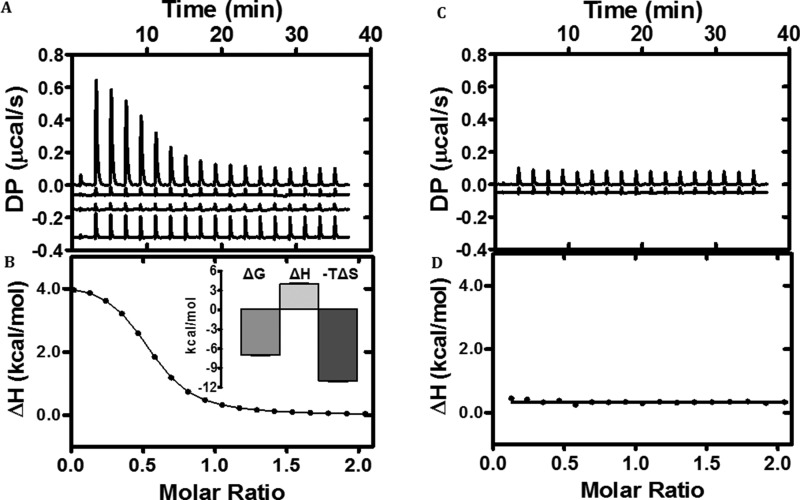
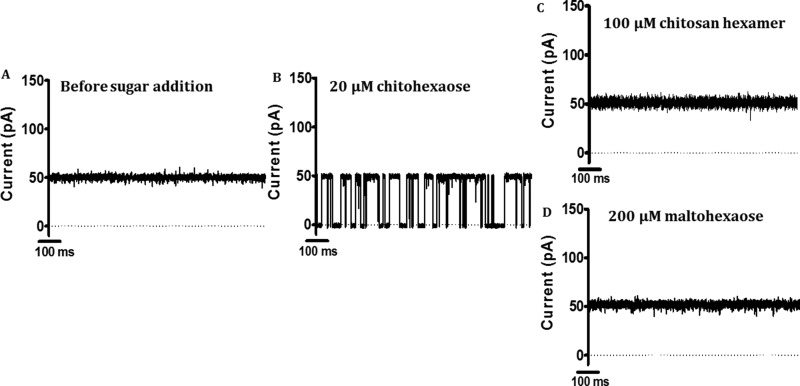
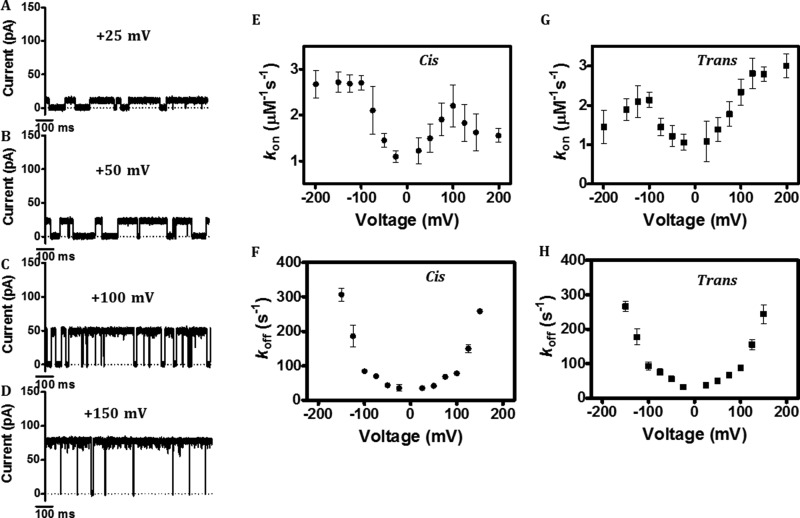
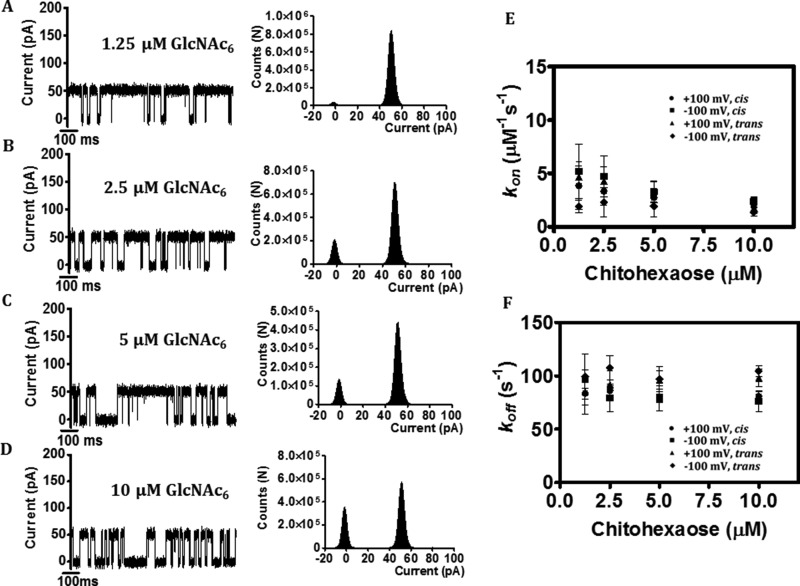
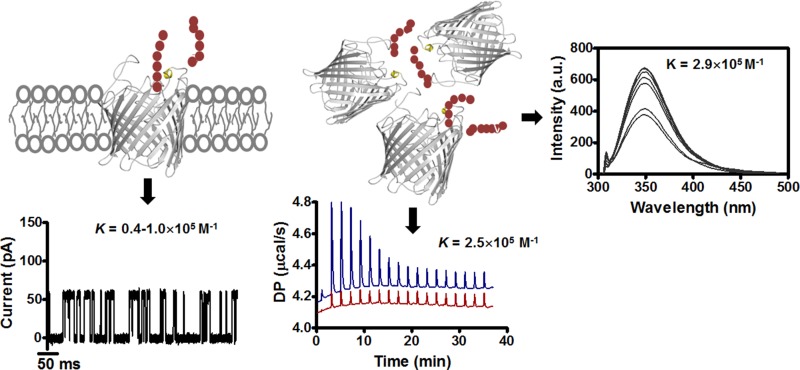
Escherichia coli have the genetic potential to use chitin as a carbon source in the absence of glucose, importing it via the chitin-uptake channel EcChiP for processing by the glucosamine catabolic pathway. The chip gene is usually not expressed when E. coli are grown on glucose-enriched nutrients, providing a general regulatory mechanism for the pathway. EcChiP is unusual in that it is homologous to porins and monomeric instead of trimeric, the typical form of sugar-specific channels, making it unclear how this channel operates. We recently reported that EcChiP could form a stable channel in lipid membranes and that the channel is specific for chitooligosaccharides. This report describes the biophysical nature of sugar-channel interactions and the kinetics of sugar association and dissociation. Titrating EcChiP with chitohexaose resulted in protein fluorescence enhancement in a concentration-dependent manner, yielding a binding constant of 2.9 × 10⁵ m-1, consistent with the value of 2.5 × 10⁵ m-1 obtained from isothermal titration microcalorimetry. Analysis of the integrated heat change suggested that the binding process was endothermic and driven by entropy. Single-channel recordings confirmed the voltage dependence of the penetration of chitohexaose molecules into and their release from EcChiP. Once inside the pore, the sugar release rate (koff) from the affinity site increased with elevated voltage, regardless of the side of sugar addition. Our findings revealed distinct thermodynamic and kinetic features of the activity of sugar-specific EcChiP and advance our knowledge of the physiological possibility of chitin utilization by non-chitinolytic bacteria.
© 2017 by The American Society for Biochemistry and Molecular Biology, Inc.
Conflict of interest statement
The authors declare that they have no conflicts of interest with the contents of this article
Figures
Similar articles
-
Identification and Functional Characterization of a Novel OprD-like Chitin Uptake Channel in Non-chitinolytic Bacteria.J Biol Chem. 2016 Jun 24;291(26):13622-33. doi: 10.1074/jbc.M116.728881. Epub 2016 May 12. J Biol Chem. 2016. PMID: 27226611 Free PMC article.
-
Single-channel properties, sugar specificity, and role of chitoporin in adaptive survival of Vibrio cholerae type strain O1.J Biol Chem. 2020 Jul 10;295(28):9421-9432. doi: 10.1074/jbc.RA120.012921. Epub 2020 May 14. J Biol Chem. 2020. PMID: 32409576 Free PMC article.
-
Structural basis for chitin acquisition by marine Vibrio species.Nat Commun. 2018 Jan 15;9(1):220. doi: 10.1038/s41467-017-02523-y. Nat Commun. 2018. PMID: 29335469 Free PMC article.
-
Structure and function of the porin channel.Kidney Int. 1995 Oct;48(4):930-40. doi: 10.1038/ki.1995.374. Kidney Int. 1995. PMID: 8569102 Review. No abstract available.
-
Transport across the bacterial outer membrane.J Bioenerg Biomembr. 1993 Dec;25(6):581-9. doi: 10.1007/BF00770245. J Bioenerg Biomembr. 1993. PMID: 8144487 Review.
Cited by
-
Probing the physiological roles of the extracellular loops of chitoporin from Vibrio campbellii.Biophys J. 2021 Jun 1;120(11):2124-2137. doi: 10.1016/j.bpj.2021.03.034. Epub 2021 Apr 1. Biophys J. 2021. PMID: 33812846 Free PMC article.
-
Chitoporin from Serratia marcescens: recombinant expression, purification and crystallization.Acta Crystallogr F Struct Biol Commun. 2020 Nov 1;76(Pt 11):536-543. doi: 10.1107/S2053230X20013874. Epub 2020 Oct 29. Acta Crystallogr F Struct Biol Commun. 2020. PMID: 33135672 Free PMC article.
References
-
- Kim B. H., and Gadd G. M. (2008) Bacterial physiology and metabolism, Cambridge University Press, Cambridge
-
- Francetic O., Badaut C., Rimsky S., and Pugsley A. P. (2000) The ChiA (YheB) protein of Escherichia coli K-12 is an endochitinase whose gene is negatively controlled by the nucleoid-structuring protein H-NS. Mol. Microbiol. 35, 1506–1517 - PubMed
-
- Peri K. G., Goldie H., and Waygood E. B. (1990) Cloning and characterization of the N-acetylglucosamine operon of Escherichia coli. Biochem. Cell Biol. 68, 123–137 - PubMed
-
- Yang C., Rodionov D. A., Li X., Laikova O. N., Gelfand M. S., Zagnitko O. P., Romine M. F., Obraztsova A. Y., Nealson K. H., and Osterman A. L. (2006) Comparative genomics and experimental characterization of N-acetylglucosamine utilization pathway of Shewanella oneidensis. J. Biol. Chem. 281, 29872–29885 - PubMed
MeSH terms
Substances
Associated data
- Actions
LinkOut - more resources
Full Text Sources
Other Literature Sources
Molecular Biology Databases
