. 2017 Dec 1;292(48):19656-19673.
doi: 10.1074/jbc.M117.796920. Epub 2017 Sep 29.

Inhibition of the sarco/endoplasmic reticulum (ER) Ca2+-ATPase by thapsigargin analogs induces cell death via ER Ca2+ depletion and the unfolded protein response

Affiliations

Inhibition of the sarco/endoplasmic reticulum (ER) Ca2+-ATPase by thapsigargin analogs induces cell death via ER Ca2+ depletion and the unfolded protein response

Pankaj Sehgal et al. J Biol Chem. .

Abstract

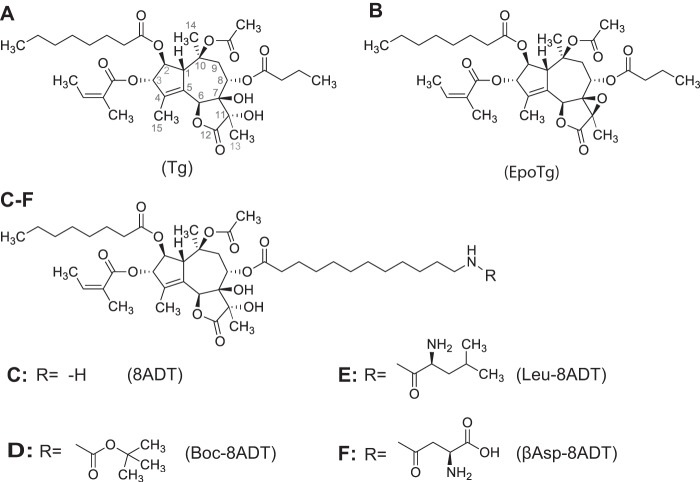
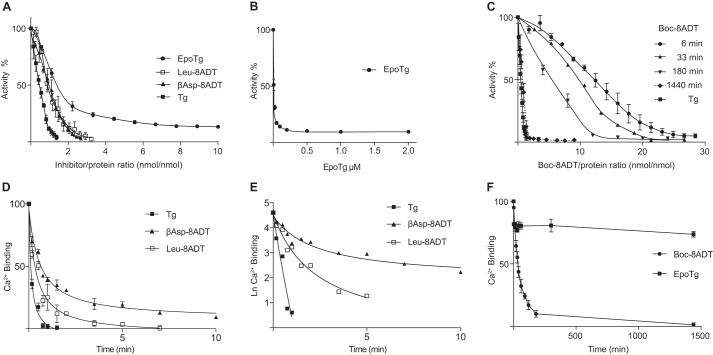
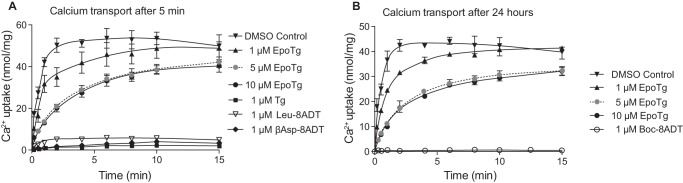
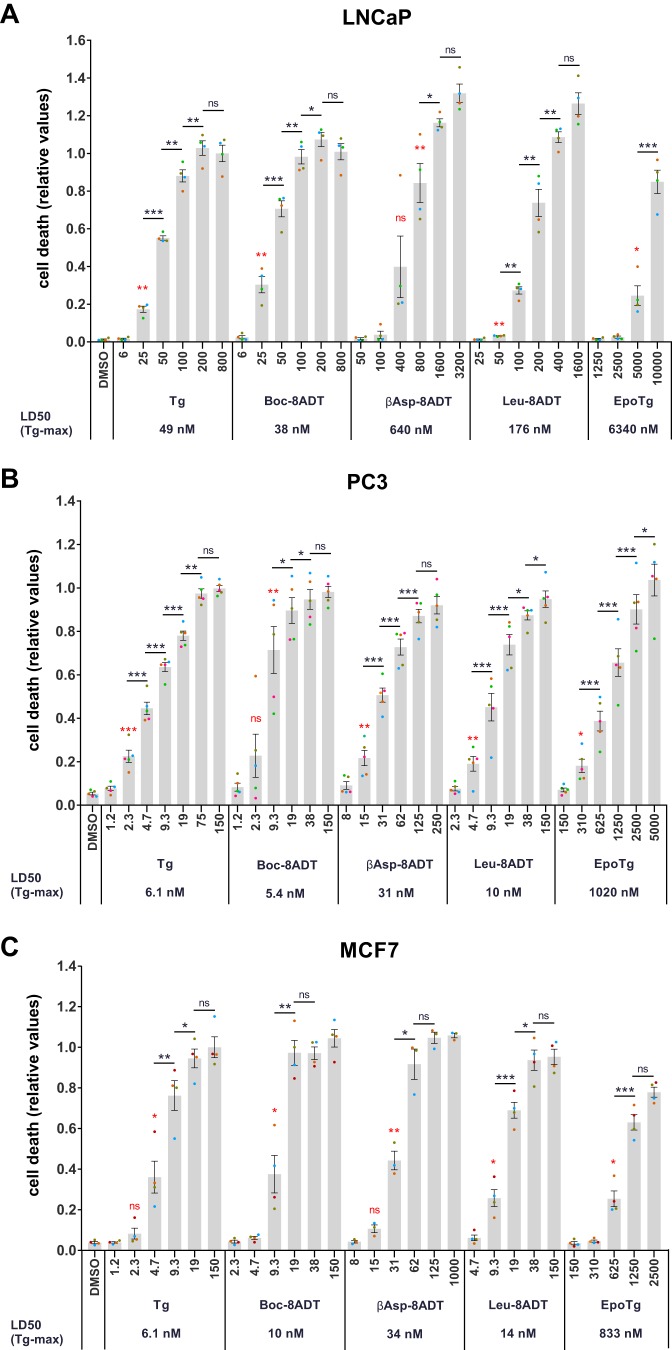
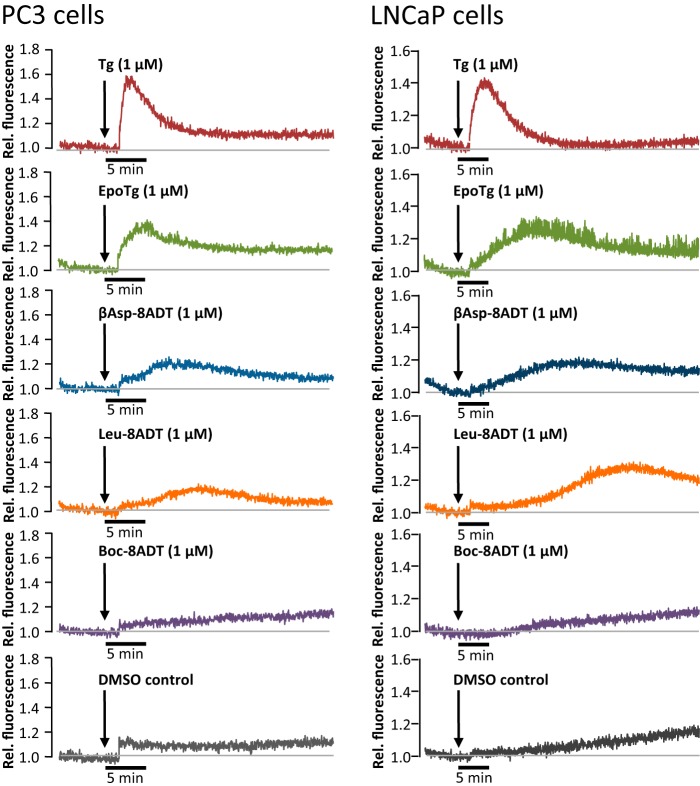
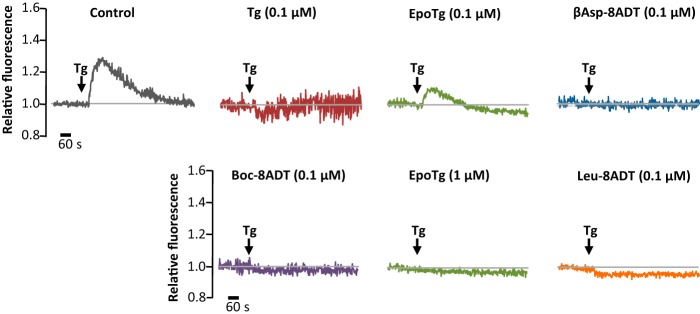
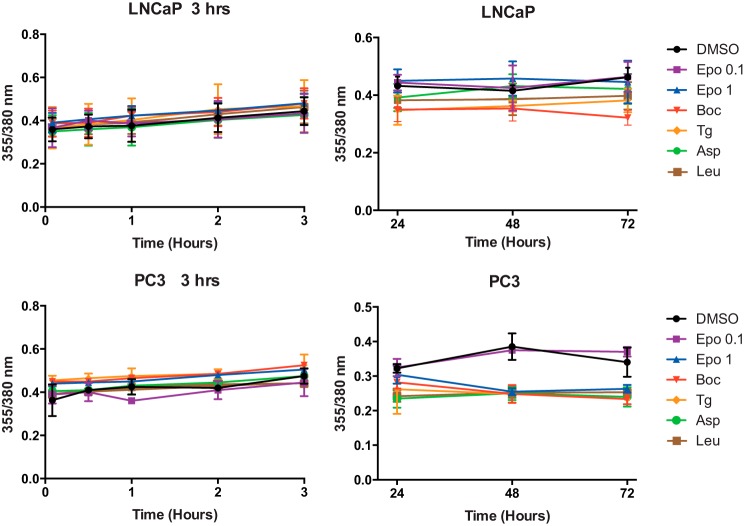
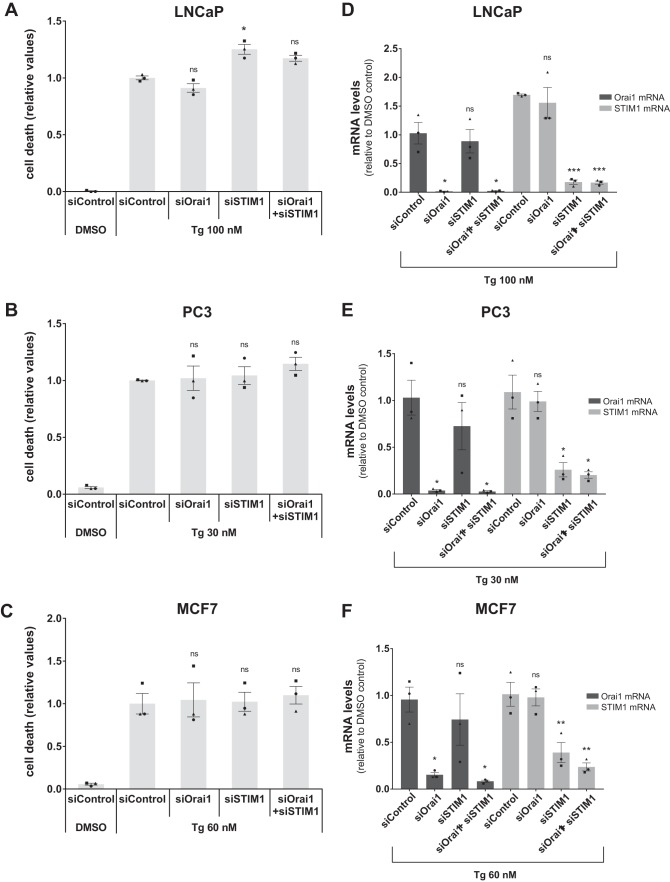
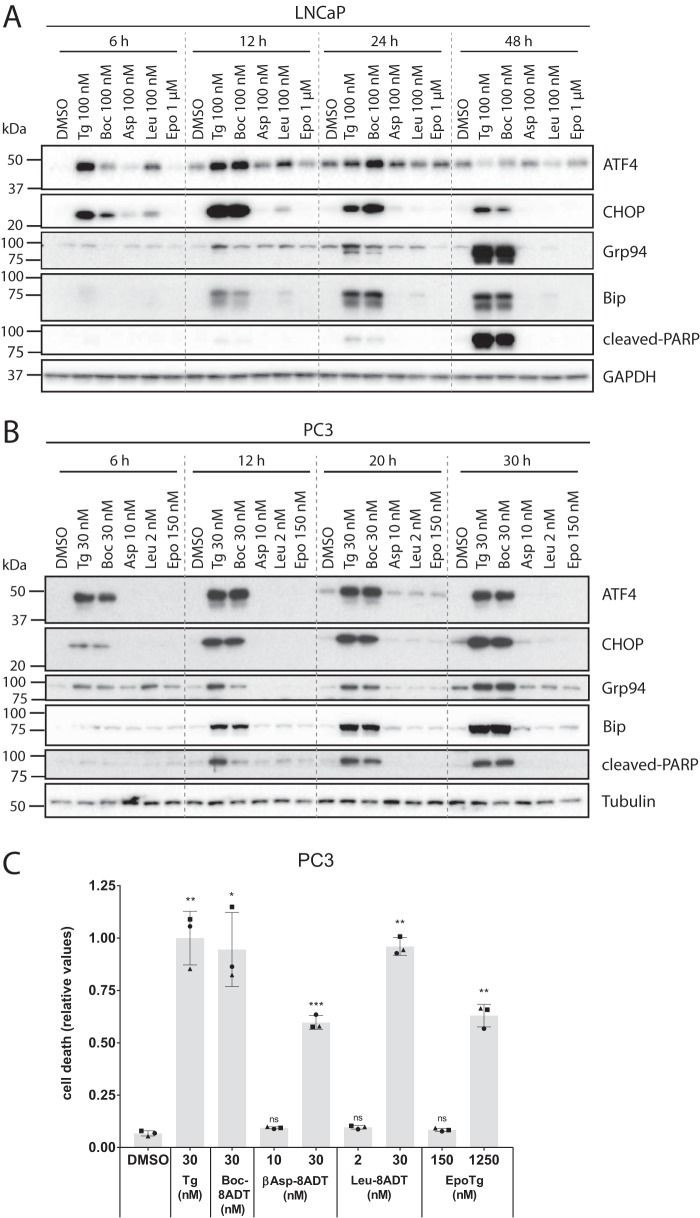
Calcium (Ca2+) is a fundamental regulator of cell signaling and function. Thapsigargin (Tg) blocks the sarco/endoplasmic reticulum (ER) Ca2+-ATPase (SERCA), disrupts Ca2+ homeostasis, and causes cell death. However, the exact mechanisms whereby SERCA inhibition induces cell death are incompletely understood. Here, we report that low (0.1 μm) concentrations of Tg and Tg analogs with various long-chain substitutions at the O-8 position extensively inhibit SERCA1a-mediated Ca2+ transport. We also found that, in both prostate and breast cancer cells, exposure to Tg or Tg analogs for 1 day caused extensive drainage of the ER Ca2+ stores. This Ca2+ depletion was followed by markedly reduced cell proliferation rates and morphological changes that developed over 2-4 days and culminated in cell death. Interestingly, these changes were not accompanied by bulk increases in cytosolic Ca2+ levels. Moreover, knockdown of two key store-operated Ca2+ entry (SOCE) components, Orai1 and STIM1, did not reduce Tg cytotoxicity, indicating that SOCE and Ca2+ entry are not critical for Tg-induced cell death. However, we observed a correlation between the abilities of Tg and Tg analogs to deplete ER Ca2+ stores and their detrimental effects on cell viability. Furthermore, caspase activation and cell death were associated with a sustained unfolded protein response. We conclude that ER Ca2+ drainage and sustained unfolded protein response activation are key for initiation of apoptosis at low concentrations of Tg and Tg analogs, whereas high cytosolic Ca2+ levels and SOCE are not required.

Keywords: apoptosis; calcium; endoplasmic reticulum (ER); stromal interaction molecule 1 (STIM1); unfolded protein response (UPR).


Conflict of interest statement

The authors declare that they have no conflicts of interest with the contents of this article

Figures

Figure 1.
Figure 1.
Constitutional formulae of Tg (A), EpoTg (B), and thapsigargin analogs in which the butanoyl group of thapsigargin at O-8 is substituted by 12-aminododecanoyl (8ADT; C) or the 12-amino group of 8ADT is blocked by Boc (Boc-8ADT; D) or terminates in Leu (Leu-8ADT; E) or βAsp (βAsp-8ADT; F).
Figure 2.
Figure 2.
Inhibitory effects of Tg and Tg analogs on SERCA activity and removal of Ca2+ from the Ca2E1 form of SERCA. A–C, inhibition of SERCA enzyme activity by Tg and Tg analogs. In A and C, activities were measured by sequential additions of Tg and Tg analogs in a titration type of experiment under conditions where a substantial fraction of the added inhibitors is bound to the ATPase due to their high affinity to SERCA (19). In A, the preincubation periods of inhibitor with SERCA before activity measurements were 3–6 min; in C, activities for Boc-8ADT were measured after 6, 33, 180, and 1440 min but otherwise following the same protocol as in A. B shows data for EpoTg, where in contrast to the O-8–substituted analogs a residual activity of 10 ± 1% persists at high (0.2–2 μm) concentrations. Note that, under these conditions in the presence of excess molar EpoTg, activities could be measured without recognizable error by direct addition to the enzymatic assay buffer. D–F, effects of addition of Tg and Tg analogs on the binding of Ca2+ to SERCA as a function of time. The experiments were conducted with SERCA at a protein concentration of 0.1 mg/ml in medium containing 50 mm MOPS (pH 7.2), 100 mm KCl, 5 mm Mg2+, and 0.05 mm Ca2+ with labeled 45Ca2+. Changes in Ca2+ binding were measured using double layers of Millipore filters after addition of 12 μm Tg, Leu-8ADT, βAsp-8ADT, Boc-8ADT, or EpoTg. D demonstrates the rapid Ca2+ release induced by Tg, βAsp-8ADT, or Leu-8ADT. E shows semilog plots of the changes in Ca2+ binding after addition of Tg, βAsp-8ADT, or Leu-8ADT. F shows data for Boc-8ADT and EpoTg measured over a period of 24 h. The experiments in each group comprise three to four experiments depicted in both non-logarithmic and semilog plots. Error bars of the non-logarithmic plots indicate S.D., the variability observed among individual experiments, whereas the curvature of the semilog data serves as an indicator of the rapid to slow kinetic transition as a function of time that in Table 1 is analyzed in terms of a biphasic reaction scheme.
Figure 3.
Figure 3.
Effect of EpoTg on Ca2+ transport by SR vesicles as compared with that of Tg and O-8–substituted Tg analogs. SR vesicles (0.05 mg of protein/ml) were incubated at 23 ± 0.2 °C with medium containing 50 mm MOPS (pH 7.2), 100 mm KCl, and 5 mm Mg2+ together with 0.02 mm 45Ca2+ and 0.1 mm EGTA buffer (with a pCa of ∼6 to approach the low Ca2+ concentration inside a cell) in the absence (DMSO control) or presence of SERCA inhibitor as indicated. The reaction was started after 5 min (A) or 24 h (B) by addition of 0.08 mm MgATP to samples preincubated with no inhibitor (inverted filled triangles), 1 μm EpoTg (upright filled triangles), 5 μm EpoTg (light gray circles), 10 μm EpoTg (black circles), 1 μm Tg (black squares), 1 μm Leu-8ADT (inverted empty triangles), 1 μm βAsp-8ADT (black diamonds), or 1 μm Boc-8ADT (empty circles). Ca2+ accumulation by the vesicles was measured after timed intervals on 0.2-ml aliquots by addition of 4 ml of ice-cold incubation buffer and subsequent Millipore filtration. The plots represent the means of three to four experiments with S.D. error bars shown whenever appropriate, i.e. when the S.D. is of a greater magnitude than the size of the symbols.
Figure 4.
Figure 4.
Dose-dependent cell death induction by Tg and Tg analogs in LNCaP, PC3, and MCF7 cells. LNCaP (A), PC3 (B), or MCF7 (C) cells were seeded in 96-well plates and incubated for 2 days. Subsequently, the cells were treated with 0.1% DMSO control or the indicated concentrations (in nm) of Tg, Boc-8ADT, βAsp-8ADT, Leu-8ADT, or EpoTg together with 2.5 μg/ml propidium iodide in complete medium. Cell death was assessed using an Incucyte instrument for automated live-cell imaging and calculation of red fluorescence and total cell confluence. Cell death is plotted as the ratio of red fluorescence to total cell confluence after 60 (A) or 72 h (B and C) normalized to the highest cell death level obtained with Tg. LD50(Tgmax) values, defined as the Tg/Tg analog concentration required to obtain 50% of the maximal Tg response, are indicated below the x axis denominators. Data are means ± S.E. from four (LNCaP and MCF7) or five (PC3) independent experiments with error bars representing S.E. Single points represent individual measurements (mean values from triplicate wells), and each experiment is indicated with differently colored points. Red asterisks, paired Student's t test compared with DMSO control to indicate the lowest concentration of Tg/Tg analog that significantly increases cell death. Paired Student's t tests comparing each subsequent stepwise increase in Tg/Tg analog concentration are indicated with black bars between each compared condition and with black asterisks to indicate significance levels. *, p < 0.05; **, p < 0.01; ***, p < 0.001; ns, not significant (i.e. p ≥ 0.05).
Figure 5.
Figure 5.
Effect of Tg and Tg analogs on the release of Ca2+ from the ER to the cytosol of prostate cancer cells. PC3 (left panels) and LNCaP cells (right panels) were seeded in polylysine-coated plates and loaded with Fluo-4-AM in Ca2+-containing HBS medium before being exposed to 1 μm concentrations of Tg, EpoTg, βAsp-8ADT, Leu-8ADT, Boc-8ADT, or DMSO control (0.1%) solubilized in a nominally Ca2+-free HBS containing 1 mm EGTA. Fluorescence traces were recorded at 535 nm after excitation of the cells at 488 nm. The result from one representative experiment of five (PC3) or three (LNCaP) independent experiments is shown (see also supplemental Table S1 for a quantitative comparison of the effects of EpoTg, βAsp-8ADT, and Leu-8ADT relative to Tg).
Figure 6.
Figure 6.
ER Ca2+ depletion of PC3 cells after preincubation with Tg or Tg analogs. PC3 cells were seeded in standard growth medium and exposed for 24 h to 0.1 μm or 1 μm concentrations of Tg or Tg analogs as indicated prior to loading with Fluo-4-AM. Thereafter, the medium was switched to 1 mm EGTA in HBS and supplemented after 10 min with 1 μm Tg (indicated by arrows) to release any Ca2+ remaining in the Tg-sensitive Ca2+ stores in the cell. Note that ER (i.e. Tg-sensitive) Ca2+ release could only be observed from the 0.1 μm EpoTg-pretreated cells and from the DMSO control cells that had not been pretreated with inhibitor. One representative experiment of four is shown. In these four experiments, the amplitudes related to the Ca2+ eluted with the Tg purge in the 0.1 μm EpoTg-pretreated cells varied from 30 to 55% of that eluted with Tg from the DMSO control cells.
Figure 7.
Figure 7.
Changes in the cytosolic Ca2+ concentration of LNCaP and PC3 cells induced by treatment with Tg and Tg analogs. Left and right panels, changes in the cytosolic level of Ca2+ arising from short-term incubation (0–3 h) (left panels) or after 24-, 48-, and 72-h (right panels) incubation of cells loaded with Fura-2-AM and exposed to 0.1 μm Tg or O-8–substituted Tg analogs or to 0.1 or 1 μm EpoTg as indicated by changes in the fluorescence emission ratios after alternating excitation of the cells loaded with Fura-2-AM at 355 and 380 nm. The data are means ± S.D. of five experiments with error bars representing S.D.
Figure 8.
Figure 8.
SOCE is not required for Tg-induced cell death. A–C, LNCaP (A), PC3 (B), or MCF7 (C) cells were seeded in 96-well plates, reverse transfected with 10 nm non-targeting control siRNA (“siControl”) or siRNAs targeting Orai1 (siOrai1) or STIM1 (siSTIM1), and incubated for 2 days. Subsequently, the cells were treated with DMSO vehicle control (0.1%) or the indicated concentrations of Tg together with 2.5 μg/ml propidium iodide in complete medium. Cell death was assessed using an Incucyte instrument for automated live-cell imaging and calculation of red fluorescence and total cell confluence. Cell death is plotted as the ratio of red fluorescence to total cell confluence after 48 h, normalized to that obtained with Tg in siControl-transfected cells. Data are means ± S.E. from three independent experiments. Single symbols represent individual measurements for each cell line (each symbol represents the mean value from triplicate wells), and each experiment is indicated by differently shaped symbols. *, p < 0.05; ns, not significant (i.e. p ≥ 0.05), paired Student's t test compared with Tg/siControl. D–F, in parallel with the transfection in A–C, LNCaP (D), PC3 (E), or MCF7 (F) cells were transfected with the same RNAi mixture in 6-well plates. After 2 days of transfection and 48 h of treatment with Tg, the cells were harvested and extracted for RNA to confirm the knockdown of Orai1 and STIM1. The mRNA levels were assessed by real-time RT-PCR. Relative levels normalized to that found with DMSO in siControl-transfected cells are shown. Data are means ± S.E. from three independent experiments with error bars representing S.E. Single symbols represent individual values for each cell line (each symbol represents the mean value from triplicate measurements), and each experiment is indicated by differently shaped symbols. *, p < 0.05; **, p < 0.01; ***, p < 0.001; ns, not significant (i.e. p ≥ 0.05), paired Student's t test compared with Tg/siControl.
Figure 9.
Figure 9.
Only toxic concentrations of Tg and Tg analogs induce a sustained UPR. LNCaP (A) or PC3 (B) cells were seeded in 6-well plates and grown for 2 days upon which they were treated for four different time points (as indicated) with toxic concentrations of Tg or Boc-8ADT (100 nm in LNCaP and 30 nm in PC3) or with low/subtoxic concentrations of βAsp-8ADT (100 nm in LNCaP and 10 nm in PC3), Leu-8ADT (100 nm in LNCaP and 2 nm in PC3), or EpoTg (1 μm in LNCaP and 150 nm in PC3). Protein lysates were prepared and analyzed by immunoblotting to assess the expression levels of the indicated proteins (ATF4, CHOP, Grp94, and BiP as UPR indicators and cleaved PARP as a marker for caspase activity). GAPDH and tubulin were used as loading controls. The dotted lines are inserted for visual aid only (i.e. the membranes were not spliced). One representative experiment of three independent experiments is shown for each cell line. The positions of molecular mass markers are indicated to the left of the blots. C, PC3 cells were seeded in 96-well plates and incubated for 2 days. Subsequently, the cells were treated with DMSO control or the indicated concentrations of Tg, Boc-8ADT, βAsp-8ADT, Leu-8ADT, or EpoTg together with 2.5 μg/ml propidium iodide in complete medium. Cell death was assessed using an Incucyte instrument for automated live-cell imaging and calculation of red fluorescence and total cell confluence. Cell death is plotted as the ratio of red fluorescence to total cell confluence after 48 h, normalized to that obtained with Tg. Data are means ± S.E. from three independent experiments with error bars representing S.E. Single symbols represent individual measurements (each symbol represents the mean value from triplicate wells), and each experiment is indicated by differently shaped symbols. *, p < 0.05; **, p < 0.01; ***, p < 0.001; ns, not significant (i.e. p ≥ 0.05), paired Student's t test compared with DMSO control.

Similar articles

Cited by

References

    1. Carafoli E. (2002) Calcium signaling: a tale for all seasons. Proc. Natl. Acad. Sci. U.S.A. 99, 1115–1122 - PMC - PubMed
    1. Schwarze S. R., Lin E. W., Christian P. A., Gayheart D. T., and Kyprianou N. (2008) Intracellular death platform steps-in: targeting prostate tumors via endoplasmic reticulum (ER) apoptosis. Prostate 68, 1615–1623 - PMC - PubMed
    1. Wang M., and Kaufman R. J. (2014) The impact of the endoplasmic reticulum protein-folding environment on cancer development. Nat. Rev. Cancer 14, 581–597 - PubMed
    1. Lee J., and Ozcan U. (2014) Unfolded protein response signaling and metabolic diseases. J. Biol. Chem. 289, 1203–1211 - PMC - PubMed
    1. Lu M., Lawrence D. A., Marsters S., Acosta-Alvear D., Kimmig P., Mendez A. S., Paton A. W., Paton J. C., Walter P., and Ashkenazi A. (2014) Opposing unfolded-protein-response signals converge on death receptor 5 to control apoptosis. Science 345, 98–101 - PMC - PubMed

Publication types

MeSH terms