

A lower isoelectric point increases signal sequence-mediated secretion of recombinant proteins through a bacterial ABC transporter
- PMID: 28972172
- PMCID: PMC5712618
- DOI: 10.1074/jbc.M117.786749
A lower isoelectric point increases signal sequence-mediated secretion of recombinant proteins through a bacterial ABC transporter
Abstract
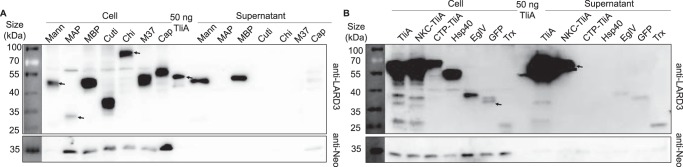
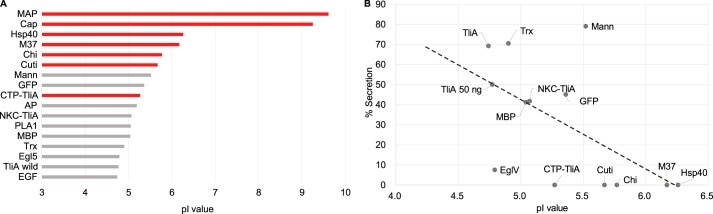
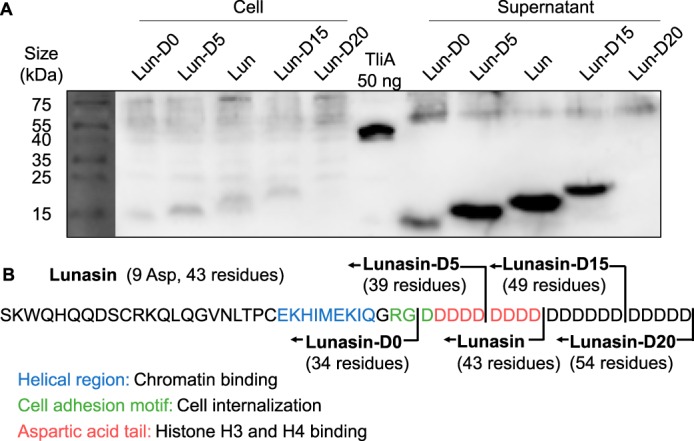
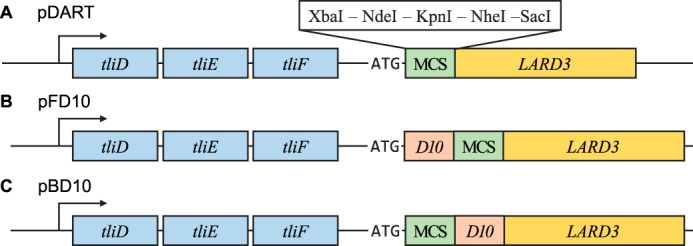
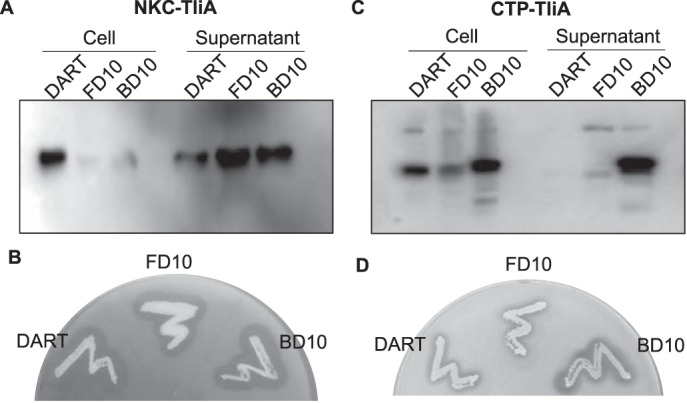
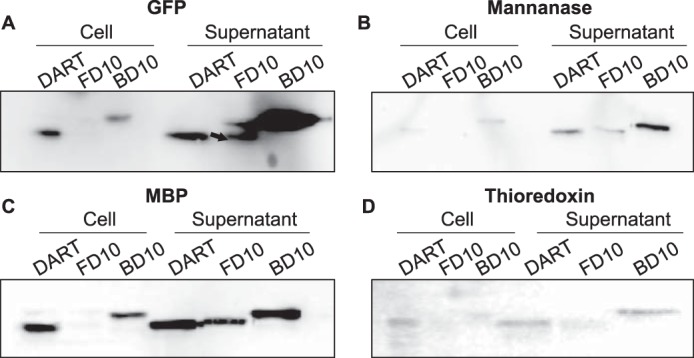
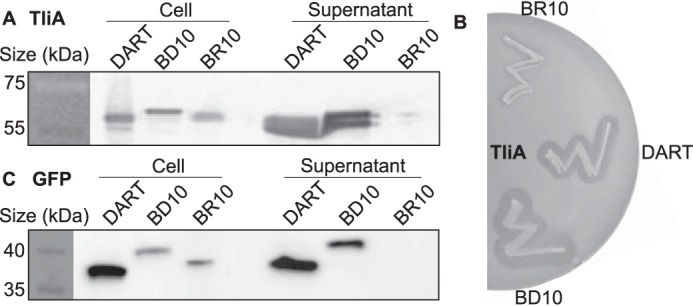
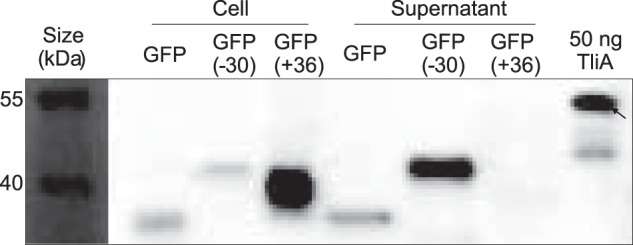
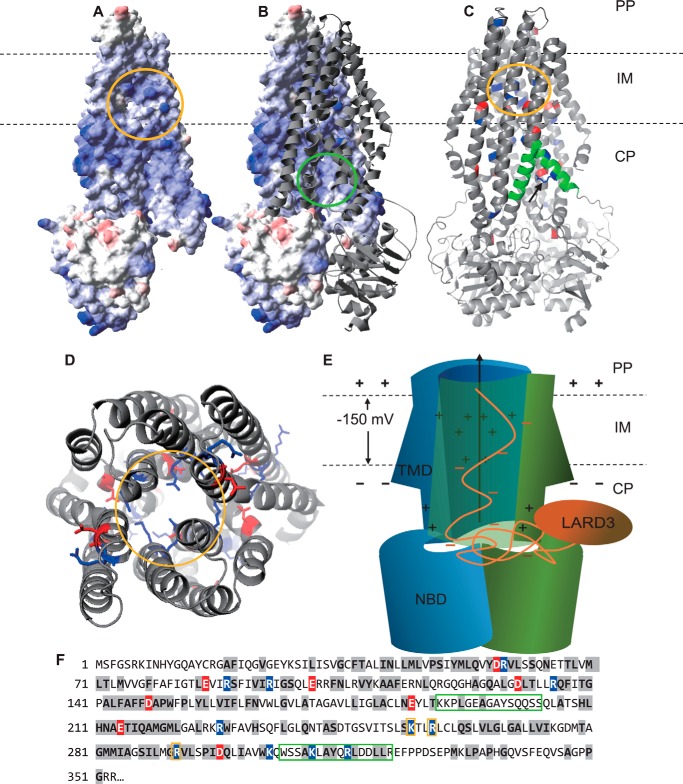
Efficient protein production for industrial and academic purposes often involves engineering microorganisms to produce and secrete target proteins into the culture. Pseudomonas fluorescens has a TliDEF ATP-binding cassette transporter, a type I secretion system, which recognizes C-terminal LARD3 signal sequence of thermostable lipase TliA. Many proteins are secreted by TliDEF in vivo when recombined with LARD3, but there are still others that cannot be secreted by TliDEF even when LARD3 is attached. However, the factors that determine whether or not a recombinant protein can be secreted through TliDEF are still unknown. Here, we recombined LARD3 with several proteins and examined their secretion through TliDEF. We found that the proteins secreted via LARD3 are highly negatively charged with highly-acidic isoelectric points (pI) lower than 5.5. Attaching oligo-aspartate to lower the pI of negatively-charged recombinant proteins improved their secretion, and attaching oligo-arginine to negatively-charged proteins blocked their secretion by LARD3. In addition, negatively supercharged green fluorescent protein (GFP) showed improved secretion, whereas positively supercharged GFP did not secrete. These results disclosed that proteins' acidic pI and net negative charge are major factors that determine their secretion through TliDEF. Homology modeling for TliDEF revealed that TliD dimer forms evolutionarily-conserved positively-charged clusters in its pore and substrate entrance site, which also partially explains the pI dependence of the TliDEF-dependent secretions. In conclusion, lowering the isoelectric point improved LARD3-mediated protein secretion, both widening the range of protein targets for efficient production via secretion and signifying an important aspect of ABC transporter-mediated secretions.
Keywords: ABC transporter; isoelectric point; membrane potential; membrane transport; protein secretion; protein translocation; recombinant protein expression.
© 2017 by The American Society for Biochemistry and Molecular Biology, Inc.
Conflict of interest statement
The authors declare that they have no conflicts of interest with the contents of this article
Figures
Similar articles
-
Alleviation of temperature-sensitive secretion defect of Pseudomonas fluorescens ATP-binding cassette (ABC) transporter, TliDEF, by a change of single amino acid in the ABC protein, TliD.J Biosci Bioeng. 2016 Sep;122(3):283-6. doi: 10.1016/j.jbiosc.2016.02.013. Epub 2016 Mar 29. J Biosci Bioeng. 2016. PMID: 27033673
-
Identification of the minimal region in lipase ABC transporter recognition domain of Pseudomonas fluorescens for secretion and fluorescence of green fluorescent protein.Microb Cell Fact. 2012 May 11;11:60. doi: 10.1186/1475-2859-11-60. Microb Cell Fact. 2012. PMID: 22578275 Free PMC article.
-
Identification of the tliDEF ABC transporter specific for lipase in Pseudomonas fluorescens SIK W1.J Bacteriol. 1999 Mar;181(6):1847-52. doi: 10.1128/JB.181.6.1847-1852.1999. J Bacteriol. 1999. PMID: 10074078 Free PMC article.
-
Protein secretion by Gram-negative bacterial ABC exporters--a review.Gene. 1997 Jun 11;192(1):7-11. doi: 10.1016/s0378-1119(96)00829-3. Gene. 1997. PMID: 9224868 Review.
-
Protein secretion by gram-negative bacterial ABC exporters.Folia Microbiol (Praha). 1997;42(3):179-83. doi: 10.1007/BF02818975. Folia Microbiol (Praha). 1997. PMID: 9246759 Review.
Cited by
-
PySupercharge: a python algorithm for enabling ABC transporter bacterial secretion of all proteins through amino acid mutation.Microb Cell Fact. 2024 Apr 20;23(1):115. doi: 10.1186/s12934-024-02342-z. Microb Cell Fact. 2024. PMID: 38643109 Free PMC article.
-
Emerging Landscape of Supercharged Proteins and Peptides for Drug Delivery.ACS Pharmacol Transl Sci. 2024 Feb 21;7(3):614-629. doi: 10.1021/acsptsci.3c00397. eCollection 2024 Mar 8. ACS Pharmacol Transl Sci. 2024. PMID: 38481692 Free PMC article. Review.
-
SHTXTHHly, an extracellular secretion platform for the preparation of bioactive peptides and proteins in Escherichia coli.Microb Cell Fact. 2022 Jun 27;21(1):128. doi: 10.1186/s12934-022-01856-8. Microb Cell Fact. 2022. PMID: 35761329 Free PMC article.
-
A molecular toolkit for heterologous protein secretion across Bacteroides species.Nat Commun. 2024 Nov 11;15(1):9741. doi: 10.1038/s41467-024-53845-7. Nat Commun. 2024. PMID: 39528443 Free PMC article.
-
A molecular toolkit for heterologous protein secretion across Bacteroides species.bioRxiv [Preprint]. 2023 Dec 15:2023.12.14.571725. doi: 10.1101/2023.12.14.571725. bioRxiv. 2023. Update in: Nat Commun. 2024 Nov 11;15(1):9741. doi: 10.1038/s41467-024-53845-7. PMID: 38168418 Free PMC article. Updated. Preprint.
References
-
- Wurm F. M. (2004) Production of recombinant protein therapeutics in cultivated mammalian cells. Nat. Biotechnol. 22, 1393–1398 - PubMed
-
- Demain A. L., and Vaishnav P. (2009) Production of recombinant proteins by microbes and higher organisms. Biotechnol. Adv. 27, 297–306 - PubMed
-
- Vlieghe P., Lisowski V., Martinez J., and Khrestchatisky M. (2010) Synthetic therapeutic peptides: science and market. Drug Discov. Today 15, 40–56 - PubMed
-
- Huang C.-J., Lin H., and Yang X. (2012) Industrial production of recombinant therapeutics in Escherichia coli and its recent advancements. J. Ind. Microbiol. Biotechnol. 39, 383–399 - PubMed
-
- Choi J. H., and Lee S. Y. (2004) Secretory and extracellular production of recombinant proteins using Escherichia coli. Appl. Microbiol. Biotechnol. 64, 625–635 - PubMed
MeSH terms
Substances
Associated data
- Actions
- Actions
- Actions
LinkOut - more resources
Full Text Sources
Other Literature Sources
Research Materials
Miscellaneous
