. 2017 Nov 24;292(47):19146-19159.
doi: 10.1074/jbc.M117.793760. Epub 2017 Sep 27.

NK3 homeobox 1 (NKX3.1) up-regulates forkhead box O1 expression in hepatocellular carcinoma and thereby suppresses tumor proliferation and invasion

Affiliations

NK3 homeobox 1 (NKX3.1) up-regulates forkhead box O1 expression in hepatocellular carcinoma and thereby suppresses tumor proliferation and invasion

Jingyi Jiang et al. J Biol Chem. .

Abstract

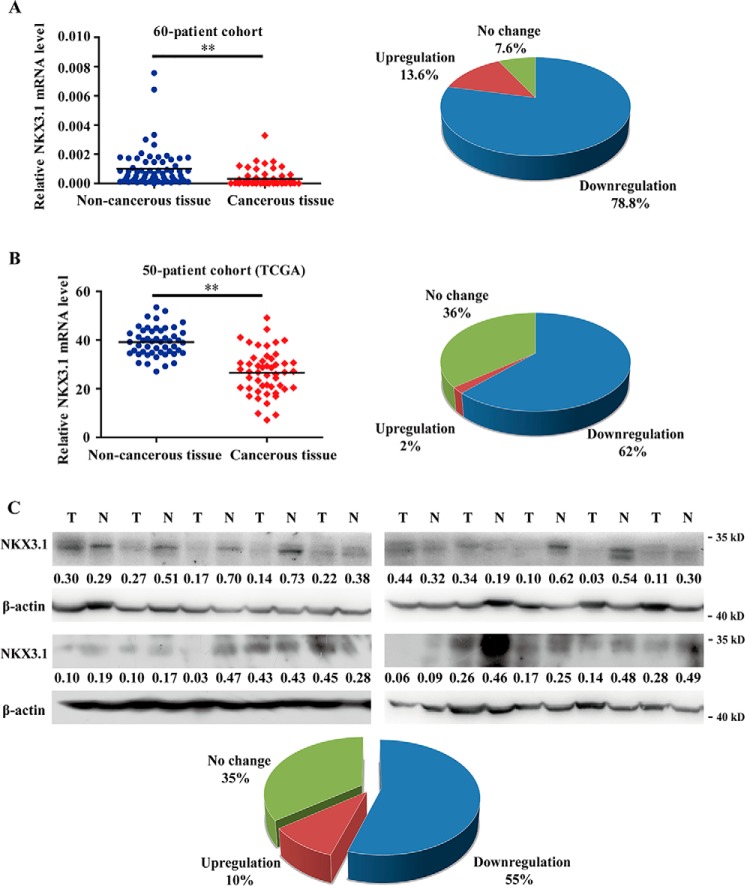
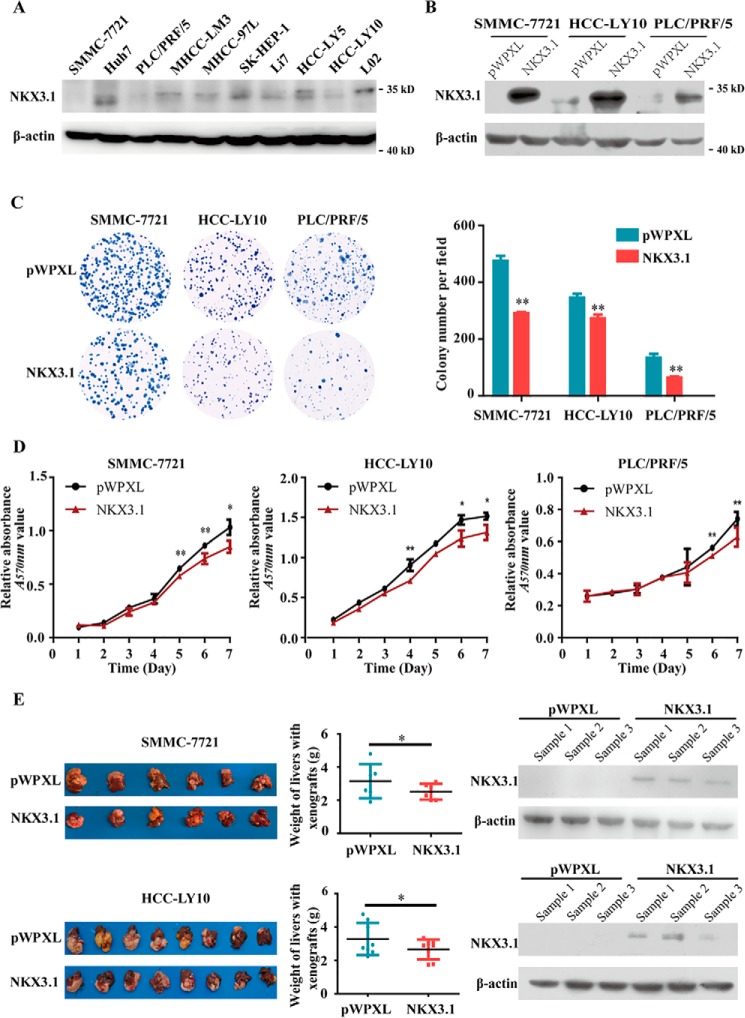
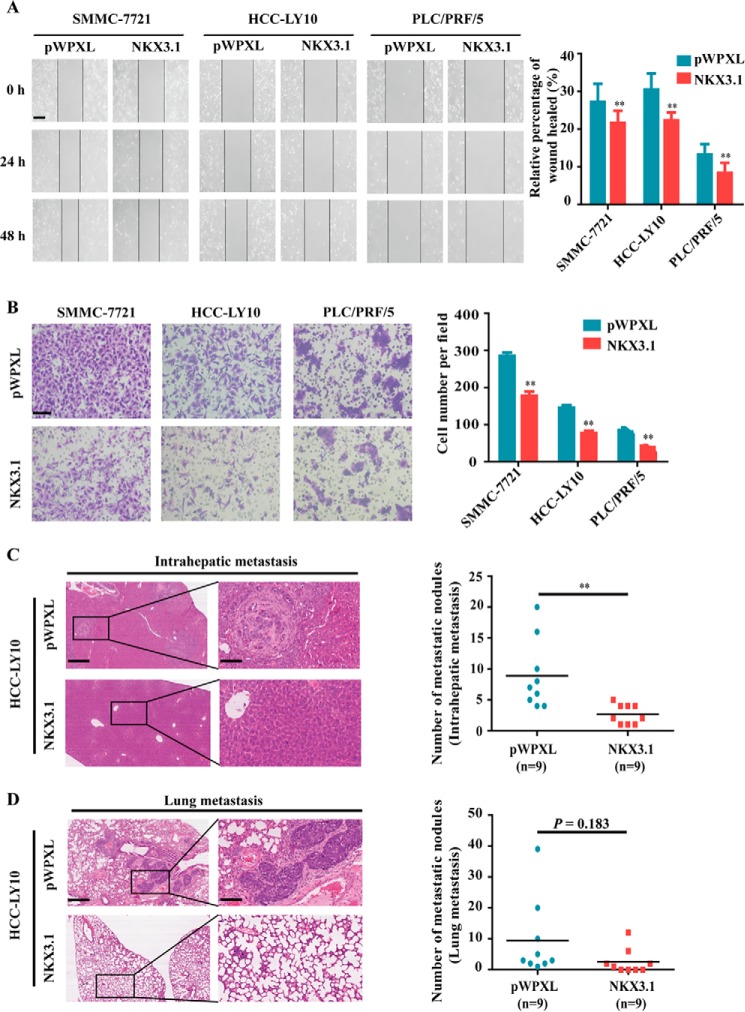
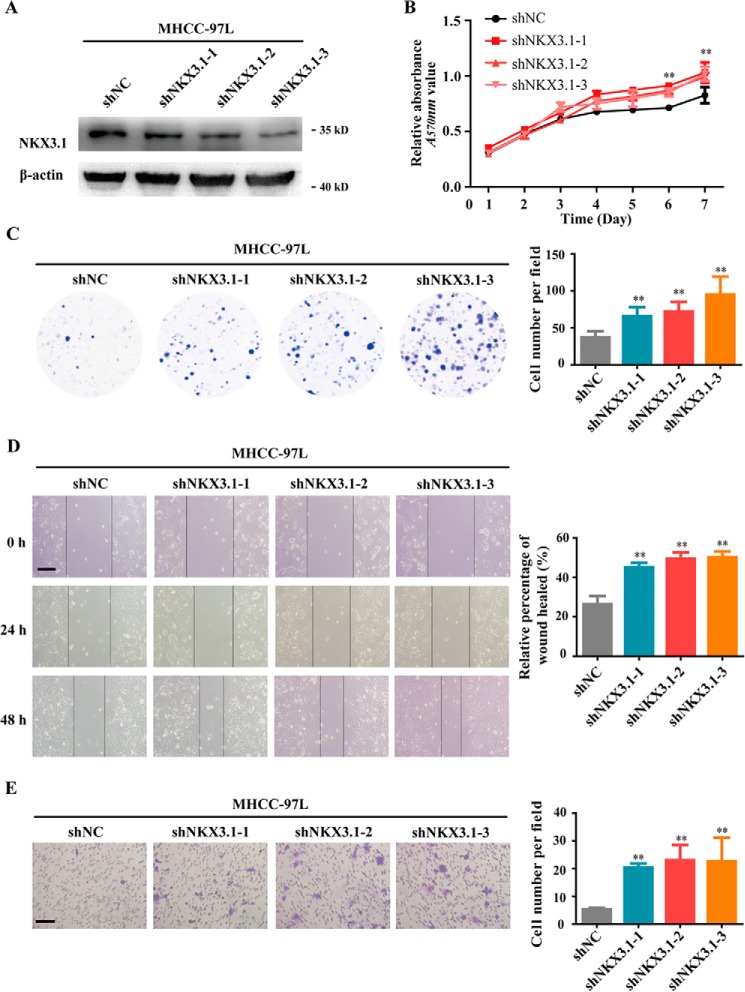
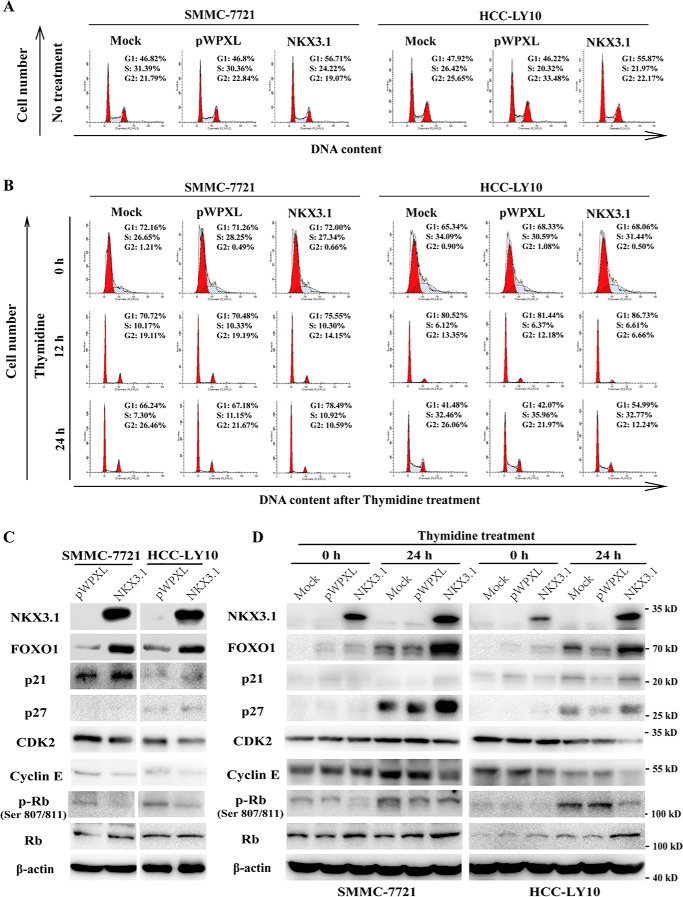
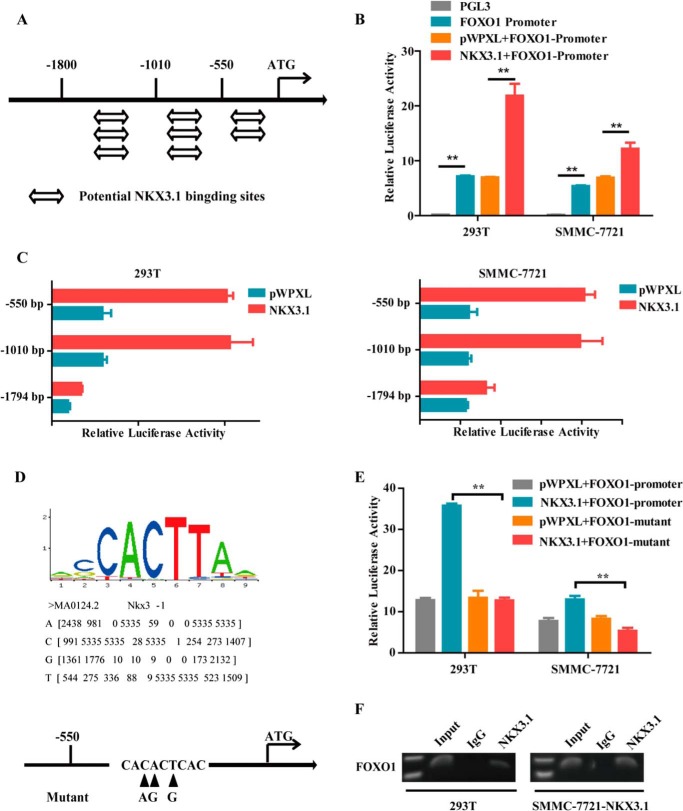
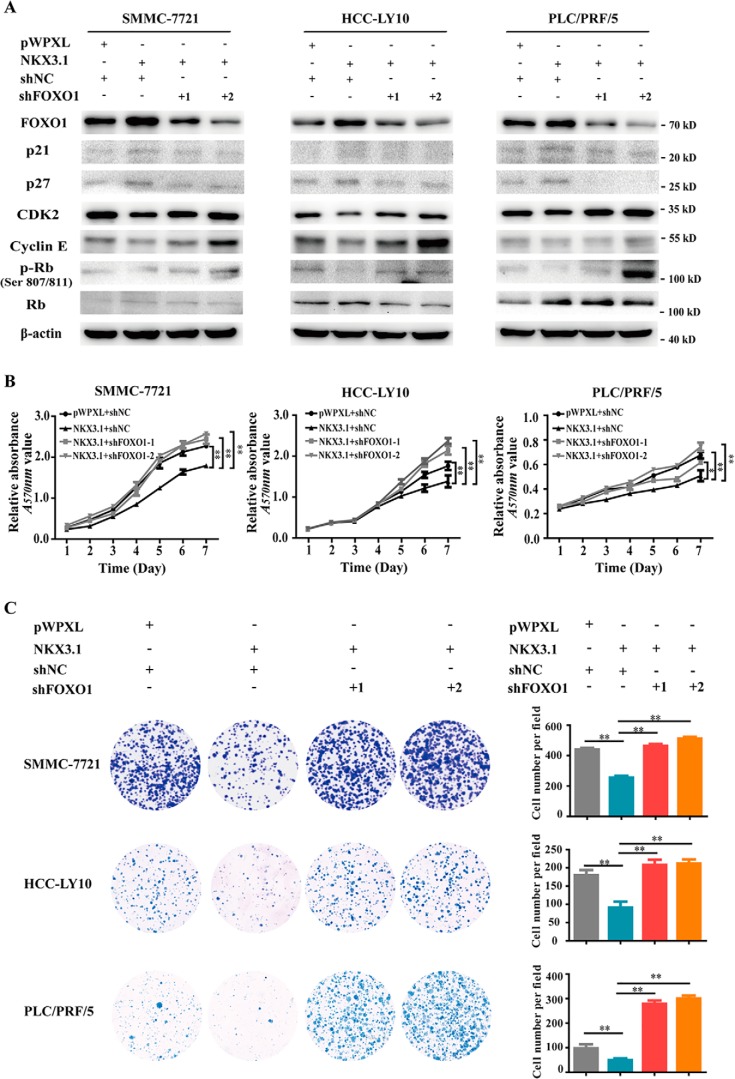
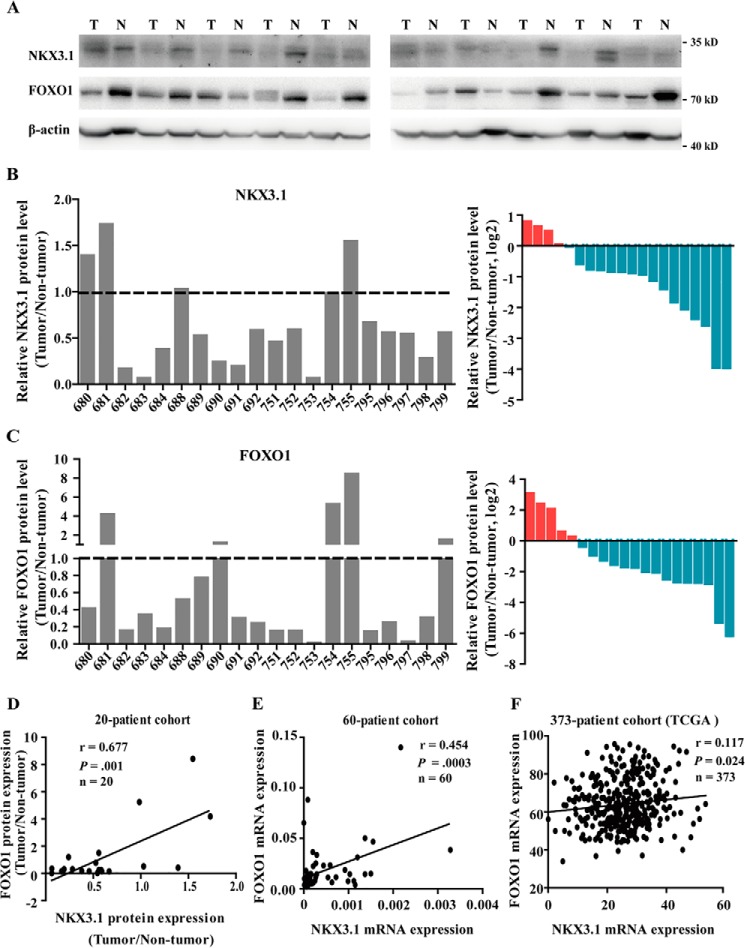
Hepatocellular carcinoma (HCC) is the leading cause of cancer-related mortality in China, and the molecular mechanism of uncontrolled HCC progression remains to be explored. NK3 homeobox 1 (NKX3.1), an androgen-regulated prostate-specific transcription factor, suppresses tumors in prostate cancer, but its role in HCC is unknown, especially in hepatocellular carcinoma. In the present study, the differential expression analyses in HCC tissues and matched adjacent noncancerous liver tissues revealed that NKX3.1 is frequently down-regulated in human primary HCC tissues compared with matched adjacent noncancerous liver tissues. We also noted that NKX3.1 significantly inhibits proliferation and mobility of HCC cells both in vitro and in vivo Furthermore, NKX3.1 overexpression resulted in cell cycle arrest at the G1/S phase via direct binding to the promoter of forkhead box O1 (FOXO1) and up-regulation of expression. Of note, FOXO1 silencing in NKX3.1-overexpressing cells reversed the inhibitory effects of NKX3.1 on HCC cell proliferation and invasion. Consistently, both FOXO1 and NKX3.1 were down-regulated in human HCC tissues, and their expression was significantly and positively correlated with each other. These results suggest that NKX3.1 functions as a tumor suppressor in HCC cells through directly up-regulating FOXO1 expression.

Keywords: FOXO; NK3 Homeobox 1; cell proliferation; hepatocellular carcinoma; metastasis; tumor suppressor gene.


Conflict of interest statement

The authors declare that they have no conflicts of interest with the contents of this article

Figures

Figure 1.
Figure 1.
NKX3.1 was down-regulated in human primary HCC tissues. A, qRT-PCR was performed to detect NKX3.1 mRNA expression in human primary HCC tissues and matched adjacent noncancerous liver tissues (n = 60, left panel). The pie chart represents the change of NKX3.1 mRNA levels in HCC samples that exhibited up-regulation, no change, and down-regulation (right panel). B, mRNA levels of NKX3.1 in HCC tissues and matched adjacent noncancerous liver tissues from TCGA cohort (n = 50, left panel). The pie chart represents the change in NKX3.1 levels in HCC tissues that exhibited up-regulation, no change, and down-regulation (right panel). C, NKX3.1 protein levels in human primary HCC tissues (T) and the corresponding adjacent non-cancerous liver tissues (N). β-Actin was used as a loading control (n = 20). The protein expression levels were quantified by densitometry and calculated as the ratio of the interest protein to its loading control with ImageJ software. The pie chart represents the change in NKX3.1 protein levels in HCC tissues that exhibited up-regulation, no change, and down-regulation. **, p < 0.01.
Figure 2.
Figure 2.
Overexpression of NKX3.1 inhibits HCC cell proliferation and tumorigenicity in vitro and in vivo. A, Western blot analysis of NKX3.1 expression in HCC cell lines and immortalized normal hepatocyte L02. B, Western blot analysis of NKX3.1 protein in SMMC-7721, HCC-LY10, and PLC/PRF/5 cells stably transfected with NKX3.1 or control (pWPXL) vectors. C, overexpression of NKX3.1 inhibited the colony formation ability of HCC cells. The bar graph showed quantitative analysis data with three replicates. D, NKX3.1 inhibited the proliferation of HCC cells by MTT assay. E, liver tissues collected from NOD/SCID mice with tumor xenografts inoculated with SMMC-7721 (top panel) and HCC-LY10 (bottom panel) cell lines stably overexpressing NKX3.1, the livers with xenografts were weighted (left and middle panel). The NKX3.1 protein level was detected by Western blot in tissue samples of xenografts (right panel). β-Actin was used as a loading control. *, p < 0.05; **, p < 0.01.
Figure 3.
Figure 3.
Overexpression of NKX3.1 suppresses HCC cell mobility in vitro and metastasis in vivo. A, overexpression of NKX3.1 suppressed HCC cell migration in vitro by wound healing assay. Original magnification: ×100; scale bar, 200 μm. The bar graph shows quantitative analysis data with three replicates. B, overexpression of NKX3.1 suppressed HCC cell invasion in vitro. Original magnification: ×200; scale bar, 100 μm. The bar graph shows quantitative analysis data with three replicates. C, left panel showed the representative images of intrahepatic metastatic nodules formed by HCC-LY10 cells transfected with NKX3.1 or the control (original magnification: left images, ×40, scale bar, 500 μm; right images, ×200, scale bar, 100 μm). The numbers of intrahepatic metastatic nodules were presented in the right panel (n = 9). D, left panel showed representative images of lung metastatic nodules formed by the same cells in C. Original magnification: left images, ×40, and scale bar, 500 μm; right images, ×200, scale bar, 100 μm. The right panel presents the numbers of lung metastatic nodules (n = 9). **, p < 0.01.
Figure 4.
Figure 4.
Knockdown of NKX3.1 promotes HCC cell proliferation and mobility in vitro. A, Western blot analysis of NKX3.1 protein in MHCC-97L cell stably transfected with shNKX3.1 or negative control (shNC) vectors. B, knockdown of NKX3.1 promoted the proliferation of MHCC-97L cell by MTT assay. C, knockdown of NKX3.1 increased the colony formation ability of HCC cell. The bar graph shows quantitative analysis data with three replicates. D, knockdown of NKX3.1 increased HCC cell migration in vitro by wound-healing assay. Original magnification: ×100; scale bar, 200 μm. The bar graph shows the quantitative analysis data with three replicates. E, knockdown of NKX3.1 promoted HCC cell invasion in vitro. Original magnification: ×200; scale bar, 100 μm. The bar graph shows the quantitative analysis data with three replicates. **, p < 0.01.
Figure 5.
Figure 5.
Overexpression of NKX3.1 induces cell cycle arrest at the G1/S phase through up-regulation of FOXO1. A, the cell cycle distribution of SMMC-7721 and HCC-LY10 cells without transfection (Mock) and those that were transfected with NKX3.1 or control (pWPXL) vectors. B, the cell cycle distribution of SMMC-7721 and HCC-LY10 cells (Mock/pWPXL/NKX3.1) collected at 0, 12, and 24 h after synchronizing with 2 mm thymidine. C, Western blot analysis of FOXO1, P21, P27, CDK2, Cyclin E, RB, phospho-RB (Ser-807/811) in NKX3.1-overexpressing SMMC-7721 and HCC-LY10 cells. D, Western blot analysis of the expressions of FOXO1, P21, P27, CDK2, Cyclin E, RB, phospho-Rb (Ser-807/811) in SMMC-7721 and HCC-LY10 cells (Mock/pWPXL/NKX3.1) collected at 0 and 24 h after synchronizing with 2 mm thymidine. β-Actin was used as a loading control.
Figure 6.
Figure 6.
NKX3.1 up-regulates FOXO1 expression through directly binding to FOXO1 promoter. A, potential NKX3.1-binding sites in the FOXO1 promoter identified with the JASPAR database (http://jaspar.genereg.net/).4 B, relative activities of the FOXO1 promoter after transfection of NKX3.1 and pWPXL into HEK 293T and SMMC-7721 cells analyzed by luciferase assay. C, relative activities of FOXO1 promoter deletion mutants in HEK 293T and SMMC-7721 cells by luciferase assay. D, the top panel is the sequence logo of NKX3.1 potential binding site in JASPAR (http://jaspar.genereg.net/).4 The bottom panel is the diagram of mutant sites in the FOXO1 promoter. E, relative activities of the FOXO1 promoter and the mutant promoter after transfection of NKX3.1 and pWPXL. Data are mean ± S.D. from experiments with three replicates. **, p < 0.01. F, binding of NKX3.1 to the FOXO1 promoter was performed by ChIP using the antibody against NKX3.1 and negative control (IgG) in 293T and NKX3.1-overexpressing SMMC-7721 cells.
Figure 7.
Figure 7.
Knockdown of FOXO1 after NKX3.1 overexpression rescues NKX3.1-induced suppressive effect of HCC cells. A, Western blot analysis of expression levels of FOXO1 and cell cycle-related proteins shown in Fig. 4 in NKX3.1-overexpressing HCC cells after knockdown of FOXO1. β-Actin was used as a loading control. B, knockdown of FOXO1 reversed the inhibitory effect of NKX3.1 on cell proliferation in vitro by MTT assay. C, knockdown of FOXO1 reversed the inhibitory effect of NKX3.1 on cell colony formation in vitro. Data are mean ± S.D. from experiments with three replicates. *, p < 0.05; **, p < 0.01.
Figure 8.
Figure 8.
Positive correlation between FOXO1 and NKX3.1 expression in human HCC tissues. A, representative images of NKX3.1 and FOXO1 protein levels in human HCC tissues (T) and the corresponding adjacent non-cancerous liver tissues (N). β-Actin was used as a loading control. Images were taken from Fig. 1C and supplemental Fig. S4C. B and C, the fold-change of NKX3.1 (B) and FOXO1 (C) protein levels in 20 paired HCC/non-cancerous liver tissues. Data were normalized to β-actin and presented as log2 fold-change. Red bar in the waterfall plot represents a patient with a higher expression of NKX3.1 or FOXO1 in HCC tissues than paired non-cancerous liver tissue; the gray bar represents a patient with a lower expression of NKX3.1 or FOXO1 in HCC tissues than paired non-cancerous liver tissue. D, the correlation between NKX3.1 and FOXO1 protein levels in 20 paired HCC/non-cancerous liver tissues. E and F, the correlation between NKX3.1 and FOXO1 mRNA levels in HCC tissues of 60 patients (E) and 373 patient TCGA cohort (F). The Pearson correlation coefficients (r) and p value were indicated.

Similar articles

Cited by

References

    1. Siegel R. L., Miller K. D., and Jemal A. (2017) Cancer statistics, 2017. CA Cancer J. Clin. 67, 7–30 - PubMed
    1. Critelli R. M., De Maria N., and Villa E. (2015) Biology of hepatocellular carcinoma. Dig. Dis. 33, 635–641 - PubMed
    1. Ferlay J., Soerjomataram I., Dikshit R., Eser S., Mathers C., Rebelo M., Parkin D. M., Forman D., and Bray F. (2015) Cancer incidence and mortality worldwide: sources, methods and major patterns in GLOBOCAN 2012. Int. J. Cancer 136, E359–E386 - PubMed
    1. Taylor B. S., Schultz N., Hieronymus H., Gopalan A., Xiao Y., Carver B. S., Arora V. K., Kaushik P., Cerami E., Reva B., Antipin Y., Mitsiades N., Landers T., Dolgalev I., Major J. E., et al. (2010) Integrative genomic profiling of human prostate cancer. Cancer Cell 18, 11–22 - PMC - PubMed
    1. Kang J. (2015) Genomic alterations on 8p21-p23 are the most frequent genetic events in stage I squamous cell carcinoma of the lung. Exp. Ther. Med. 9, 345–350 - PMC - PubMed

Publication types

MeSH terms