. 2017 Dec 1;292(48):19674-19692.
doi: 10.1074/jbc.M117.795591. Epub 2017 Sep 27.

The hnRNP RALY regulates transcription and cell proliferation by modulating the expression of specific factors including the proliferation marker E2F1

Affiliations

The hnRNP RALY regulates transcription and cell proliferation by modulating the expression of specific factors including the proliferation marker E2F1

Nicola Cornella et al. J Biol Chem. .

Abstract

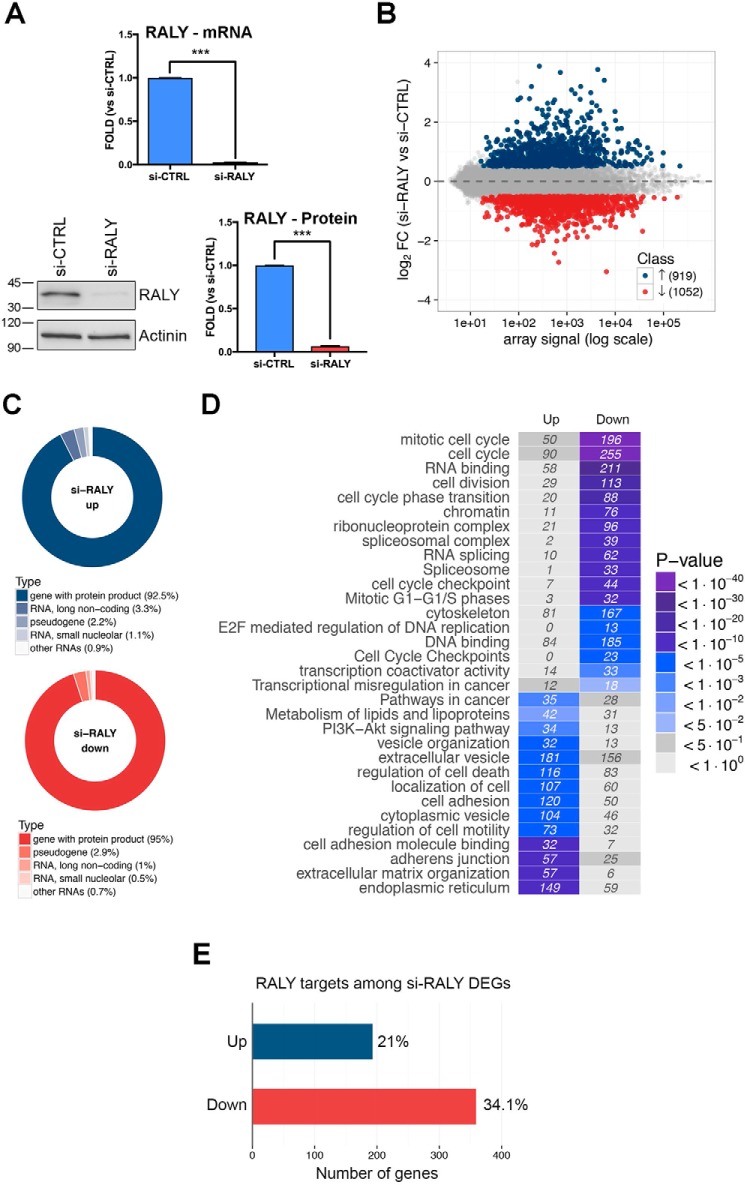
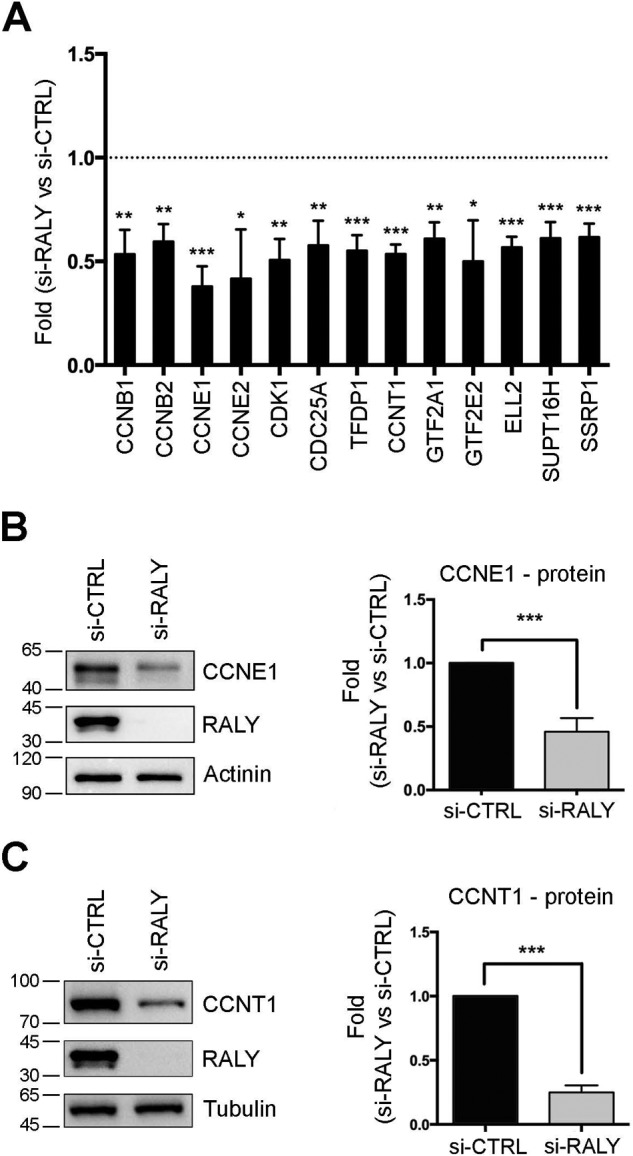
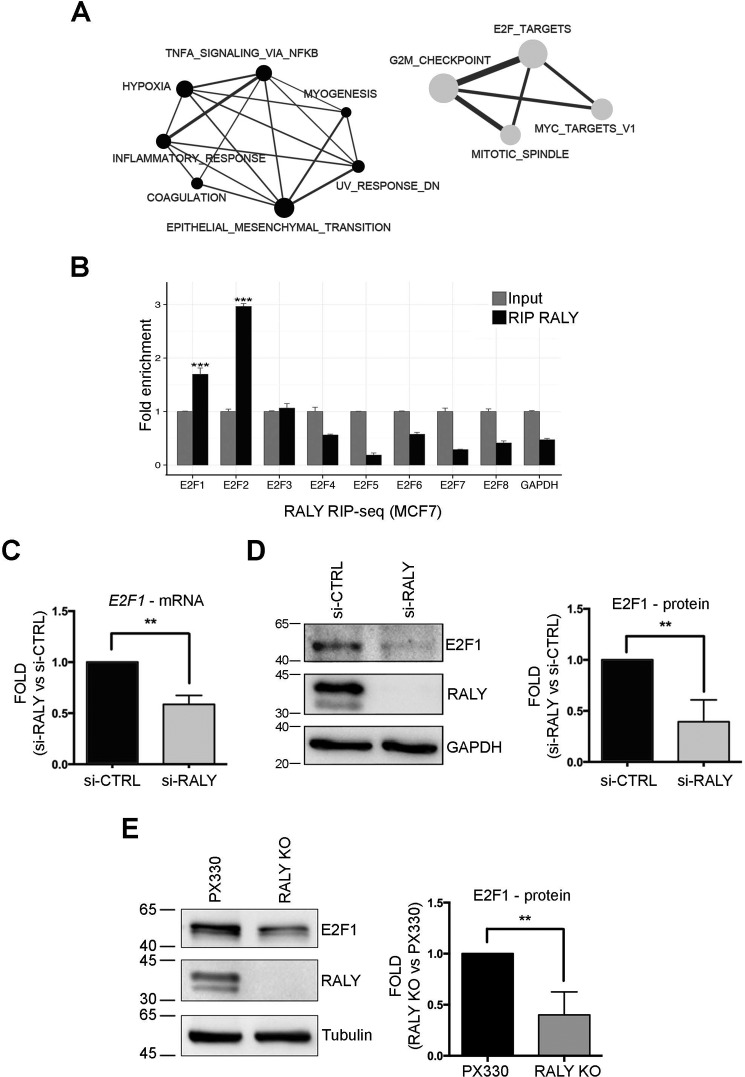
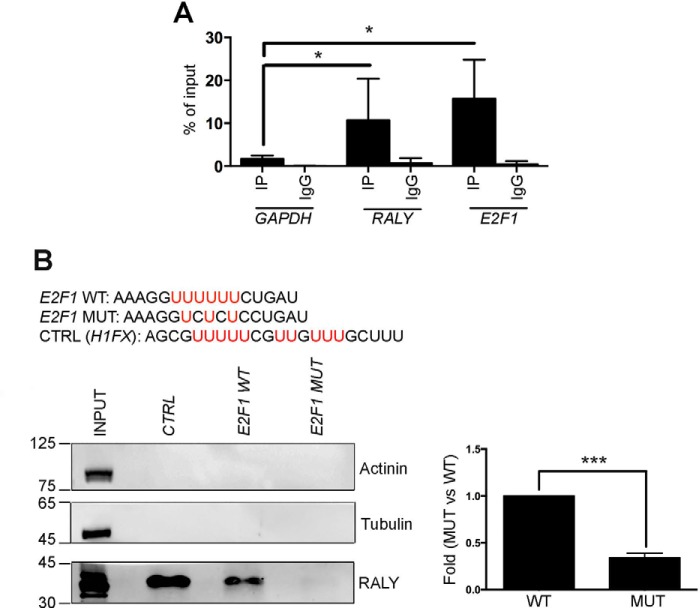
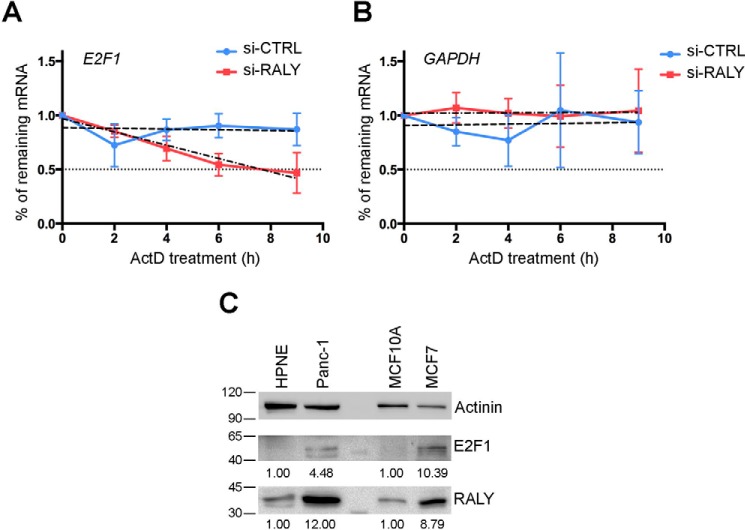
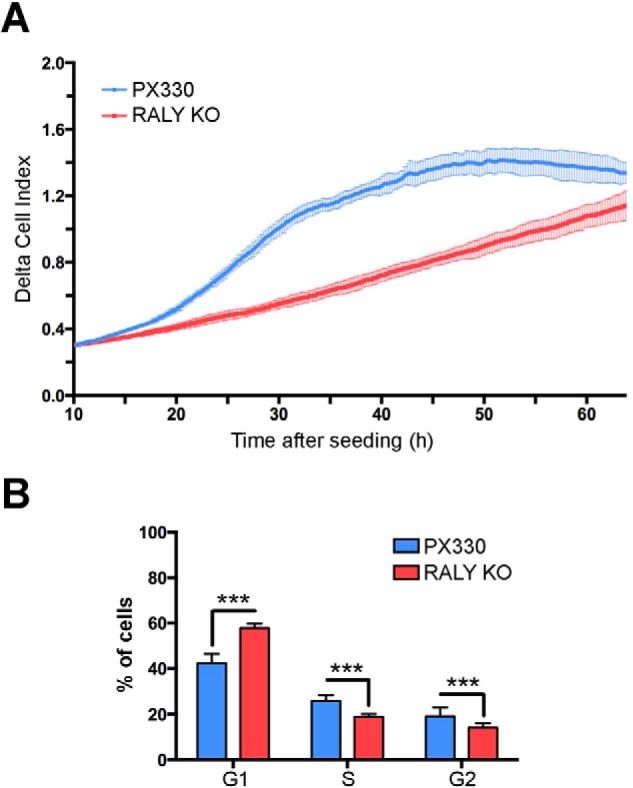
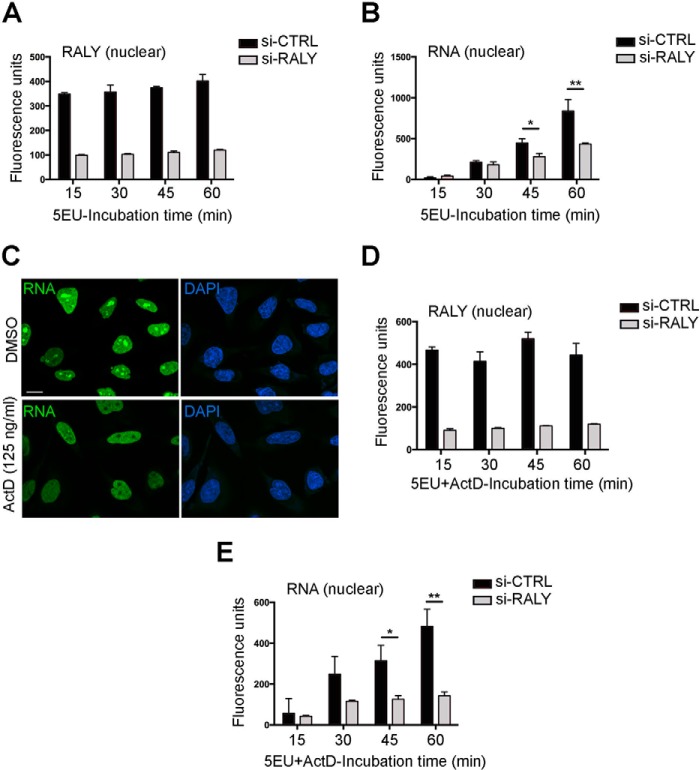
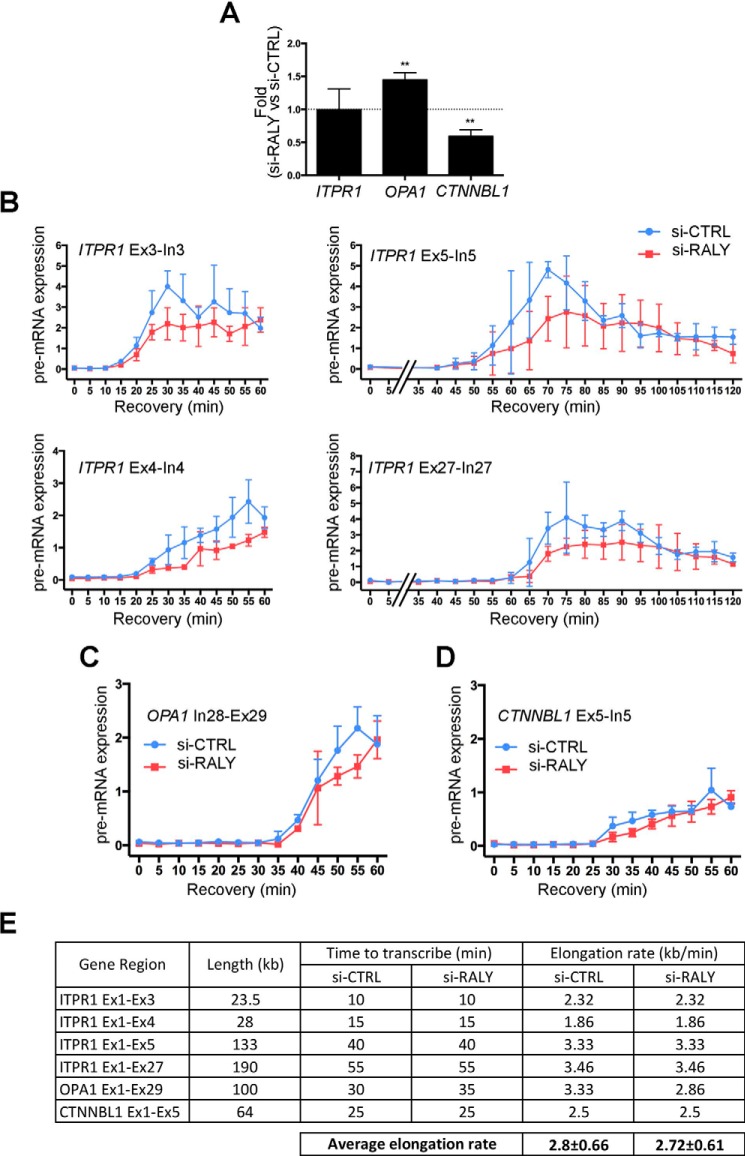
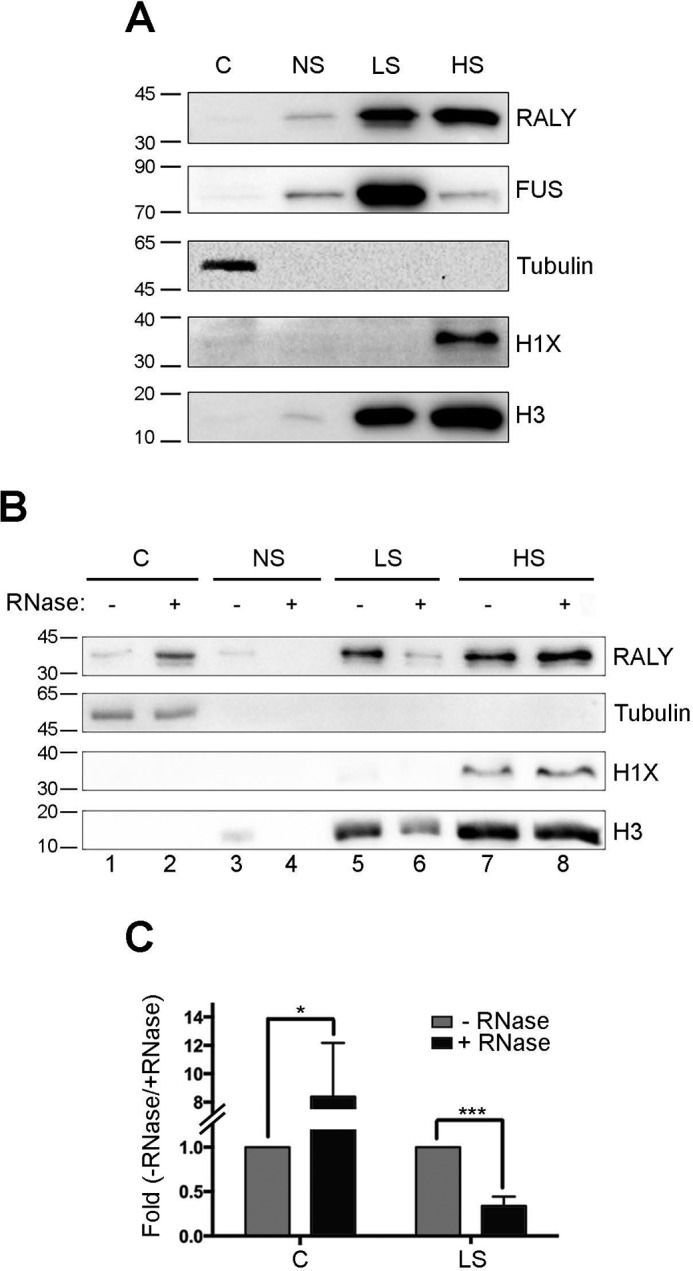
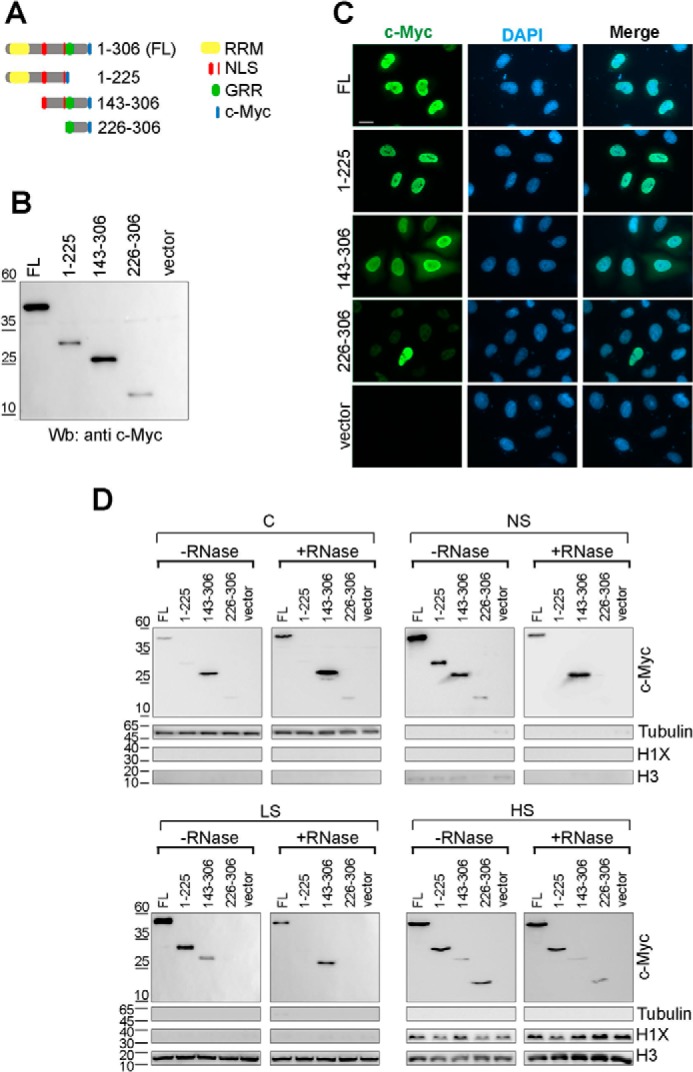
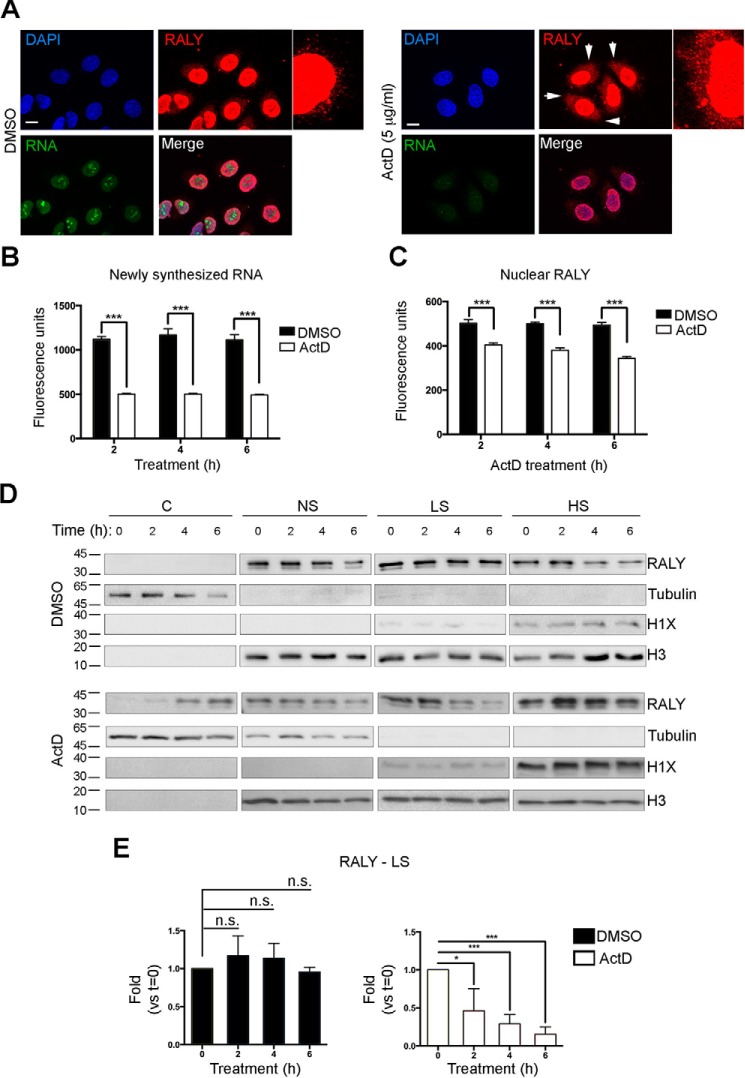
The heterogeneous nuclear ribonucleoproteins (hnRNP) form a large family of RNA-binding proteins that exert numerous functions in RNA metabolism. RALY is a member of the hnRNP family that binds poly-U-rich elements within several RNAs and regulates the expression of specific transcripts. RALY is up-regulated in different types of cancer, and its down-regulation impairs cell cycle progression. However, the RALY's role in regulating RNA levels remains elusive. Here, we show that numerous genes coding for factors involved in transcription and cell cycle regulation exhibit an altered expression in RALY-down-regulated HeLa cells, consequently causing impairments in transcription, cell proliferation, and cell cycle progression. Interestingly, by comparing the list of RALY targets with the list of genes affected by RALY down-regulation, we found an enrichment of RALY mRNA targets in the down-regulated genes upon RALY silencing. The affected genes include the E2F transcription factor family. Given its role as proliferation-promoting transcription factor, we focused on E2F1. We demonstrate that E2F1 mRNA stability and E2F1 protein levels are reduced in cells lacking RALY expression. Finally, we also show that RALY interacts with transcriptionally active chromatin in both an RNA-dependent and -independent manner and that this association is abolished in the absence of active transcription. Taken together, our results highlight the importance of RALY as an indirect regulator of transcription and cell cycle progression through the regulation of specific mRNA targets, thus strengthening the possibility of a direct gene expression regulation exerted by RALY.

Keywords: E2F transcription factor; RNA; RNA metabolism; chromatin; heterogeneous nuclear ribonucleoprotein (hnRNP); hnRNP-associated with lethal yellow homolog (RALY).


Conflict of interest statement

The authors declare that they have no conflicts of interest with the contents of this article

Figures

Figure 1.
Figure 1.
RALY silencing alters the transcriptome of HeLa cells. Three independent microarray experiments were performed using RNA preparations from three independent biological replicates of HeLa cells transfected with either si-RALY or si-CTRL for 72 h. A, to assess RALY silencing, total RNA and protein extracts were analyzed through qRT-PCR (normalized on GAPDH) and subjected to SDS-PAGE and Western blot analysis, respectively, with the indicated antibodies. The cells analyzed by microarray showed down-regulation of RALY at both the mRNA (upper graph) and protein (lower graph) levels. The graphs show the mean of three independent experiments ± S.D. The p value was calculated using an unpaired two-tailed t test (***, p < 0.001). B, MA plot of RALY-silencing transcriptome profiling. For each gene, the average log10 signal against the RALY-silencing log2 fold change (si-RALY versus control) is plotted. Genes significantly up-regulated (blue) or down-regulated (red) upon RALY silencing are highlighted. C, classification of DEGs upon RALY silencing according to RNA classes. D, functional annotation enrichment analysis of RALY–up-regulated and –down-regulated genes. The heat map, colored-coded according to enrichment p value, displays enriched classes from gene ontology terms and the KEGG or REACTOME pathways. The number of DEGs falling in each category is displayed inside each tile. E, intersection between the lists of si-RALY up-regulated (blue) or down-regulated (red) genes in HeLa cells and the list of RALY RIP-seq targets identified previously in MCF7 cells (32). The percentage of overlap with respect to the number of DEGs is displayed beside the corresponding bar. Although the intersection could be affected by cell line differences, the increased frequency of RALY RNA targets among genes down-regulated upon RALY silencing suggests that the loss of a direct RALY–mRNA interaction is associated with the down-regulation of the target.
Figure 2.
Figure 2.
Validation of the microarray results for down-regulated genes upon RALY silencing. A, HeLa cells were transfected with either si-RALY or si-CTRL for 72 h, and total RNA was extracted. The mRNA levels of the different factors promoting proliferation (CCNB1, CCNB2, CCNE1, CCNE2, CDK1, CDC25A, and TFDP1) and transcription (CCNT1, GTF2A1, GTF2E2, ELL2, SUPT16H, and SSRP1) were measured by qRT-PCR and normalized on GAPDH. As in the microarray analysis, all of the analyzed genes were found to be less expressed in si-RALY cells compared with si-CTRL cells. B and C, total protein extracts were produced from HeLa cells transfected with either si-RALY or si-CTRL for 72 h. Total lysates were subjected to SDS-PAGE, and Western blot analysis with the indicated antibodies (left panels). The levels of CCNE1 (B) and CCNT1 (C) were analyzed by band densitometry analysis (right panels) and found to be down-regulated in si-RALY– compared with si-CTRL–transfected cells. All of the graphs show the mean of three independent experiments ± S.D. The p value was calculated using an unpaired two-tailed t test (*, p < 0.05; **, p < 0.01; ***, p < 0.001) between the signal detected in si-RALY– and si-CTRL–transfected cells.
Figure 3.
Figure 3.
RALY regulates E2F1 expression. A, functional map of global changes in gene expression in response to RALY silencing. Enrichment results from GSEA were mapped as a network of gene sets (nodes) related by mutual overlap (edges), where black identifies the up-regulated and light gray the down-regulated gene sets. The size of each node is proportional to the size of the gene set. The size of each edge is proportional to the mutual overlap between two nodes. The gene set E2F_TARGETS, which contains “genes encoding cell cycle–related targets of E2F transcription factor,” is the most enriched in down-regulated genes upon RALY silencing. B, the mRNAs coding for E2F1 and E2F2 were found to be enriched in RALY-containing immunoprecipitated particles in the RIP-seq analysis performed in MCF7 cells. On the contrary, no enrichment was detected for the other members of the E2F family. The graphs represent the mean of three independent experiments ± S.D. The p value was calculated using an unpaired two-tailed t test between the respective samples (***, p < 0.001). C and D, HeLa cells were transfected with either si-RALY or si-CTRL for 72 h, and both total RNA and total protein extracts were collected. RNA was analyzed by qRT-PCR and the signals normalized on GAPDH, whereas proteins were subjected to SDS-PAGE and Western blot analysis with the indicated antibodies followed by band densitometry analysis. Both the E2F1 mRNA (C) and E2F1 protein (D) are down-regulated in cells lacking RALY expression. E, PX330 and RALY KO lysates were subjected to SDS-PAGE and Western blot analysis using the indicated antibodies followed by band densitometry analysis. E2F1 expression is reduced in RALY KO cells. The graphs show the mean of three independent experiments ± S.D. The p value was calculated using an unpaired two-tailed t test (**, p < 0.01).
Figure 4.
Figure 4.
RALY interacts with E2F1 mRNA A, qRT-PCR was used to compare the indicated mRNAs isolated upon UV–cross-linked RALY immunoprecipitation. RNA was recovered after immunoprecipitation with anti-RALY and control anti-IgG antibodies. The relative abundance was compared with 10% of input. E2F1 mRNA is enriched in RALY-containing RNPs. Bars represent means ± S.D. of three independent experiments. The p value was calculated by comparing the amount of each mRNA with the amount of GAPDH using an unpaired two-tailed t test (*, p < 0.05). B, sequences of the biotinylated wild-type and mutant E2F1 3′-UTR probes (top). Total protein extract from HeLa cells was incubated with either E2F1 wild-type (WT) or mutant (MUT) biotinylated RNA probes (50 pmol) and captured by streptavidin–Dynabeads. H1X 3′-UTR biotinylated probe was used as a positive control (CTRL) as described by Rossi et al. (32). Western blot analysis of probe-bound proteins showed the positive in vitro interaction of RALY with the wild-type poly-U sequence but not with the mutant probe. Immunoblotting with anti-actinin and anti-tubulin served as negative controls. The graph shows the mean values of the densitometry analysis of three independent experiments. Bars represent mean ± S.D. The p value was calculated by an unpaired two-tailed t test (***, p < 0.001).
Figure 5.
Figure 5.
RALY stabilizes E2F1 mRNA. A and B, HeLa cells were transfected either with si-RALY or si-CTRL for 72 h and treated successively with ActD (5 μg/ml) for 0, 2, 4, 6, and 9 h. Total RNA was extracted and analyzed through qRT-PCR and normalized on the ACTB signal. A, E2F1 mRNA is less stable in si-RALY–transfected cells compared with control untreated cells. E2F1 mRNA was measured to have a half-life of 7.64 ± 1.32 h in si-RALY cells but remained stable for over 9 h in si-CTRL cells. B, on the contrary, GAPDH mRNA is comparably stable in both si-RALY– and si-CTRL–transfected cells. C, HPNE, Panc-1, MCF10A, and MCF7 cells were lysed, and the total protein extracts were subjected to SDS-PAGE and Western blot with the indicated antibodies. Bands were quantified through band densitometry analysis and normalized on actinin. The more aggressive cell lines, Panc-1 and MCF7, express higher levels of both RALY and E2F1 compared with the less aggressive cell lines, HPNE and MCF10A, highlighting the positive relationship between RALY and E2F1 expression.
Figure 6.
Figure 6.
The absence of RALY impairs cell proliferation and cell cycle progression. A, PX330 and RALY KO cells were plated into an xCELLigence RTCA (real-time cell analyzer) E-plate, and cell proliferation was monitored for 60 h. RALY KO cells show a decreased cell proliferation compared with PX330 control cells. B, PX330 and RALY KO cells were seeded into a 96-well plate and left to grow for 24 h. The cells were then incubated with 10 μm 5-EdU for 1 h and processed to stain newly synthesized DNA. The cells were analyzed using a high-content imaging system, and the distribution of the cells through the cell cycle was evaluated depending on their DNA content. RALY KO cells show an enrichment in the G1 phase of the cell cycle and a consequent lower distribution in both the S and G2 phases. The graphs show the mean values of three independent experiments. Bars represent mean ± S.D. The p value was calculated by unpaired two-tailed t test (**, p < 0.01; ***, p < 0.001).
Figure 7.
Figure 7.
The down-regulation of RALY impairs RNAPII-dependent transcription. HeLa cells were transfected with either si-RALY or si-CTRL for 72 h. The cells were incubated successively with 5-EU (A and B) or 5-EU plus ActD (125 ng/ml) (D and E) for 0, 15, 30, 45, and 60 min. The down-regulation of RALY in the nucleus was verified by immunostaining with anti-RALY antibody (A and D). The amount of newly synthesized RNA was measured with a high-throughput fluorescence microscope after staining the incorporated 5-EU with the fluorescent molecule 5-FAM (B and E). In both the ActD-treated and untreated conditions, the levels of newly synthesized RNA show a slower increase over time in si-RALY cells compared with si-CTRL cells. The absence of RALY affects RNA polymerase II-dependent transcription. All of the graphs represent the mean of three independent experiments ± S.D. The p value was calculated using an unpaired two-tailed t test (*, p < 0.05; **, p < 0.01) between the respective samples of si-RALY– and si-CTRL–transfected cells. C, HeLa cells were incubated with 5-EU and treated with ActD (125 ng/ml) or DMSO for 1 h. Newly synthesized RNA was stained with 5-FAM and RALY through immunofluorescence with anti-RALY antibody. The mild ActD treatment only inhibited RNA polymerase I, abrogating the synthesis of RNA in the nucleoli. Scale bar = 10 μm.
Figure 8.
Figure 8.
Analysis of the elongation rate of RNAPII. A, HeLa cells were transfected with either si-RALY si-CTRL for 72 h. The expression level of ITPR1, OPA1, and CTNNBL1 mRNAs was quantified by qRT-PCR and normalized on GAPDH. The level of ITPR1 mRNA did not change significantly, whereas OPA1 and CTNNBL1 levels, respectively, increased and decreased in the absence of RALY compared with control cells. The graph shows the mean of three independent experiments ± S.D. The p value was calculated using an unpaired two-tailed t test between si-RALY– and si-CTRL–transfected cells (**, p < 0.01). B–D, HeLa cells transfected either with si-RALY or si-CTRL siRNA for 72 h were treated with 100 μm DRB for 3 h to block RNAPII activity. After washing with PBS, the cells were incubated in DMEM to recover transcription. Successively, total RNA was collected at 5-min intervals. qRT-PCR analysis with different exon-intron primer pairs for ITPR1 (B), OPA1 (C), and CTNNBL1 (D) pre-mRNAs was used to measure RNAPII elongation rate. The pre-mRNA expression values are plotted relative to the expression level of the untreated controls, which was set to 1 in all experiments. RALY did not impair the RNAPII elongation rate. E, the table depicts the calculated elongation rate of RNAPII along the analyzed genes for both si-RALY– and si-CTRL–transfected cells. The down-regulation of RALY did not impair RNAPII elongation rate.
Figure 9.
Figure 9.
RALY is associated with chromatin. A, HeLa cell lysates were fractionated into cytosolic (C), nuclear-soluble (NS), low-salt–soluble chromatin (LS), and high-salt–soluble chromatin (HS) fractions. Each fraction was subjected to SDS-PAGE and Western blot analysis with the indicated antibodies. Endogenous RALY is faintly present in the cytosolic and nuclear-soluble fractions and enriched in both the low-salt– and high-salt–soluble fractions. FUS was analyzed to compare the behavior of RALY with a known hnRNP associated with chromatin. B, the distribution of endogenous RALY was examined by the fractionation method described in A either in the presence (−RNase) or absence of RNA (+RNase). In the absence of RNA, RALY decreases in the low-salt–soluble fraction and consequently increases in the cytosolic fraction. C, the levels of RALY were quantified by band densitometry analysis. The graphs show the mean values of three independent experiments and compare the level of RALY in the presence and absence of RNA in cytosolic and low-salt–soluble fractions. Bars represent mean ± S.D. The p value was calculated using an unpaired two-tailed t test (*, p < 0.05; ***, p < 0.001).
Figure 10.
Figure 10.
RALY interacts with nuclear components using either the N- or C-terminal region. A, schematic representation of c-Myc–tagged RALY constructs. B, C-Myc–tagged RALY constructs were transfected in HeLa cells for 24 h. Total lysates were subjected to SDS-PAGE and Western blot analysis with anti-c-Myc antibody. C, the cellular localization of RALY–c-Myc mutants was verified after immunofluorescence with anti-c-Myc antibody and DAPI staining. All of the recombinant fragments localized inside the nucleus. However, fragment(143–306) is also in the cytoplasm. Scale bar = 10 μm. D, RALY–c-Myc constructs were transfected in HeLa cells for 24 h, and the lysates were fractionated into cytosolic (C), nuclear-soluble (NS), low-salt–soluble chromatin (LS), and high-salt–soluble chromatin (HS) fractions. Each fraction was subjected to SDS-PAGE and Western blot analysis with the indicated antibodies. Both the N- and C-terminal regions of RALY can mediate an interaction with nuclear-soluble components and transcriptionally active chromatin (LS). In particular, the interactions made by RALY through the N-terminal RRM (construct(1–225)) in the nuclear-soluble and low-salt–soluble chromatin fractions are RNA-dependent.
Figure 11.
Figure 11.
The localization of RALY is dependent on active transcription. A, HeLa cells were treated with 5-EU and either ActD (5 μg/ml) or vehicle (DMSO) for 2 h. RALY was stained with anti-RALY antibody and RNA with 5-FAM. After ActD treatment, there is a higher presence of RALY in the cytoplasm compared with the DMSO-treated cells (arrowheads). Scale bar = 10 μm. B and C, HeLa cells were treated with 5-EU plus either ActD (5 μg/ml) or vehicle (DMSO) for 2, 4, or 6 h, and the amount of nuclear newly synthesized RNA (B) and nuclear RALY (C), respectively, were assessed after staining with 5-FAM and after immunofluorescence with anti-RALY antibody using a high-throughput fluorescence microscope. The graphs represent the mean of three independent experiments and highlight the absence of new RNA synthesis (B) and the decrease of nuclear RALY (C) in HeLa cells treated with ActD. In B, the remaining RNA signal was considered background noise. The p value was calculated using an unpaired two-tailed t test comparing the 5-FAM signal (B) and the nuclear level of RALY (C) of the treated cells (ActD or DMSO) with the respective untreated sample (t = 0) (***, p < 0.001). D, HeLa cells were treated with either ActD (5 μg/ml) or DMSO for 0, 2, 4, or 6 h. At each time point, the cells were fractionated into cytosolic (C), nuclear-soluble (NS), low-salt–soluble chromatin (LS), and high-salt–soluble chromatin (HS) fractions. Then, each fraction was subjected to SDS-PAGE and Western blot analysis with the indicated antibodies. Along with the ActD treatment, the amount of RALY decreases in the low-salt–soluble chromatin fraction and in parallel increases in the cytosolic fraction. E, the levels of RALY in the low-salt–soluble chromatin fraction were quantified by band densitometry analysis. The graphs represent the mean of three independent experiments and highlight the significant decrease in RALY in the low-salt–soluble chromatin fraction during ActD treatment (right graph) compared with DMSO treatment (left graph). The p value was calculated comparing the level of RALY in the low-salt–soluble chromatin fraction of the treated cells with the respective untreated samples (t = 0) using an unpaired two-tailed t test (*, p < 0.05; ***, p < 0.001). n.s., not statistically significant.

Similar articles

Cited by

References

    1. Sainsbury S., Bernecky C., and Cramer P. (2015) Structural basis of transcription initiation by RNA polymerase II. Nat. Rev. Mol. Cell Biol. 16, 129–143 - PubMed
    1. Thomas M. C., and Chiang C. M. (2006) The general transcription machinery and general cofactors. Crit. Rev. Biochem. Mol. Biol. 41, 105–178 - PubMed
    1. Fredericks A. M., Cygan K. J., Brown B. A., and Fairbrother W. G. (2015) RNA-binding proteins: Splicing factors and disease. Biomolecules 5, 893–909 - PMC - PubMed
    1. Das R., Yu J., Zhang Z., Gygi M. P., Krainer A. R., Gygi S. P., and Reed R. (2007) SR proteins function in coupling RNAP II transcription to pre-mRNA splicing. Mol. Cell 26, 867–881 - PubMed
    1. Fackelmayer F. O., Dahm K., Renz A., Ramsperger U., and Richter A. (1994) Nucleic-acid-binding properties of hnRNP/SAF-A, a nuclear-matrix protein which binds DNA and RNA in vivo and in vitro. Eur. J. Biochem. 221, 749–757 - PubMed

Publication types

MeSH terms

LinkOut - more resources