. 2017 Nov 10;292(45):18408-18421.
doi: 10.1074/jbc.M117.791202. Epub 2017 Sep 27.

Mutual synergy between catalase and peroxidase activities of the bifunctional enzyme KatG is facilitated by electron hole-hopping within the enzyme

Affiliations

Mutual synergy between catalase and peroxidase activities of the bifunctional enzyme KatG is facilitated by electron hole-hopping within the enzyme

Olive J Njuma et al. J Biol Chem. .

Abstract

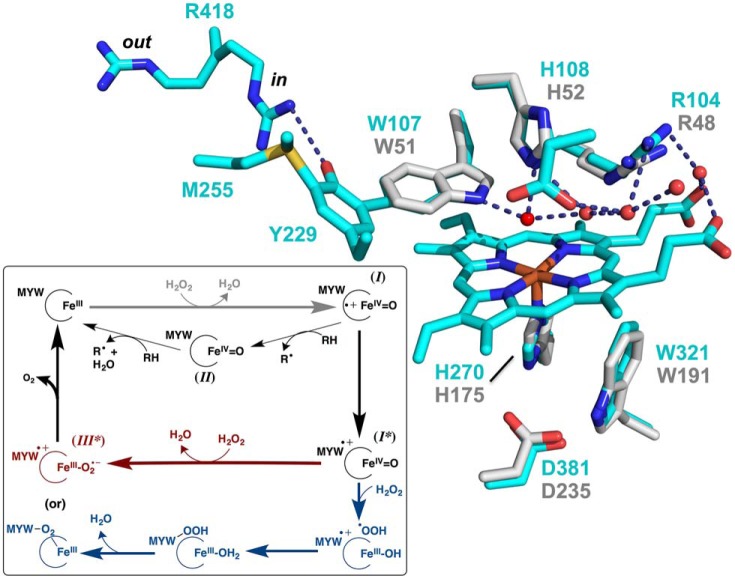
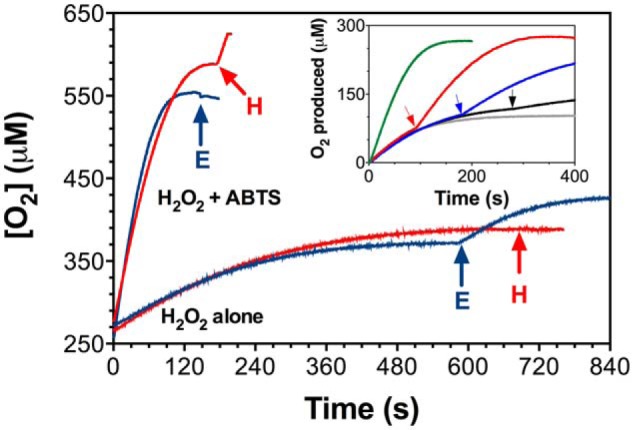
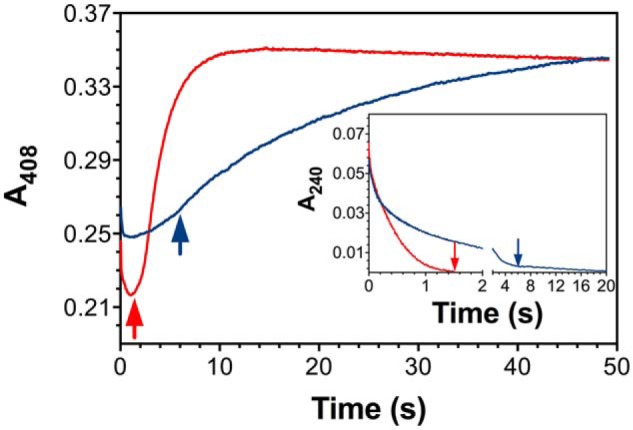
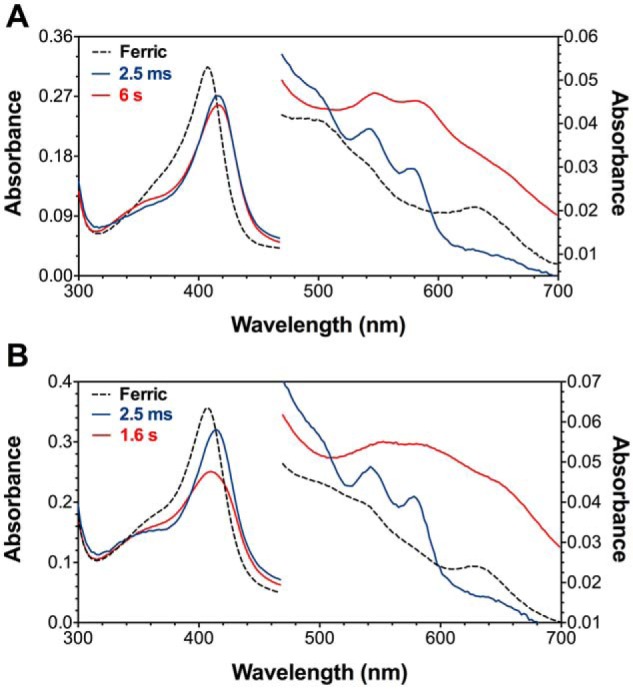
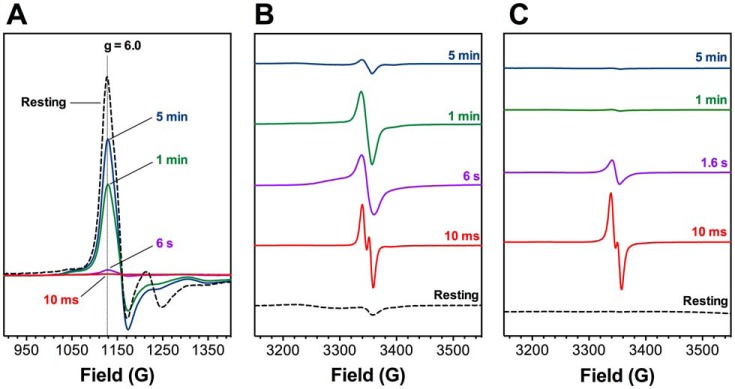
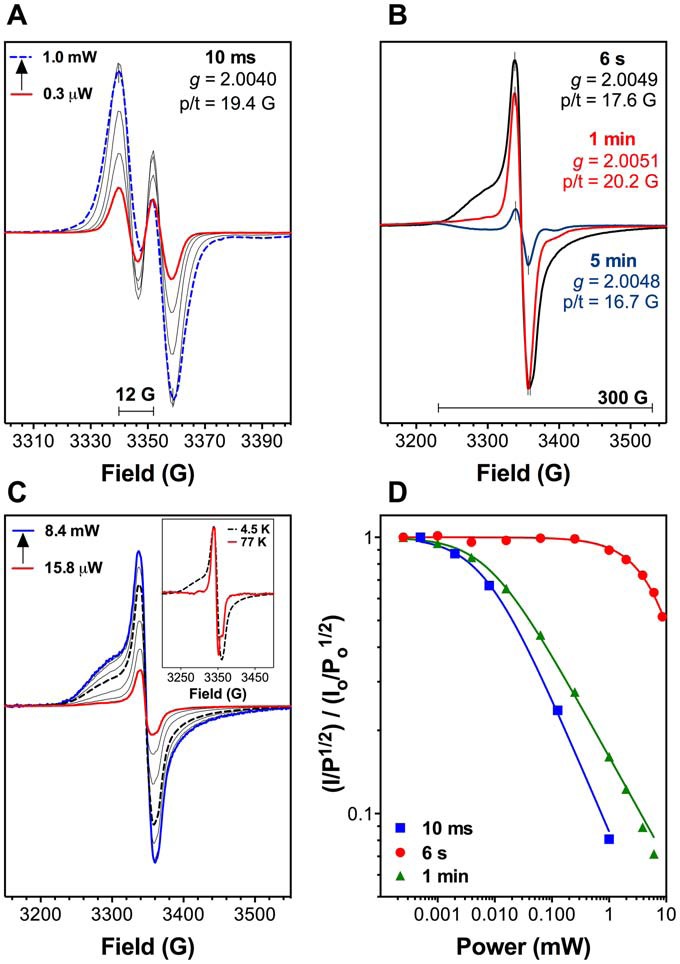
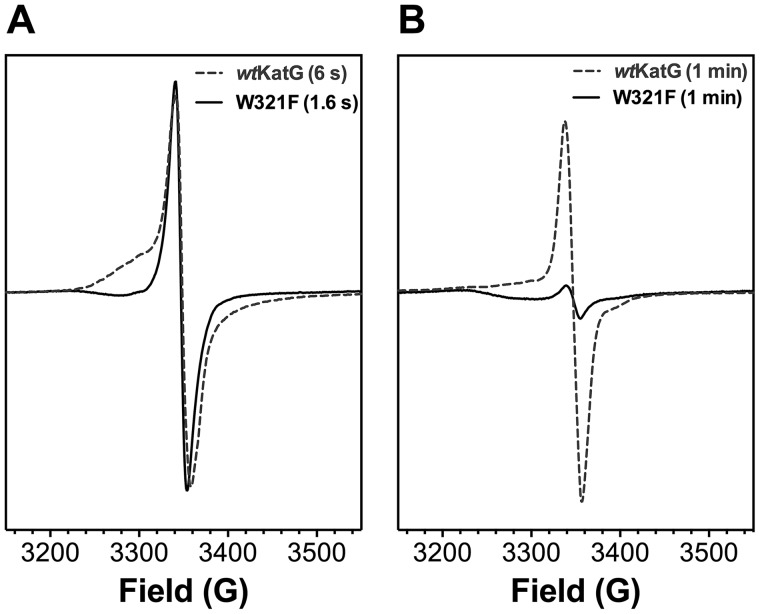
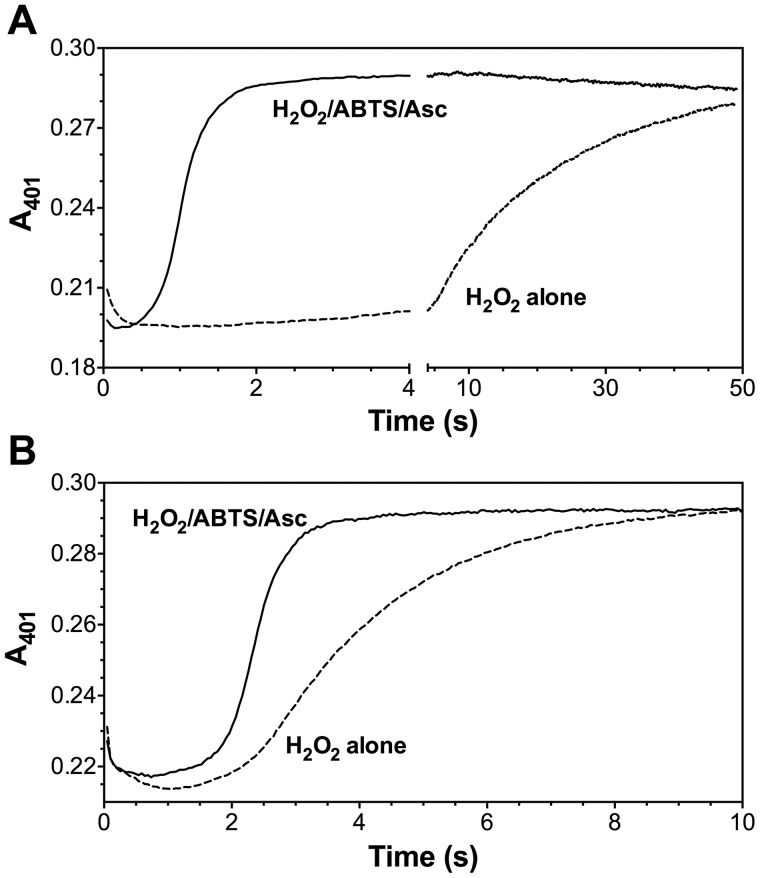
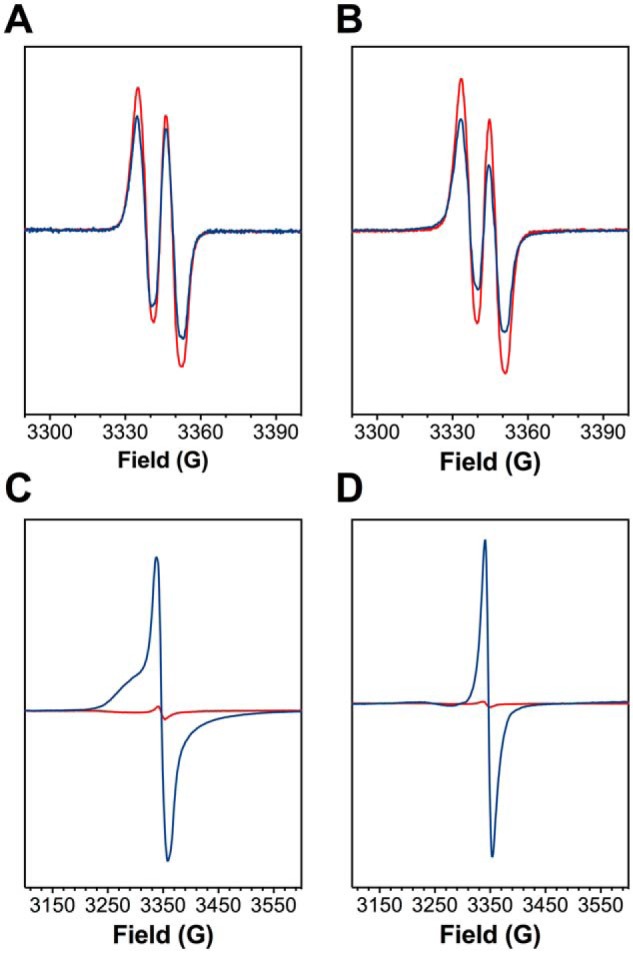
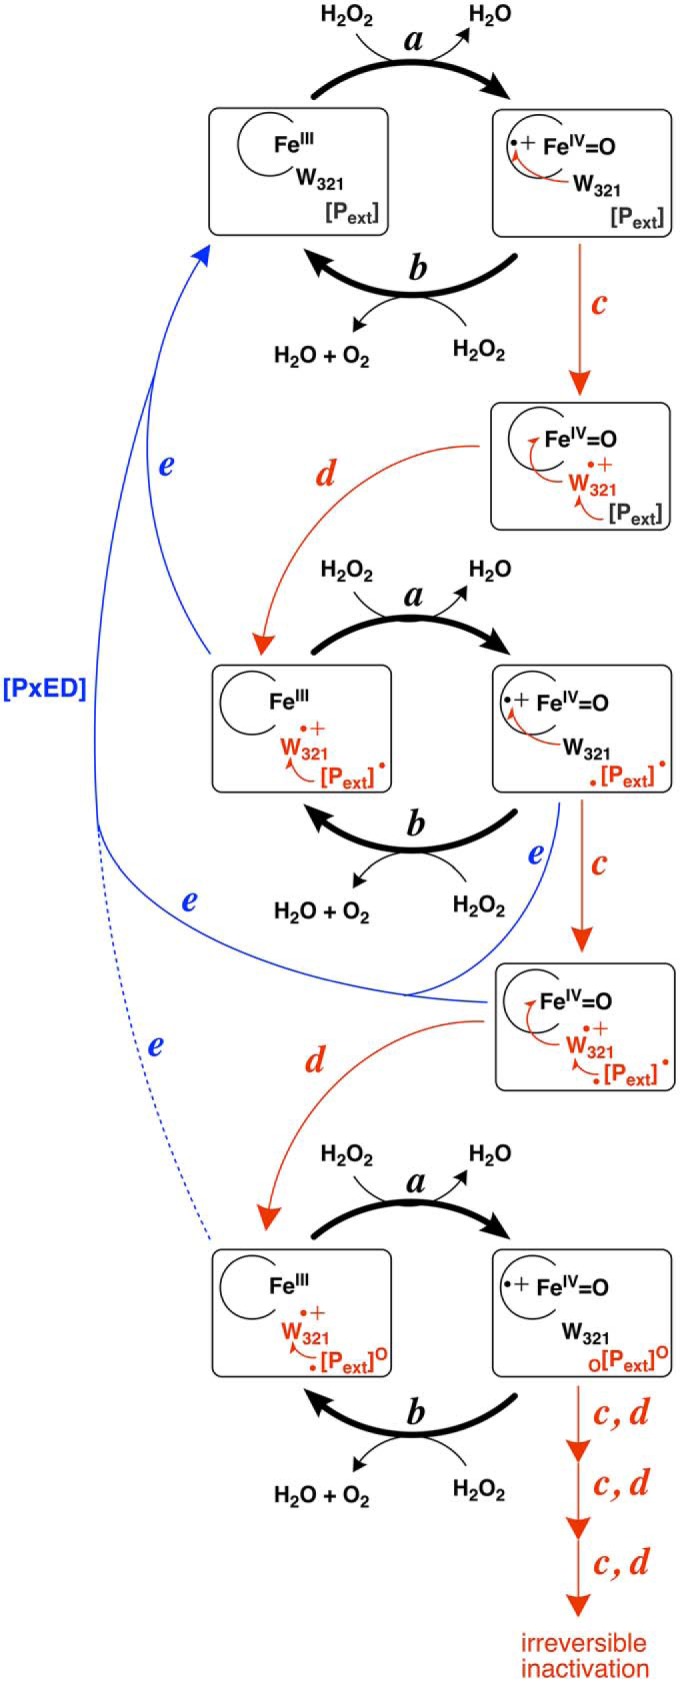
KatG is a bifunctional, heme-dependent enzyme in the front-line defense of numerous bacterial and fungal pathogens against H2O2-induced oxidative damage from host immune responses. Contrary to the expectation that catalase and peroxidase activities should be mutually antagonistic, peroxidatic electron donors (PxEDs) enhance KatG catalase activity. Here, we establish the mechanism of synergistic cooperation between these activities. We show that at low pH values KatG can fully convert H2O2 to O2 and H2O only if a PxED is present in the reaction mixture. Stopped-flow spectroscopy results indicated rapid initial rates of H2O2 disproportionation slowing concomitantly with the accumulation of ferryl-like heme states. These states very slowly returned to resting (i.e. ferric) enzyme, indicating that they represented catalase-inactive intermediates. We also show that an active-site tryptophan, Trp-321, participates in off-pathway electron transfer. A W321F variant in which the proximal tryptophan was replaced with a non-oxidizable phenylalanine exhibited higher catalase activity and less accumulation of off-pathway heme intermediates. Finally, rapid freeze-quench EPR experiments indicated that both WT and W321F KatG produce the same methionine-tyrosine-tryptophan (MYW) cofactor radical intermediate at the earliest reaction time points and that Trp-321 is the preferred site of off-catalase protein oxidation in the native enzyme. Of note, PxEDs did not affect the formation of the MYW cofactor radical but could reduce non-productive protein-based radical species that accumulate during reaction with H2O2 Our results suggest that catalase-inactive intermediates accumulate because of off-mechanism oxidation, primarily of Trp-321, and PxEDs stimulate KatG catalase activity by preventing the accumulation of inactive intermediates.

Keywords: electron paramagnetic resonance (EPR); electron transfer; enzyme inactivation; free radicals; heme; hydrogen peroxide; tryptophan.


Conflict of interest statement

The authors declare that they have no conflicts of interest with the contents of this article

Figures

Figure 1.
Figure 1.
Superposition of KatG and CcP active sites as well as a putative superposition of the catalase and peroxidase catalytic cycles of KatG. KatG is shown with carbons in cyan, and CcP is shown with carbons in gray. The active-site waters (red spheres) and heme are from KatG, and the two conformations (in and out) of the arginine switch (R418) are shown. KatG numbering is according to the M. tuberculosis enzyme MtKatG. This image was generated using MacPyMOL 1.6.0.0 (77) using coordinates from Protein Data Bank code 2CCA (78) and 2CYP (24) for MtKatG and yeast CcP, respectively. Putatitve superposition of the catalase and peroxidase cycles of KatG is shown in the inset. The reaction common to both (compound I formation) is shown with the bold gray arrow. Additional steps of classical peroxidase activity are shown with thin arrows. The additional steps of catalase activity are shown in bold arrows, including two proposed mechanisms (red versus blue) for the return of compound I* to the starting state.
Figure 2.
Figure 2.
Effect of ABTS (a PxED) on the rate and amount of catalatic O2 production by KatG. All reactions contained 5 nm KatG in 50 mm acetate, pH 5.0, and were initiated by the addition of 0.5 mm H2O2. When present, ABTS was included at 0.1 mm, and all reactions were carried out at 23 °C. In the main graph, second additions of H2O2 (0.5 mm) or KatG (5.0 nm) are indicated by H and E, respectively. The inset shows the effect of the time of ABTS addition on KatG catalatic O2 production. ABTS was either present at time the reaction was initiated with H2O2 (green) or added 90 s (red), 180 s (blue), or 270 s (black) after initiation with H2O2. A reaction was also performed in which no ABTS was added (gray). The approximate time of ABTS addition is indicated by the colored arrow corresponding to each trace. All traces are representative of five repeated measurements.
Figure 3.
Figure 3.
H2O2 consumption (inset) and return of the ferric state for wtKatG (blue lines) and W321F KatG (red lines). Reactions were carried out by stopped-flow, and after mixing they contained 3 μm enzyme and 2 mm H2O2. All reactions were carried out in 100 mm acetate, pH 5.0, at 4 °C. The arrows indicate the times in each trace corresponding to cessation of H2O2 consumption. Each trace represents an average of three shots. Data are representative of at least three repeated experiments.
Figure 4.
Figure 4.
Spectra from reaction of wild-type and W321F KatG with H2O2. Wild-type (A) and W321F KatG (B) were reacted with 2 mm H2O2 by stopped flow, and spectra were recorded throughout the reaction by diode array. Spectra obtained 2.5 ms after reaction with H2O2 (blue) and at the time corresponding to H2O2 depletion (red) (6 s for wild-type and 1.6 s for W321F) are shown. Spectra recorded for the ferric enzyme following mixing with buffer alone are shown by dashed lines. All reactions were carried out as described for Fig. 3. Spectra are representative of at least three repeated experiments.
Figure 5.
Figure 5.
EPR spectra of freeze-quenched samples from reaction of WT and W321F KatG with H2O2. High-spin ferric species typical of the wtKatG resting state (g∼6) are shown in A, the g component of the resting state as well as protein-based radicals (g∼2) of wtKatG and W321F KatG are shown in B and C, respectively. The molar proportions of enzyme to H2O2 used for stopped-flow experiments (1:667) were maintained for these experiments. Consequently, ferric enzyme (150 μm after mixing) was reacted with H2O2 (100 mm after mixing) for the time indicated prior to freeze-quenching. Reactions were carried out at 25 °C in 100 mm acetate, pH 5.0. All spectra were recorded at 4.5 K. Spectrometer settings were as described under “Experimental procedures.” Freeze-quenched samples were generated at least twice with protein from different purifications. Spectra for a given time point were indistinguishable across both experiments.
Figure 6.
Figure 6.
Evaluation of protein-based radicals detected during wtKatG reaction with H2O2. The doublet radical observed 10 ms after mixing with H2O2 (A) was recorded across a range of microwave power settings from 0.3 μW (solid red line) to 1.0 milliwatt (dashed blue line). The radicals observed 6 s (black line), 1 min (red line), and 5 min (blue line) after mixing with H2O2 all recorded using a microwave power of 1.0 milliwatt are compared (B), and the g value and peak-to-trough (p/t) width of each radical are indicated. The effect of microwave power (15.8 μW (red line) to 8.4 milliwatt (blue line)) on the spectrum recorded for the sample quenched 6 s after wtKatG reaction with H2O2 is shown (C). The spectrum recorded with 1.0 milliwatt microwave power (dashed black line) is highlighted in the main figure and scaled for comparison with the spectrum recorded at 77 K using the same power (inset). The normalized signal intensities for samples collected 10 ms, 6 s, and 1 min after wtKatG reaction with H2O2 as a function of microwave power are shown in D. Unless otherwise indicated, all spectra were recorded at 4.5 K with all other spectrometer settings as described in “Experimental procedures.” Samples were prepared and evaluated as described for Fig. 5.
Figure 7.
Figure 7.
Comparison of EPR spectra for W321F and wtKatG at and after the cessation of H2O2 consumption. The radical observed for W321F (solid line) at the time of H2O2 depletion (1.6 s) is compared with that recorded for wild-type KatG (dashed line) at the analogous time (6 s) (A). The radical observed for W321F (solid line) and wild-type (dashed line) 1 min after mixing with H2O2 is also shown (B). Sample preparation, reaction conditions, and spectrometer settings are the same as those described for Fig. 5.
Figure 8.
Figure 8.
Effect of ABTS on the return of the KatG ferric state following H2O2 consumption. Wild-type (A) and W321F KatG (B) were reacted by stopped flow with 2.0 mm H2O2 in the absence and presence of 0.1 mm ABTS, 0.1 mm ascorbate. The return of the ferric state following H2O2 depletion was monitored at 401 nm. The final concentration of enzyme in each reaction was 3 μm. All reactions were carried out in 50 mm acetate buffer, pH 5.0, at 4 °C. Data are representative of at least three repeated experiments.
Figure 9.
Figure 9.
Comparison of EPR spectra for protein-based radicals 10 ms after mixing with H2O2 (A and B) and at H2O2 depletion (C and D). Spectra were recorded for wtKatG (A and C) and the W321F variant (B and D) in the absence (blue lines) and presence of ABTS/ascorbate (red lines). Reaction conditions, sample preparation, and evaluation were as described for Fig. 5. When included, the concentrations of ABTS and ascorbate were 1.0 and 2.0 mm, respectively. Spectra shown in A and B (10 ms after mixing with H2O2) were recorded at 77 K, minimizing power saturation of the radical observed at 4.5 K (see Figs. 5, B and C, and 6A). Spectra shown in C and D (at the time of H2O2 depletion) were recorded at 4.5 K. All spectrometer settings were as described under “Experimental procedures.”
Figure 10.
Figure 10.
Oxidizable amino acids in KatG and CcP. Potential routes for off-catalase electron transfer in KatG compared with sites of peroxide-dependent protein oxidation in KatG and CcP are shown in A. Four principal pathways are proposed. With respect to KatG, the magenta path connects to the heme via the proximal Trp (W321). The green path connects to the heme via Trp-412. The blue path connects to the heme via Trp-91. The copper-colored path, which includes Trp-135, is purported to connect to the heme via the MYW adduct Trp (W107). Solvent-exposed side chains are underlined. Residues identified in bold italics belong to KatG, and oxidizable sites conserved in CcP are indicated in regular typeface. Residues with superscript designations are sites where oxidative modifications have been observed as follows: a radical intermediate has been directly observed (R) (56–59, 66) or trapped (T) (68) or side chain oxygenation has been detected (O) (61, 65). Placement of tryptophan (green), tyrosine (yellow), and methionine (cyan) residues in CcP (2CYP) (24) and the KatG N-terminal domain (2CCA) (78) are shown in B and C, respectively. An overlay of conserved oxidizable amino acids is shown in D, where drab shades represent residues from CcP, and bright shades represent residues from KatG.
Figure 11.
Figure 11.
Proposed mechanism for inactivation of KatG catalase and its prevention by a PxED. The KatG catalase cycle is initiated by H2O2 oxidation of ferric heme to the compound I (i.e. FeIV=O[porphyrin]) state (reactions a). The catalatic return of compound I to the ferric state (abbreviated from Fig. 1) proceeds by paths b, the first step of which is the oxidation of the MYW adduct to its radical cation state (MYW) (not shown). Alternative off-catalase oxidation of the proximal Trp (W321) is shown by reactions c. The relative thickness of the arrows for b versus c indicates that MYW oxidation and subsequent completion of the catalase cycle (b) occurs with a much greater frequency than Trp-oxidation (c) (∼140:1). The return of ferric heme following off-catalase electron transfer occurs by hole-hopping (i.e. radical transfer indicated by red half-arrows) to KatG-oxidizable residues more distant from the active site ([Pext]), producing the corresponding protein-based radicals ([Pext]) (paths d). Horizontal transitions correspond to catalase activity. Each vertical transition is a step in the progressive oxidation of the KatG protein. In the early stages protein-based radicals are the dominant oxidation intermediates, as vertical steps continue, more advanced oxidation products ([Pext]O and O[Pext]O) accumulate, including oxygenated Trp and Met, cross-linked Tyr, oxidative protein aggregates, etc. Conceivably, catalase activity can still be maintained even though the KatG protein has sustained some level of exterior oxidation, but eventually, enzyme inactivation results. Inclusion of a PxED intercepts and reduces protein-based radicals on the KatG surface (e), preventing/reversing vertical progression toward inactivation.

Similar articles

Cited by

References

    1. Zamocky M., and Obinger C. (2010) in Biocatalysis Based on Heme Peroxidases (Ayala M., and Torres E., eds) pp. 7–35, Springer-Verlag, Berlin
    1. Mishra S., and Imlay J. (2012) Why do bacteria use so many enzymes to scavenge hydrogen peroxide? Arch. Biochem. Biophys. 525, 145–160 - PMC - PubMed
    1. Imlay J. A. (2008) Cellular defenses against superoxide and hydrogen peroxide. Annu. Rev. Biochem. 77, 755–776 - PMC - PubMed
    1. Tanabe S., Ishii-Minami N., Saitoh K., Otake Y., Kaku H., Shibuya N., Nishizawa Y., and Minami E. (2011) The role of catalase-peroxidase secreted by Magnaporthe oryzae during early infection of rice cells. Mol. Plant Microbe Interact. 24, 163–171 - PubMed
    1. Uhlich G. A. (2009) KatP contributes to OxyR-regulated hydrogen peroxide resistance in Escherichia coli serotype O157: H7. Microbiology 155, 3589–3598 - PubMed

Publication types

MeSH terms

LinkOut - more resources