Comparative Study
. 2017 Dec 15;292(50):20528-20543.
doi: 10.1074/jbc.M117.799593. Epub 2017 Sep 27.

Urokinase-type plasminogen activator (uPA) is critical for progression of tuberous sclerosis complex 2 (TSC2)-deficient tumors

Affiliations
Comparative Study

Urokinase-type plasminogen activator (uPA) is critical for progression of tuberous sclerosis complex 2 (TSC2)-deficient tumors

Victoria Stepanova et al. J Biol Chem. .

Abstract

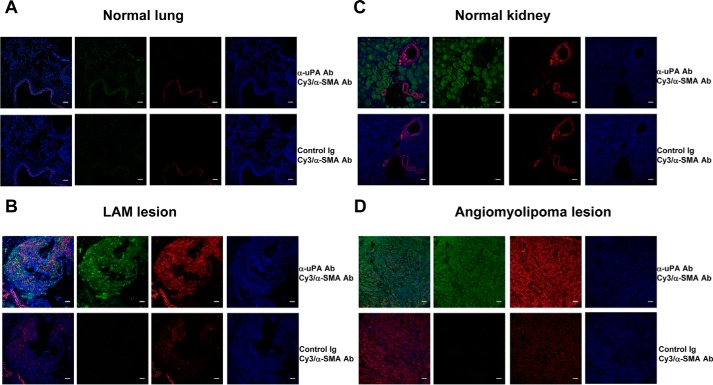
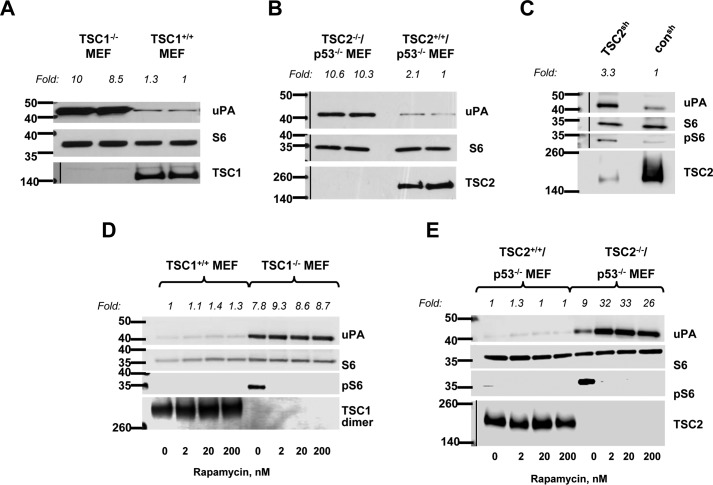
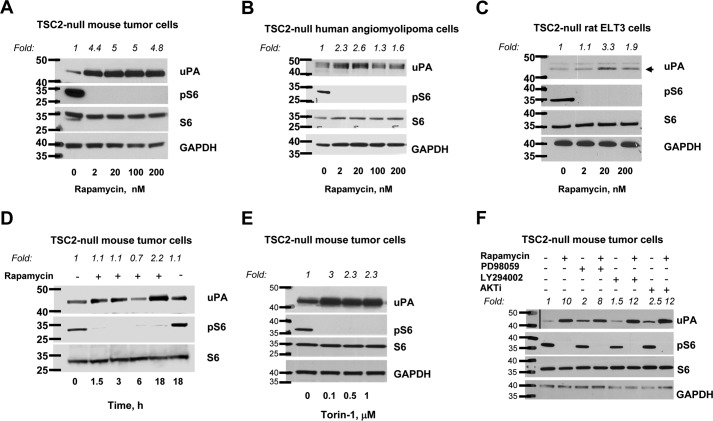
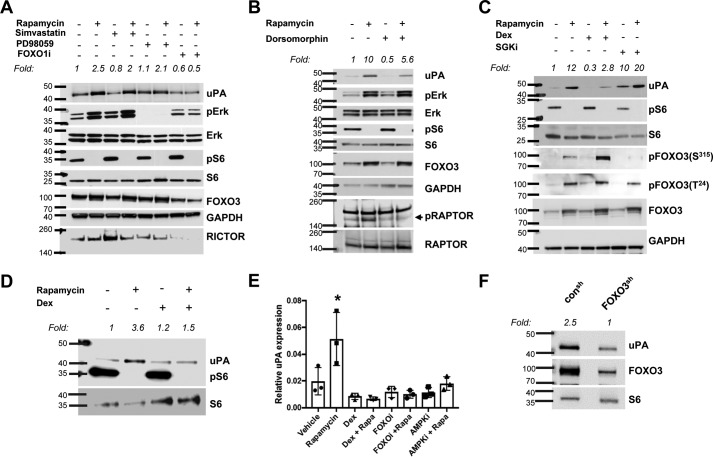
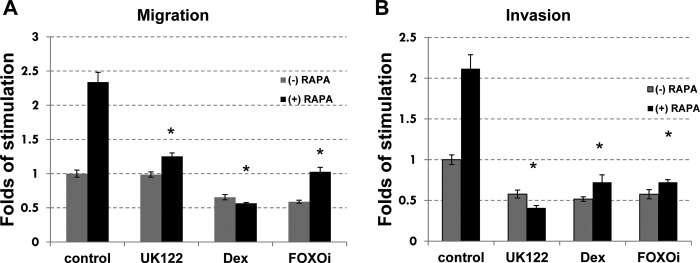
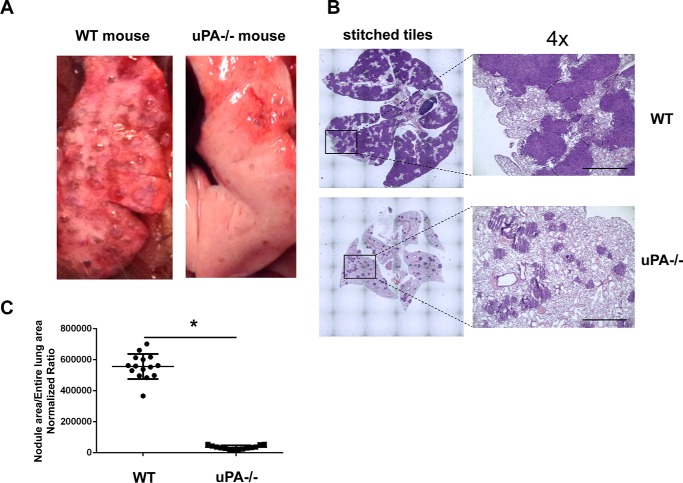
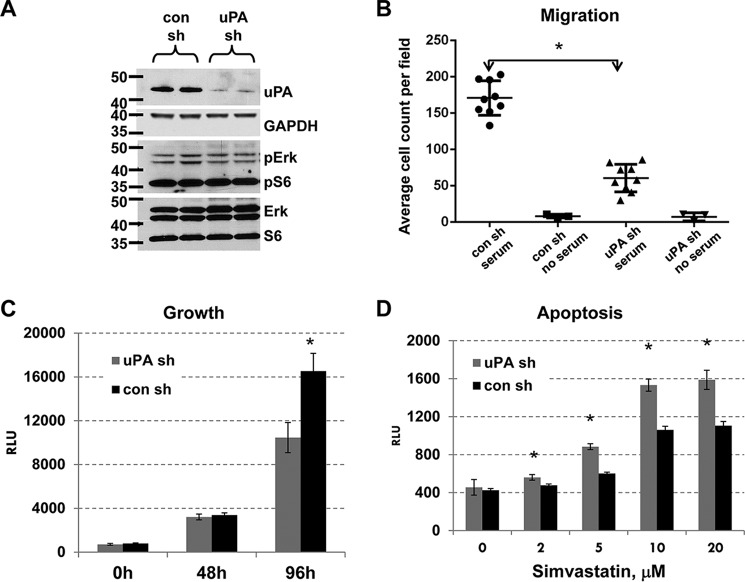
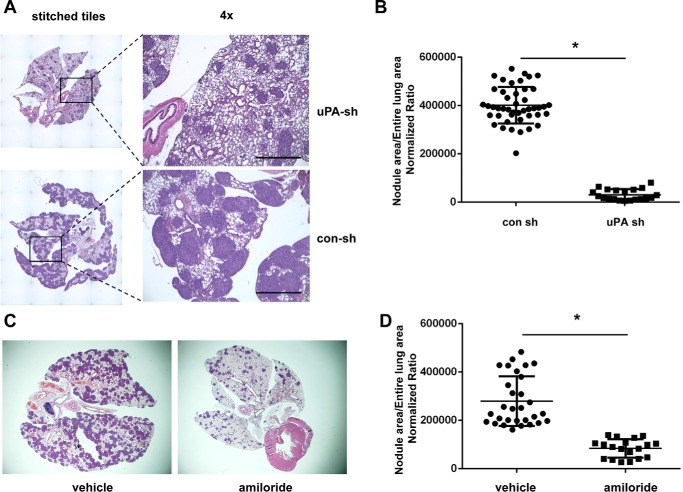
Lymphangioleiomyomatosis (LAM) is a fatal lung disease associated with germline or somatic inactivating mutations in tuberous sclerosis complex genes (TSC1 or TSC2). LAM is characterized by neoplastic growth of smooth muscle-α-actin-positive cells that destroy lung parenchyma and by the formation of benign renal neoplasms called angiolipomas. The mammalian target of rapamycin complex 1 (mTORC1) inhibitor rapamycin slows progression of these diseases but is not curative and associated with notable toxicity at clinically effective doses, highlighting the need for better understanding LAM's molecular etiology. We report here that LAM lesions and angiomyolipomas overexpress urokinase-type plasminogen activator (uPA). Tsc1-/- and Tsc2-/- mouse embryonic fibroblasts expressed higher uPA levels than their WT counterparts, resulting from the TSC inactivation. Inhibition of uPA expression in Tsc2-null cells reduced the growth and invasiveness and increased susceptibility to apoptosis. However, rapamycin further increased uPA expression in TSC2-null tumor cells and immortalized TSC2-null angiomyolipoma cells, but not in cells with intact TSC. Induction of glucocorticoid receptor signaling or forkhead box (FOXO) 1/3 inhibition abolished the rapamycin-induced uPA expression in TSC-compromised cells. Moreover, rapamycin-enhanced migration of TSC2-null cells was inhibited by the uPA inhibitor UK122, dexamethasone, and a FOXO inhibitor. uPA-knock-out mice developed fewer and smaller TSC2-null lung tumors, and introduction of uPA shRNA in tumor cells or amiloride-induced uPA inhibition reduced tumorigenesis in vivo These findings suggest that interference with the uPA-dependent pathway, when used along with rapamycin, might attenuate LAM progression and potentially other TSC-related disorders.

Keywords: TOR complex (TORC); lung; mTOR complex (mTORC); mammalian target of rapamycin (mTOR); plasminogen; tuberous sclerosis complex (TSC); tumor cell biology; urokinase receptor.


Conflict of interest statement

The authors declare that they have no conflicts of interest with the contents of this article

Figures

Figure 1.
Figure 1.
Up-regulation of uPA in human LAM and angiomyolipoma tissue samples. A, normal human lung; B, human LAM nodules; C, normal human kidney; and D, renal angiomyolipoma. uPA was detected using a mouse anti-uPA monoclonal antibody (mAb) followed by Vectastain ABC combined with the Alexa Fluor 488-tyramide amplification system (green). SM α-actin was detected using Cy3-conjugated mouse SM α-actin mAb (red). Nuclei were counterstained with DAPI (blue) (upper panels). Total mouse IgG served as the negative controls for uPA staining, and Cy3-conjugated mouse anti-SM α-actin mAb was used to locate the same tumor nodules in serial sections (bottom panels). Additional serial sections were incubated with Cy3-conjugated total mouse IgG as the negative control for SM α-actin staining (data not shown). Images were taken using an LSM710 microscope. Scale bar, 50 μm. Data shown are representative of six LAM lesions from four patients and four angiomyolipomas from individual patients.
Figure 2.
Figure 2.
A and B, TSC1/2 deficiency induces overexpression of uPA. A, Western blot analysis of uPA and TSC1 expression in WT and Tsc1−/− MEFs. Total S6 served as the loading control. B, uPA and TSC2 expression in Tsc2+/+/p53−/− and Tsc2−/−/p53−/− MEFs. Total S6 served as the loading control. C, knocking down TSC2 induces overexpression of uPA in wild-type MEFs. Western blot analysis of uPA, phospho-S6, and TSC2 expression in WT (Tsc1+/+) MEFs transfected with lentiviruses encoding control shRNA and Tsc2 shRNA. Total S6 served as the loading control. D and E, inhibition of TORC1 by rapamycin further up-regulates uPA in TSC-deficient MEFs. uPA, pS6 (phospho-S-235/236), total S6, GAPDH, TSC1, or TSC2 were detected in lysates of cells incubated for 24 h in the absence or presence of the indicated concentrations of rapamycin. D, Tsc1−/− and Tsc1+/+ MEFs; E, Tsc2+/+/p53−/− and Tsc2−/−/p53−/− MEFs. The vertical black lines indicate that the molecular weight standards were run together with the other samples but were non-contiguous on the gel. The fold-increase in expression of uPA is shown above the panel illustrating the uPA WB.
Figure 3.
Figure 3.
Inhibition of TORC1 and TORC2 further up-regulates uPA in TSC2-null tumor cells. uPA, pS6 (phospho-S235/236), and total S6 were detected in lysates of cells incubated for 24 h in the absence or presence of the indicated concentrations of rapamycin. A, TSC2-null tumor cells; B, immortalized TSC2-null human AML cells; C, TSC2-negative rat ELT3 cells. The vertical black lines indicate that the molecular weight standards were run together with the other samples but were non-contiguous on the gel. D, time course of uPA induction by 100 nm rapamycin in TSC2-null tumor cells. uPA, pS6, and total S6 were detected in lysates of TSC2-null mouse tumor cells treated with 100 nm rapamycin for indicated periods of time. E, uPA, pS6, total S6, and GAPDH were detected in lysates of TSC2-null mouse tumor cells treated with TORC1 and TORC2 inhibitor Torin-1. F, rapamycin-induced increase of uPA is PI3K/Akt- and ERK1,2-independent. TSC2-null tumor cells were starved in DMEM, 0.1% BSA for 24 h, pre-treated with MEK inhibitor PD98059 (50 mm), AKT inhibitor 1-l-6-hydroxymethyl-chiro-inositol-2-[(R)-2-O-methyl-3-O-octadecylcarbonate] (AKTi) (10 mm), and PI3K inhibitor LY294002 (10 mm) for 30 min and then by rapamycin (20 nm) or vehicle (DMSO) for 18 h in presence of the above inhibitors. Cells were lysed in RIPA buffer, and the indicated proteins were detected in lysates by WB. Black vertical line represents indication that the lanes and the molecular weight standards were run on the same gel but were non-contiguous. The fold-increase in expression of uPA is shown above the panel illustrating the uPA WB.
Figure 4.
Figure 4.
FOXO1/3- and glucocorticoid receptor-mediated signaling drive rapamycin-induced uPA overexpression in TSC-deficient cells. TSC2-null tumor cells were starved in DMEM, 0.1% BSA for 24 h, pre-incubated with simvastatin (10 μm), PD98059 (50 μm), AS184856 (FOXOi, 1 μm) (A); dorsomorphin (20 μm) (B); GSK650394 (GSKi, 50 μm) or dexamethasone (Dex, 1 μm) (C) for 30 min and then rapamycin (20 nm) or vehicle (DMSO) was added for 18 h in presence of these inhibitors. D, TSC2-null tumor cells were starved in DMEM, 0.1% BSA for 24 h and exposed to rapamycin (Rapa, 20 nm) or vehicle for 24 h, and the media were replaced with fresh DMEM, 0.1% BSA supplemented with either vehicle (ethanol) or dexamethasone (Dex, 1 μm) for additional 24 h. Cells were lysed in RIPA buffer and uPA, pS6 (as an efficacy control for rapamycin (78)), pERK1,2, pFOXO3(Ser-315) (as an efficacy control for SGKi (68)), pFOXO1(Thr-24)/pFOXO3(Thr-32), phospho-RAPTOR(Ser-792) (as an efficacy control for AMPK inhibitor dorsomorphin (66)), and total S6, ERK1,2 RAPTOR, RICTOR (as an efficacy control for FOXO1/3 inhibitor (121)), and FOXO3 were detected in lysates by Western blotting as in Fig. 3. The fold-increase in expression of uPA is shown above the panel illustrating the uPA WB. E, qRT-PCR analysis of Plau mRNA in TSC2-null cells treated with rapamycin in the absence or presence of AS184856 (FOXOi, 1 μm), dorsomorphin (AMPKi, 20 μm), or dexamethasone (Dex, 1 μm) as in A–C. Results are expressed as the relative arbitrary units calculated relative to β-actin. Experiments were performed in three biological replicates. *, p < 0.05. F, down-regulation of FOXO3 expression results in inhibition of basal expression of uPA in TSC2-null cells. Cells were transfected with lentivirus encoding either control sh RNA (consh) or mouse FOXO3-targeting shRNA (FOXO3sh) and selected using 2 μg/ml puromycin. Lysates of the cells were analyzed by WB as in A.
Figure 5.
Figure 5.
Rapamycin increases the migration and invasion of TSC2-null cells in a uPA-dependent manner. TSC2-null tumor cells were starved in DMEM, 0.1% BSA for 24 h and incubated with either dexamethasone (Dex, 1 μm) or AS184856 (FOXOi, 1 μm) for 30 min, and then rapamycin (20 nm) or vehicle (DMSO) was added for an additional 18 h. The cells were detached with trypsin/EDTA, washed in starvation medium, and resuspended in the same medium alone or in the presence of the uPA inhibitor UK122. Cell migration and invasion were assessed as described under “Experimental procedures.” Cells that had undergone migration were photographed and counted using the EVOS FL Auto Imaging System microscope software Auto count mode. Each condition was set up in three wells, and three images were taken at different sites within each transwell. The bar graphs on left and right show fold-change in the number of cells per microscopic field that migrated (A) or invaded (B) the Matrigel, respectively, in response to serum (mean ± S.E.). Few cells migrated in starvation medium (2–3 per microscopic field), and therefore these results do not appear on the graph. *, p < 0.001.
Figure 6.
Figure 6.
Attenuation of TSC2-null tumor growth in uPA−/− mice. WT (n = 5) and uPA−/− (n = 5) mice were given an i.v. injection of equal numbers of TSC2-null tumor cells. Twenty days post-injection, the chest was opened, and the lungs were photographed and taken for analysis. A, representative images of the lungs. B, representative images of H&E-stained lungs collected on day 20 after injection of tumor cells from a WT mouse (top) and an uPA−/− mouse (bottom). Images taken using EVOS® FL Auto Cell Imaging System with a ×4 objective were stitched using Scan and Stitch function of EVOS® FL software (left). An individual representative image taken at ×4 magnification is presented on the right. Scale bar, 1000 μm. C, quantification of nodule area. The y axis shows the values calculated as the ratio between the area of the nodules and the entire lung area measured in square pixels, the mean value ± S.D. Sections, obtained at five levels for each lung, were analyzed. Lungs of three animals were analyzed in each group. *, p < 0.01.
Figure 7.
Figure 7.
Down-regulation of uPA expression decreases growth rate and invasiveness and sensitizes TSC2-null tumor cells to apoptosis. A, Western blot analysis of uPA, pS6 (phospho-S235/236), S6, pERK1,2 (phospho-p44/42 MAPK (phospho-Thr-202/Tyr-04)), ERK-1,2, and GAPDH expression in lysates obtained from Control sh LV- and uPA sh LV-infected TSC2-null tumor cells. B, analysis of migration of control-sh and uPA-sh tumor cells. The plot shows number of cells that migrated through the 8-μm porous membrane of the FluoroBlokTM transwells toward media supplemented with 10% FCS or serum-free media visualized by loading with calcein and DAPI. Results are shown as the number of cells counted per microscopic field and as the mean ± S.D. Four wells were analyzed per each cell type. Three microscopic fields per each well were quantified. *, p < 0.05. C, analysis of growth of TSC2-null/uPA sh and TSC2-null/con sh cells assessed after 48 and 96 h using CellTiter-Glo® luminescent cell viability assay. Results are expressed as relative luminescence units (RLU) measured directly using a luminometer. D, apoptosis of TSC2-null/uPA sh and TSC2-null/con sh cells after incubation with the indicated concentrations of simvastatin assessed after 24 h using Caspase Glo® 3/7 assay. Results are expressed as relative luminescence units. The mean ± S.E. of an experiment representative of three performed is shown. *, p < 0.05 versus control.
Figure 8.
Figure 8.
Molecular or pharmacological targeting of uPA with shRNA and/or amiloride significantly inhibits growth of TSC2-null lung lesions. Equal numbers of TSC2-null/uPA sh and TSC2-null/con sh cells were injected in WT mice as in Fig. 6A. A, representative images are shown of H&E-stained sections of the lungs after injection of control-sh or uPA-sh tumor cells. Images taken using EVOS® FL auto cell imaging system with a ×4 objective were stitched using Scan and Stitch function of EVOS® FL software (left). An individual representative image taken at ×4 magnification is presented on right. Scale bar, 1000 μm. B, quantification of nodule area. The y axis shows the values calculated as the ratio between the area of the nodules and the entire lung area measured in square pixels and normalized, the mean value ± S.D. Sections obtained at five levels from each lung were analyzed for each of nine animals in the group injected with control sh LV-cells and four animals injected with uPA sh LV-infected TSC2-null tumor cells. *, p < 0.01. C and D, inhibition of TSC2-null tumor growth by amiloride. TSC2-null cells were injected in WT mice as in Fig. 6A. Mice received 10 mg/kg amiloride or vehicle alone daily as described under “Experimental procedures.” C, representative images of H&E-stained sections of the lungs of the vehicle- and amiloride-treated mice are shown. Images were taken using Olympus SZX-16 stereomicroscope equipped with Axiocam HRC camera (Carl Zeiss) and were recorded using Carl Zeiss Axio Vision 3.1 software. D, quantification of the areas occupied by nodules in six vehicle-treated and four amiloride-treated animals was performed as in Fig. 6B. Lungs of four of eight amiloride-treated animals did not contain detectable tumor nodules, an outcome that was never observed in vehicle-treated animals. The y axis shows the values calculated as the ratio between the area of the nodules and the entire lung area measured in square pixels and normalized, the mean value ± S.D. Sections, obtained at five levels for each lung, were analyzed. *, p < 0.02.

Similar articles

Cited by

References

    1. Krymskaya V. P., and McCormack F. X. (2017) Lymphangioleiomyomatosis: a monogenic model of malignancy. Annu. Rev. Med. 68, 69–83 - PMC - PubMed
    1. Knudson A. G. (2001) Two genetic hits (more or less) to cancer. Nat. Rev. Cancer 1, 157–162 - PubMed
    1. Tay Y., Tan S. M., Karreth F. A., Lieberman J., and Pandolfi P. P. (2014) Characterization of dual PTEN and p53-targeting microRNAs identifies microRNA-638/Dnm2 as a two-hit oncogenic locus. Cell Rep. 8, 714–722 - PMC - PubMed
    1. Liu R., Kain M., and Wang L. (2012) Inactivation of X-linked tumor suppressor genes in human cancer. Future Oncol. 8, 463–481 - PMC - PubMed
    1. McCormack F. X. (2008) Lymphangioleiomyomatosis: a clinical update. Chest 133, 507–516 - PubMed

Publication types

MeSH terms

LinkOut - more resources