

Mathematical modeling of white adipocyte exocytosis predicts adiponectin secretion and quantifies the rates of vesicle exo- and endocytosis
- PMID: 28972187
- PMCID: PMC5723991
- DOI: 10.1074/jbc.M117.801225
Mathematical modeling of white adipocyte exocytosis predicts adiponectin secretion and quantifies the rates of vesicle exo- and endocytosis
Abstract
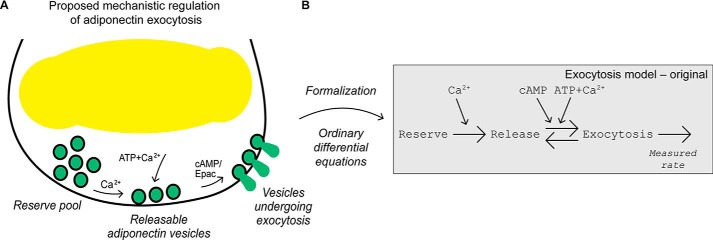
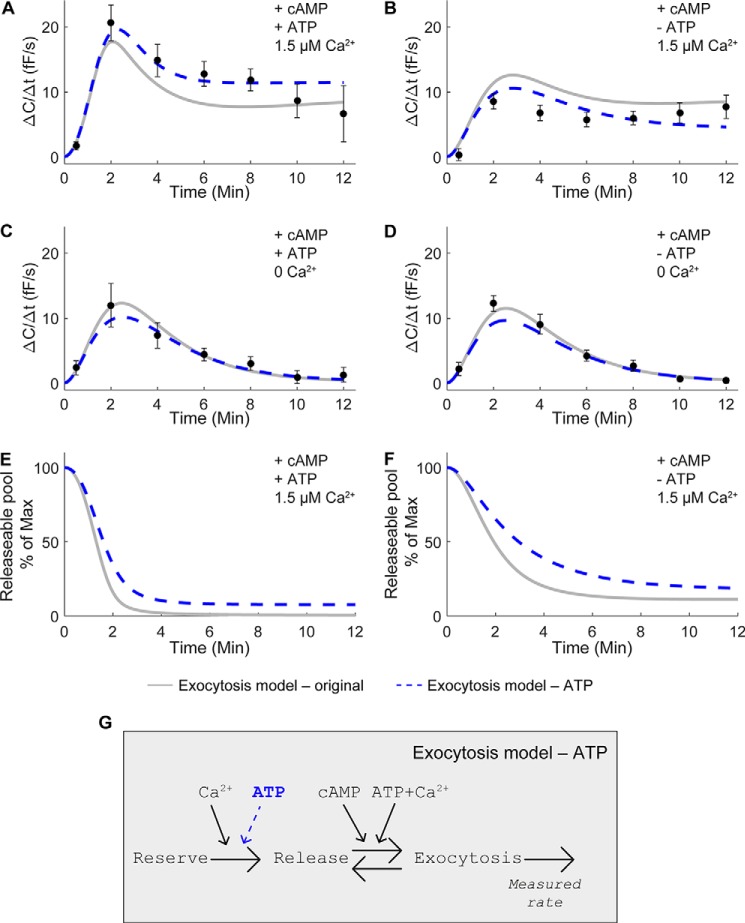
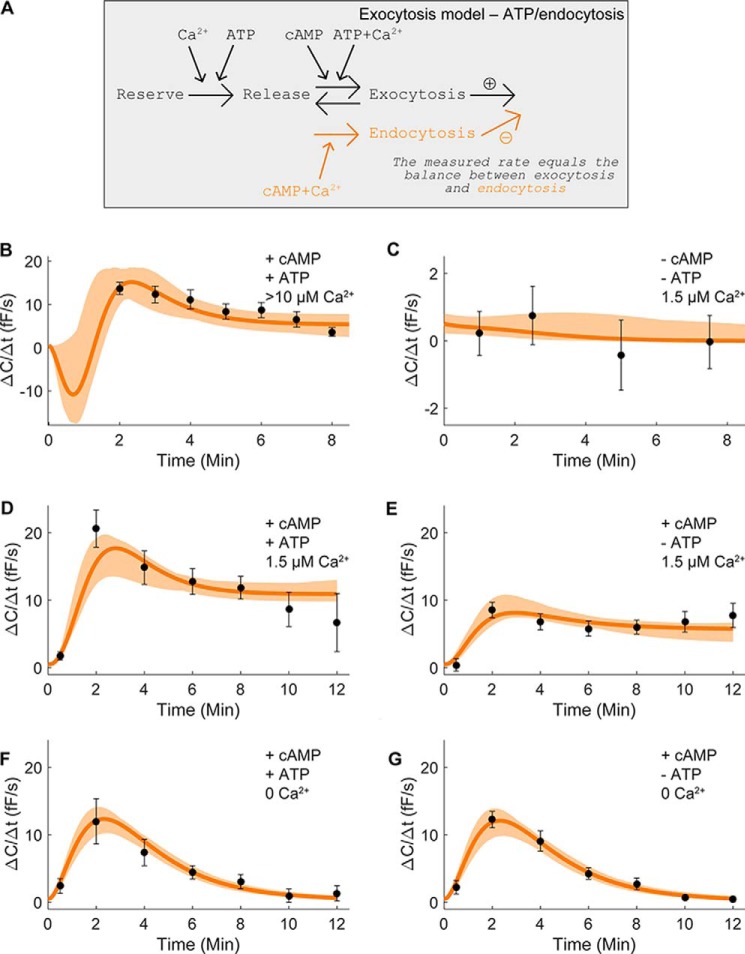
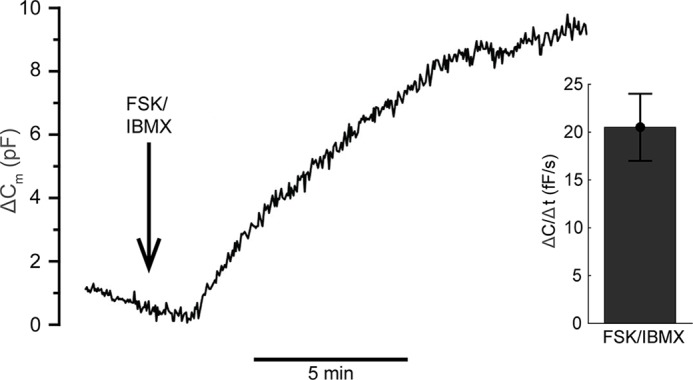
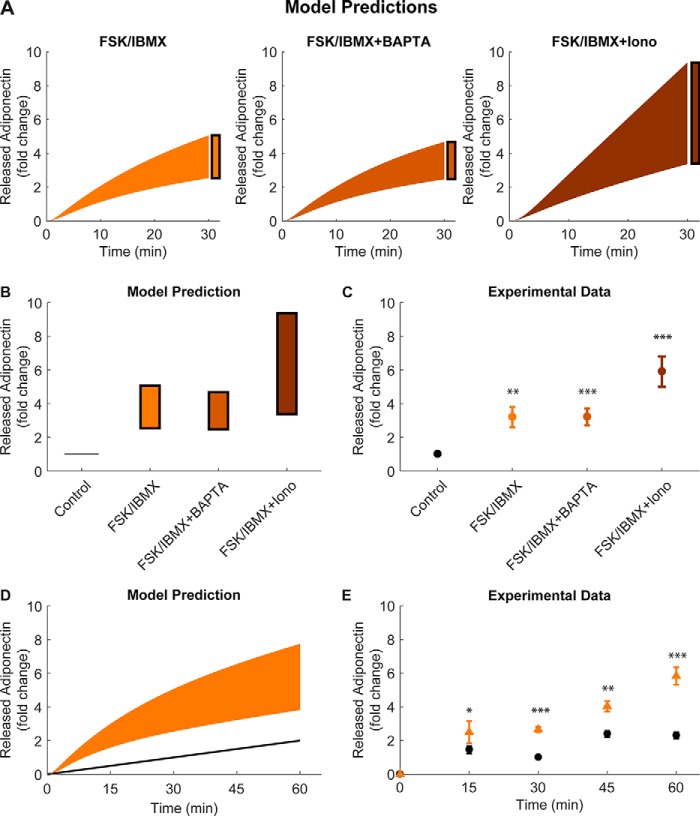
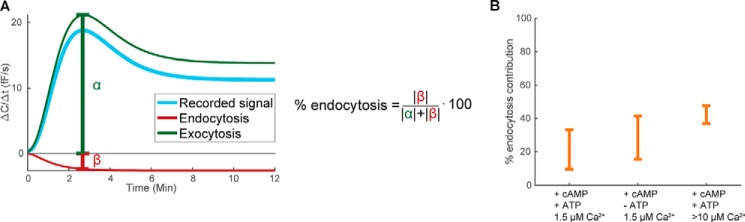
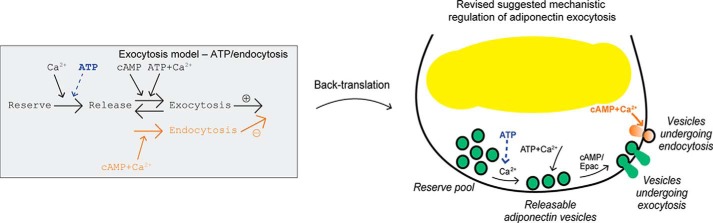
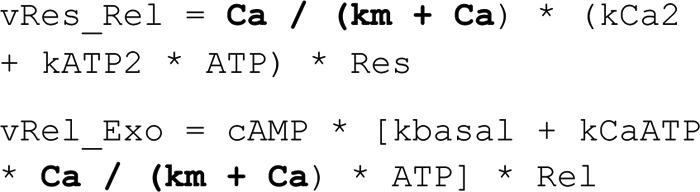
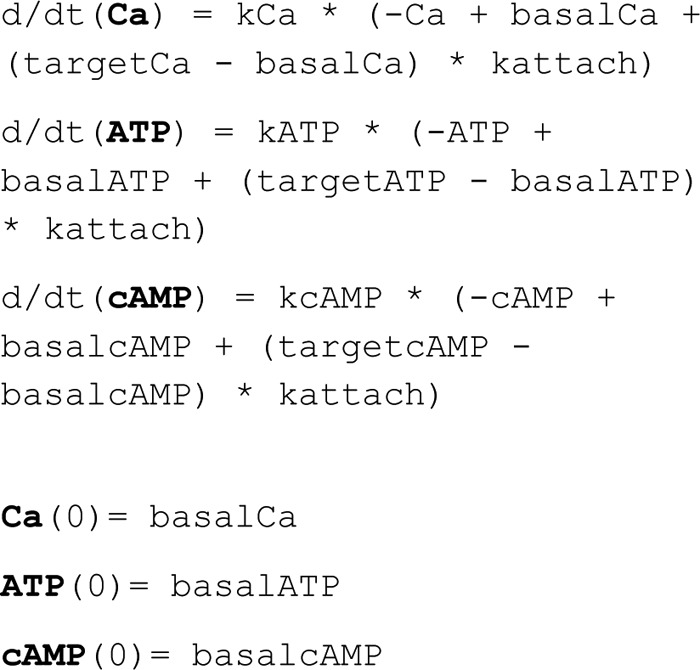
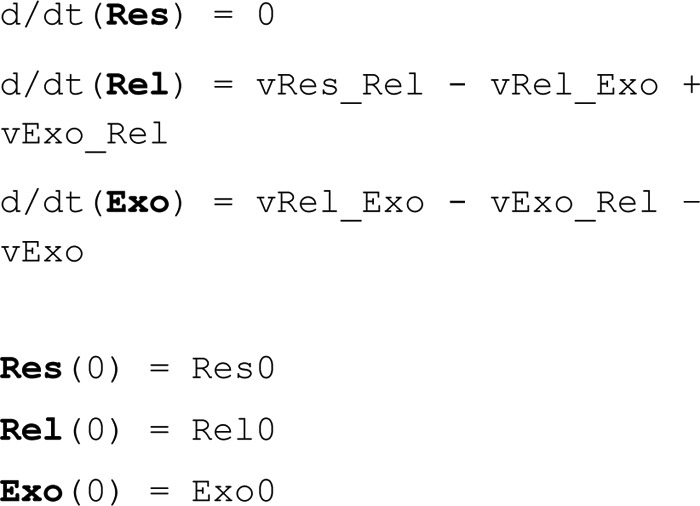
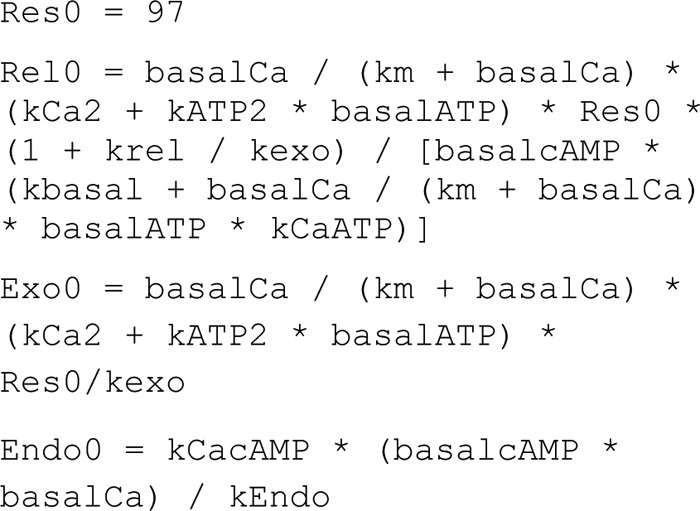
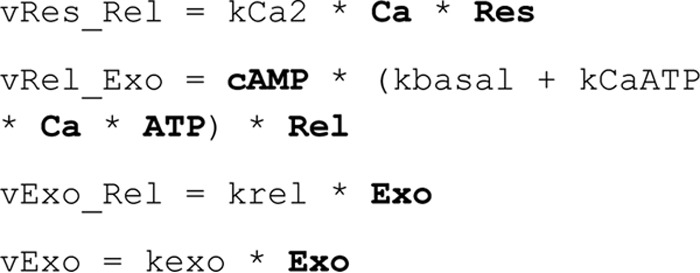
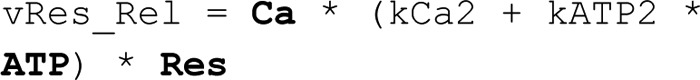
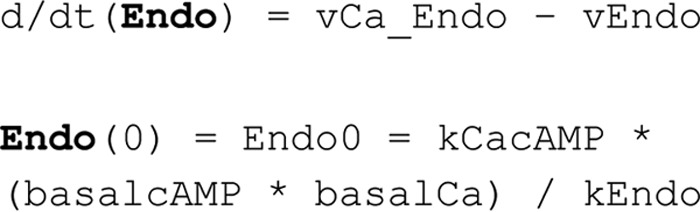
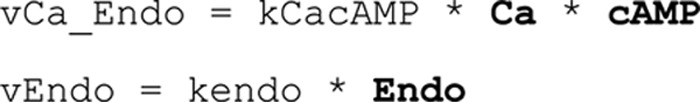
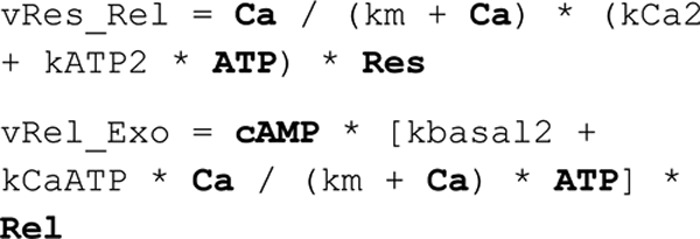
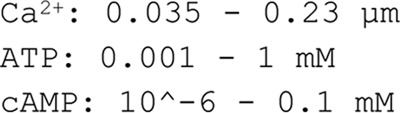
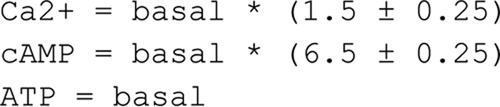
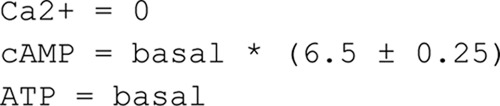
Adiponectin is a hormone secreted from white adipocytes and takes part in the regulation of several metabolic processes. Although the pathophysiological importance of adiponectin has been thoroughly investigated, the mechanisms controlling its release are only partly understood. We have recently shown that adiponectin is secreted via regulated exocytosis of adiponectin-containing vesicles, that adiponectin exocytosis is stimulated by cAMP-dependent mechanisms, and that Ca2+ and ATP augment the cAMP-triggered secretion. However, much remains to be discovered regarding the molecular and cellular regulation of adiponectin release. Here, we have used mathematical modeling to extract detailed information contained within our previously obtained high-resolution patch-clamp time-resolved capacitance recordings to produce the first model of adiponectin exocytosis/secretion that combines all mechanistic knowledge deduced from electrophysiological experimental series. This model demonstrates that our previous understanding of the role of intracellular ATP in the control of adiponectin exocytosis needs to be revised to include an additional ATP-dependent step. Validation of the model by introduction of data of secreted adiponectin yielded a very close resemblance between the simulations and experimental results. Moreover, we could show that Ca2+-dependent adiponectin endocytosis contributes to the measured capacitance signal, and we were able to predict the contribution of endocytosis to the measured exocytotic rate under different experimental conditions. In conclusion, using mathematical modeling of published and newly generated data, we have obtained estimates of adiponectin exo- and endocytosis rates, and we have predicted adiponectin secretion. We believe that our model should have multiple applications in the study of metabolic processes and hormonal control thereof.
Keywords: adipocyte; adipokine; adiponectin; electrophysiology; endocytosis; exocytosis; mathematical modeling.
© 2017 by The American Society for Biochemistry and Molecular Biology, Inc.
Conflict of interest statement
AstraZeneca provided support in the form of salary for author E. N
Figures


Similar articles
-
PKA-independent cAMP stimulation of white adipocyte exocytosis and adipokine secretion: modulations by Ca2+ and ATP.J Physiol. 2014 Dec 1;592(23):5169-86. doi: 10.1113/jphysiol.2014.280388. Epub 2014 Sep 5. J Physiol. 2014. PMID: 25194045 Free PMC article.
-
A systems biology analysis of adrenergically stimulated adiponectin exocytosis in white adipocytes.J Biol Chem. 2021 Nov;297(5):101221. doi: 10.1016/j.jbc.2021.101221. Epub 2021 Sep 29. J Biol Chem. 2021. PMID: 34597667 Free PMC article.
-
Noradrenaline and ATP regulate adiponectin exocytosis in white adipocytes: Disturbed adrenergic and purinergic signalling in obese and insulin-resistant mice.Mol Cell Endocrinol. 2022 Jun 1;549:111619. doi: 10.1016/j.mce.2022.111619. Epub 2022 Mar 22. Mol Cell Endocrinol. 2022. PMID: 35337901
-
Vesicle fusion and fission in plants and yeast.Cell Calcium. 2017 Nov;67:40-45. doi: 10.1016/j.ceca.2017.08.007. Epub 2017 Aug 24. Cell Calcium. 2017. PMID: 29029789 Review.
-
Exocytosis and endocytosis in juxtaglomerular cells.Acta Physiol Scand. 2000 Jan;168(1):95-9. doi: 10.1046/j.1365-201x.2000.00645.x. Acta Physiol Scand. 2000. PMID: 10691785 Review.
Cited by
-
Mechanistic model for human brain metabolism and its connection to the neurovascular coupling.PLoS Comput Biol. 2022 Dec 22;18(12):e1010798. doi: 10.1371/journal.pcbi.1010798. eCollection 2022 Dec. PLoS Comput Biol. 2022. PMID: 36548394 Free PMC article.
-
A comprehensive mechanistic model of adipocyte signaling with layers of confidence.NPJ Syst Biol Appl. 2023 Jun 7;9(1):24. doi: 10.1038/s41540-023-00282-9. NPJ Syst Biol Appl. 2023. PMID: 37286693 Free PMC article.
-
Exocytosis and Endocytosis: Yin-Yang Crosstalk for Sculpting a Dynamic Growing Pollen Tube Tip.Front Plant Sci. 2020 Oct 6;11:572848. doi: 10.3389/fpls.2020.572848. eCollection 2020. Front Plant Sci. 2020. PMID: 33123182 Free PMC article. Review.
-
Adrenergic stimulation of adiponectin secretion in visceral mouse adipocytes is blunted in high-fat diet induced obesity.Sci Rep. 2019 Jul 23;9(1):10680. doi: 10.1038/s41598-019-47113-8. Sci Rep. 2019. PMID: 31337827 Free PMC article.
-
Molecular tracking of insulin resistance and inflammation development on visceral adipose tissue.Front Immunol. 2023 Mar 21;14:1014778. doi: 10.3389/fimmu.2023.1014778. eCollection 2023. Front Immunol. 2023. PMID: 37026009 Free PMC article.
References
-
- Li S., Shin H. J., Ding E. L., and van Dam R. M. (2009) Adiponectin levels and risk of type 2 diabetes: a systematic review and meta-analysis. JAMA 302, 179–188 - PubMed
-
- Burgoyne R. D., and Morgan A. (2003) Secretory granule exocytosis. Physiol. Rev. 83, 581–632 - PubMed
-
- Bose A., Guilherme A., Huang S., Hubbard A. C., Lane C. R., Soriano N. A., and Czech M. P. (2005) The v-SNARE Vti1a regulates insulin-stimulated glucose transport and Acrp30 secretion in 3T3-L1 adipocytes. J. Biol. Chem. 280, 36946–36951 - PubMed
MeSH terms
Substances
LinkOut - more resources
Full Text Sources
Other Literature Sources
Miscellaneous
