

Role of Brf1 interaction with ERα, and significance of its overexpression, in human breast cancer
- PMID: 28972307
- PMCID: PMC5709663
- DOI: 10.1002/1878-0261.12141
Role of Brf1 interaction with ERα, and significance of its overexpression, in human breast cancer
Abstract
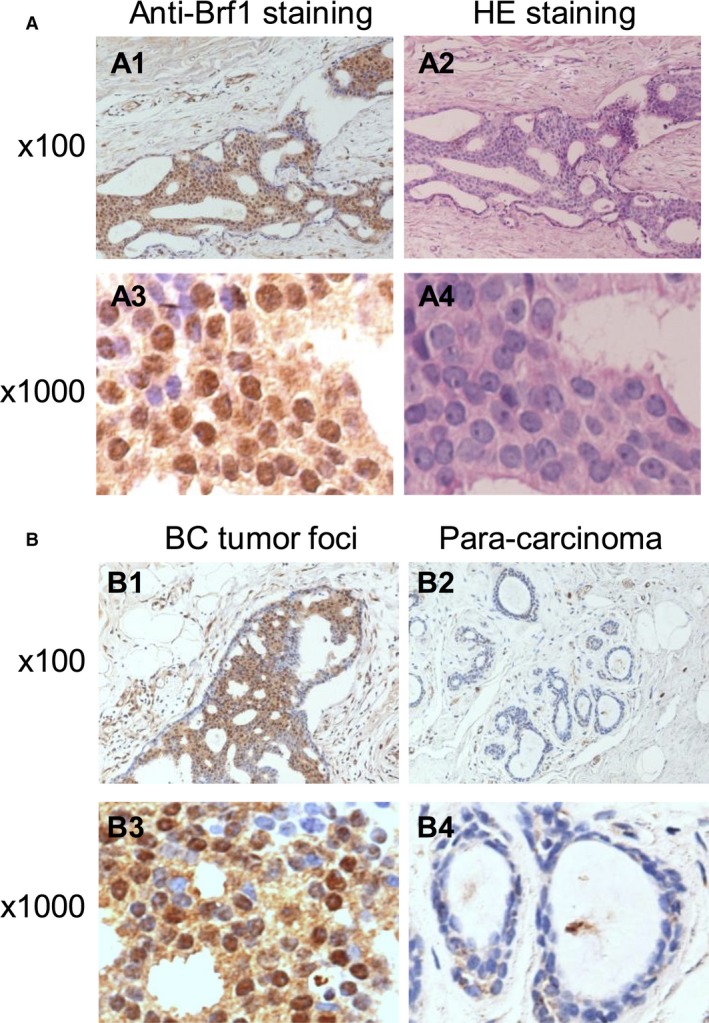
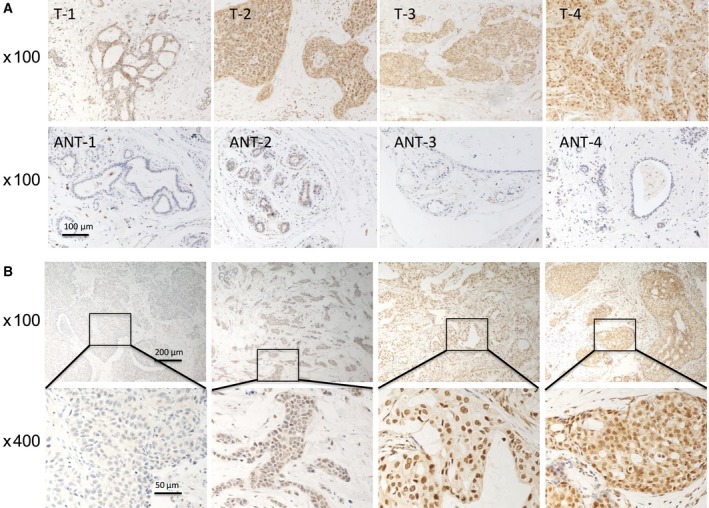
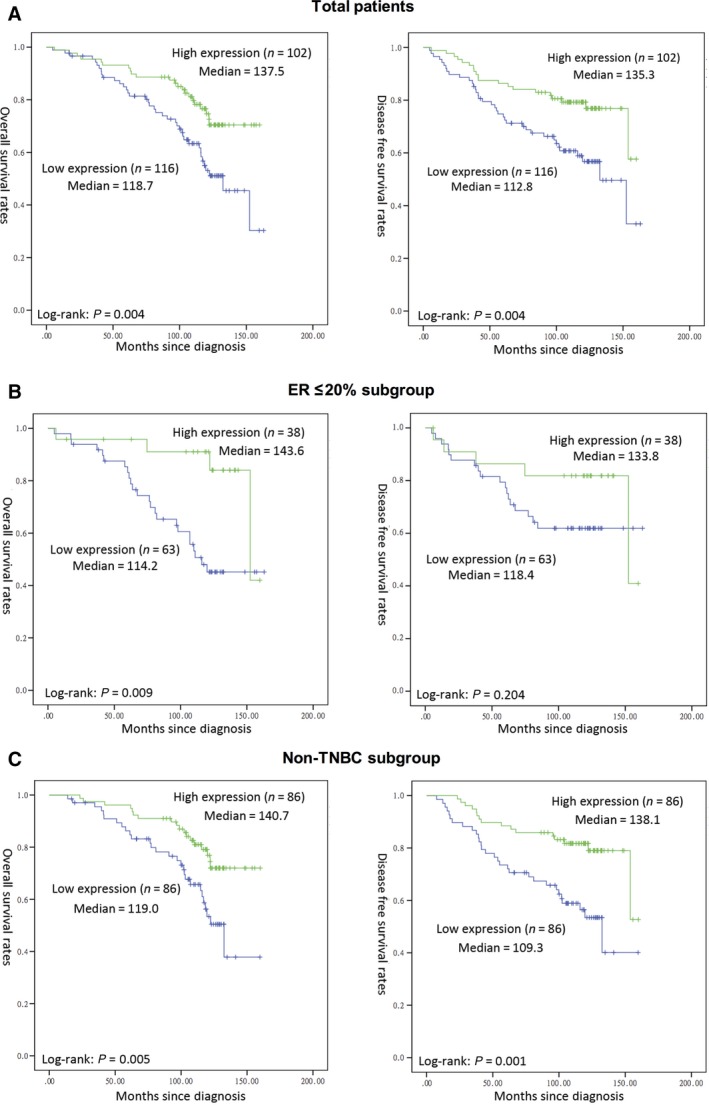
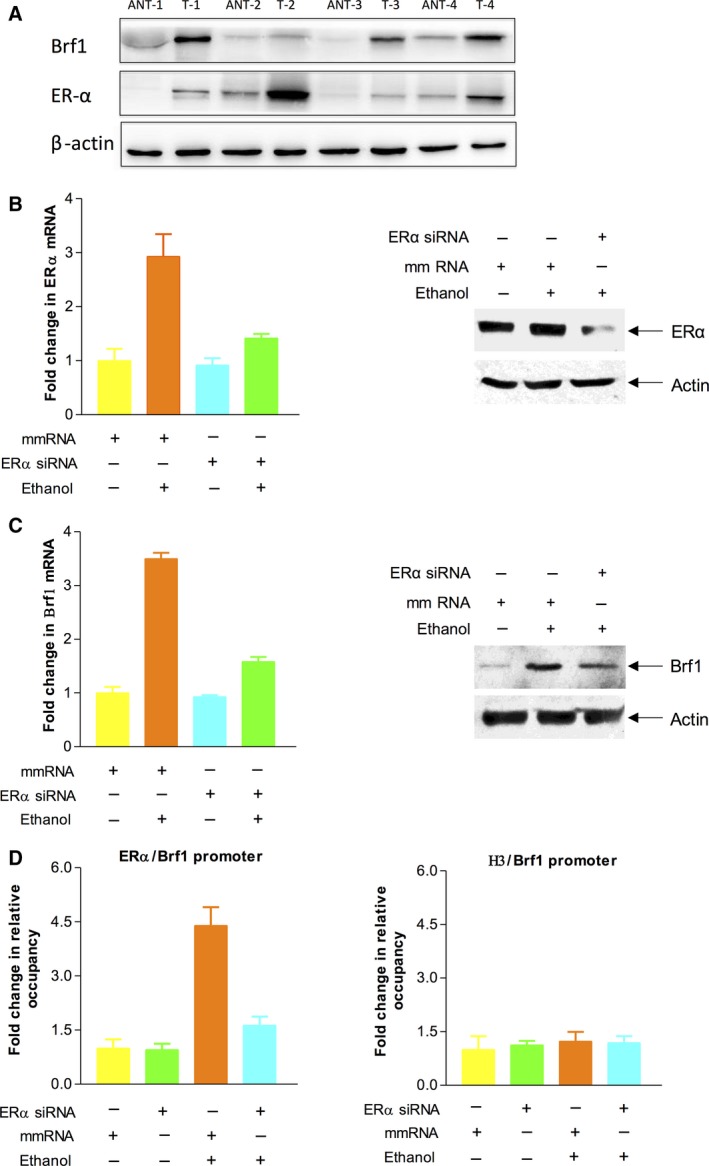
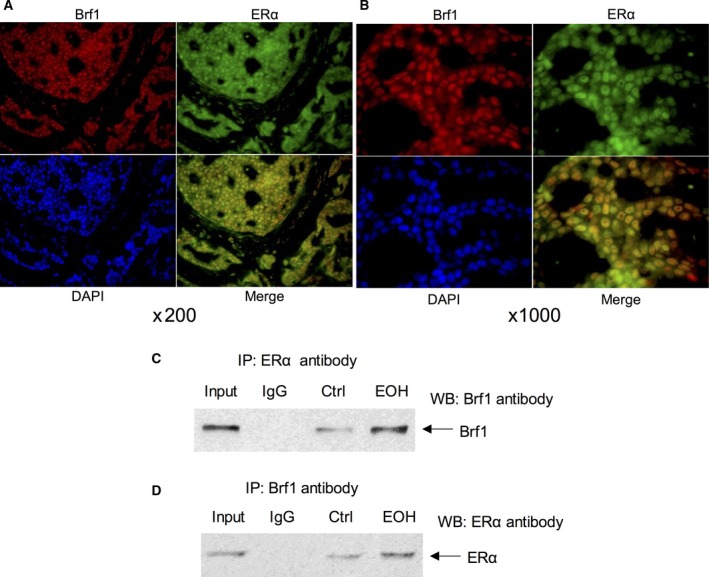
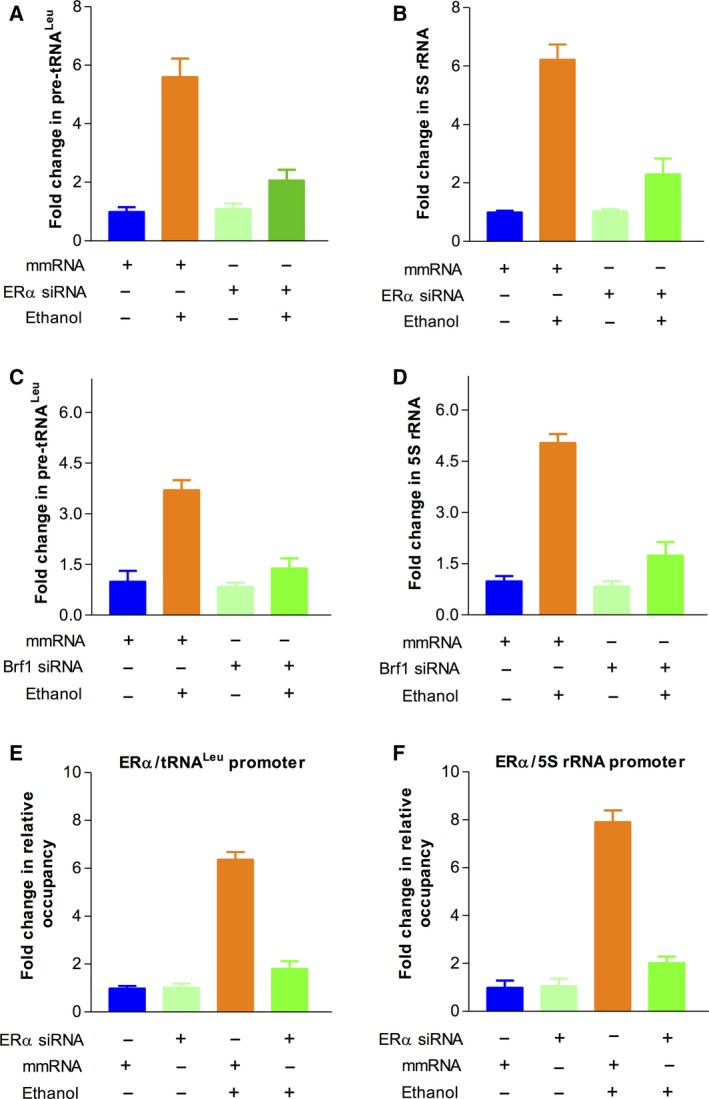
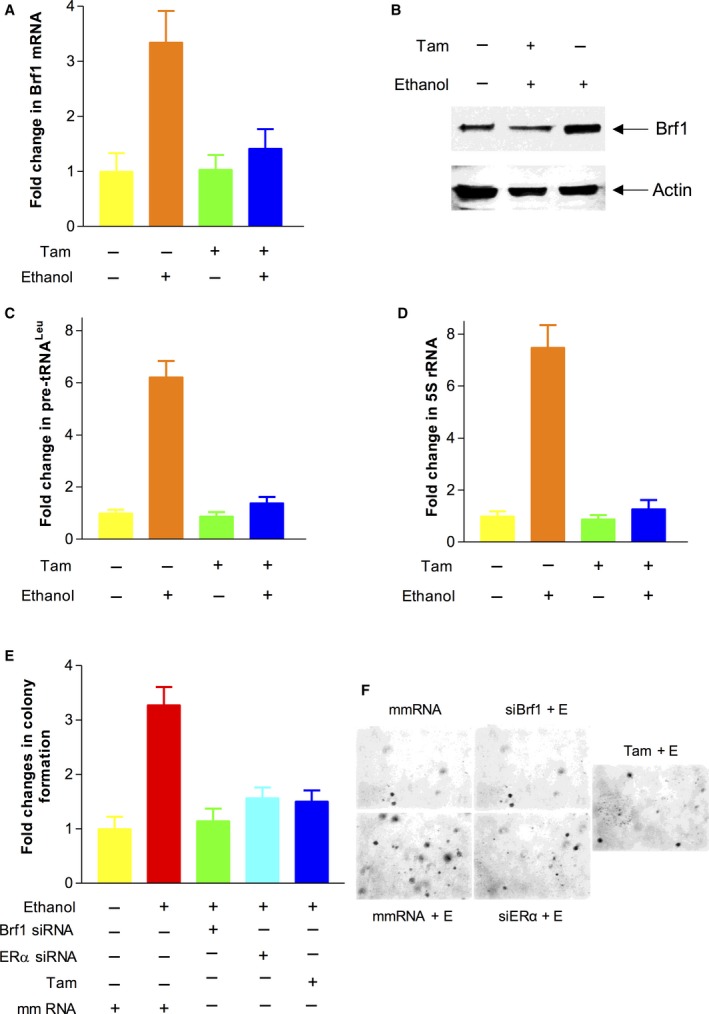
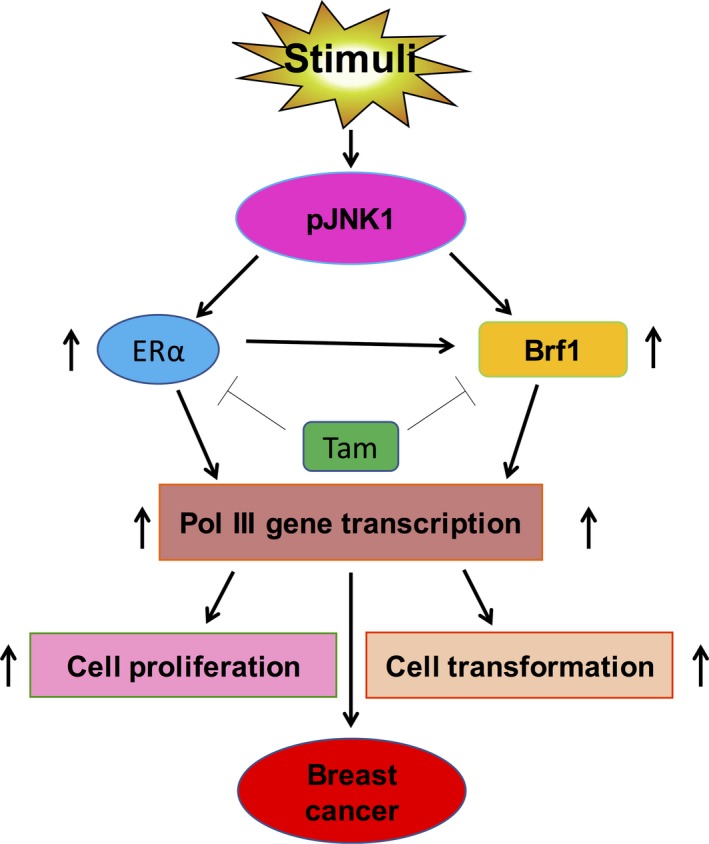
TFIIB-related factor 1 (Brf1) modulates the transcription of RNA Pol III genes (polymerase-dependent genes). Upregulation of Pol III genes enhances tRNA and 5S RNA production and increases the translational capacity of cells to promote cell transformation and tumor development. However, the significance of Brf1 overexpression in human breast cancer (HBC) remains to be investigated. Here, we investigate whether Brf1 expression is increased in the samples of HBC, and we explore its molecular mechanism and the significance of Brf1 expression in HBC. Two hundred and eighteen samples of HBC were collected to determine Brf1 expression by cytological and molecular biological approaches. We utilized colocalization, coimmunoprecipitation, and chromatin immunoprecipitation methods to explore the interaction of Brf1 with estrogen receptor alpha (ERα). We determined how Brf1 and ERα modulate Pol III genes. The results indicated that Brf1 is overexpressed in most cases of HBC, which is associated with an ER-positive status. The survival period of the cases with high Brf1 expression is significantly longer than those with low levels of Brf1 after hormone treatment. ERα mediates Brf1 expression. Brf1 and ERα are colocalized in the nucleus. These results indicate an interaction between Brf1 and ERα, which synergistically regulates the transcription of Pol III genes. Inhibition of ERα by its siRNA or tamoxifen reduces cellular levels of Brf1 and Pol III gene expression and decreases the rate of colony formation of breast cancer cells. Together, these studies demonstrate that Brf1 is a good biomarker for the diagnosis and prognosis of HBC. This interaction of Brf1 with ERα and Brf1 itself are potential therapeutic targets for this disease.
Keywords: Brf1; ERα; Pol III genes; breast cancer; survival period.
© 2017 The Authors. Published by FEBS Press and John Wiley & Sons Ltd.
Figures
Similar articles
-
ROS Signaling-Mediated Novel Biological Targets: Brf1 and RNA Pol III Genes.Oxid Med Cell Longev. 2021 Oct 4;2021:5888432. doi: 10.1155/2021/5888432. eCollection 2021. Oxid Med Cell Longev. 2021. Retraction in: Oxid Med Cell Longev. 2024 Jan 9;2024:9890237. doi: 10.1155/2024/9890237. PMID: 34646425 Free PMC article. Retracted. Review.
-
The significance of Runx2 mediating alcohol-induced Brf1 expression and RNA Pol III gene transcription.Chem Biol Interact. 2020 May 25;323:109057. doi: 10.1016/j.cbi.2020.109057. Epub 2020 Mar 18. Chem Biol Interact. 2020. PMID: 32198086 Free PMC article.
-
Tamoxifen represses alcohol-induced transcription of RNA polymerase III-dependent genes in breast cancer cells.Oncotarget. 2014 Dec 15;5(23):12410-7. doi: 10.18632/oncotarget.2678. Oncotarget. 2014. PMID: 25400119 Free PMC article.
-
ERα mediates alcohol-induced deregulation of Pol III genes in breast cancer cells.Carcinogenesis. 2013 Jan;34(1):28-37. doi: 10.1093/carcin/bgs316. Epub 2012 Oct 10. Carcinogenesis. 2013. PMID: 23054611 Free PMC article.
-
Alcohol Intake and Abnormal Expression of Brf1 in Breast Cancer.Oxid Med Cell Longev. 2019 Oct 31;2019:4818106. doi: 10.1155/2019/4818106. eCollection 2019. Oxid Med Cell Longev. 2019. PMID: 31781337 Free PMC article. Review.
Cited by
-
Role of tRNAs in Breast Cancer Regulation.Adv Exp Med Biol. 2021;1187:121-145. doi: 10.1007/978-981-32-9620-6_6. Adv Exp Med Biol. 2021. PMID: 33983576 Review.
-
ROS Signaling-Mediated Novel Biological Targets: Brf1 and RNA Pol III Genes.Oxid Med Cell Longev. 2021 Oct 4;2021:5888432. doi: 10.1155/2021/5888432. eCollection 2021. Oxid Med Cell Longev. 2021. Retraction in: Oxid Med Cell Longev. 2024 Jan 9;2024:9890237. doi: 10.1155/2024/9890237. PMID: 34646425 Free PMC article. Retracted. Review.
-
Exploring the Role and Mechanism of pAMPKα-Mediated Dysregulation of Brf1 and RNA Pol III Genes.Oxid Med Cell Longev. 2021 Apr 20;2021:5554932. doi: 10.1155/2021/5554932. eCollection 2021. Oxid Med Cell Longev. 2021. PMID: 33995823 Free PMC article.
-
The significance of Runx2 mediating alcohol-induced Brf1 expression and RNA Pol III gene transcription.Chem Biol Interact. 2020 May 25;323:109057. doi: 10.1016/j.cbi.2020.109057. Epub 2020 Mar 18. Chem Biol Interact. 2020. PMID: 32198086 Free PMC article.
-
Oncostatin M expression and TP53 mutation status regulate tumor-infiltration of immune cells and survival outcomes in cholangiocarcinoma.Aging (Albany NY). 2020 Nov 7;12(21):21518-21543. doi: 10.18632/aging.103936. Epub 2020 Nov 7. Aging (Albany NY). 2020. PMID: 33216732 Free PMC article.
References
-
- Babu RI, Naveen Kumar M, Patil RH, Devaraju KS and Ramesh GT (2013) Effect of estrogen and tamoxifen on the expression pattern of AP‐1 factors in MCF‐7 cells: role of c‐Jun, c‐Fos, and Fra‐1 in cell cycle regulation. Mol Cell Biochem 380, 143–151. - PubMed
-
- De Marchi T, Foekens JA, Umar A and Martens JWM (2016) Endocrine therapy resistance in estrogen receptor (ER)‐positive breast cancer. Drug Discov Today 21, 1181–1188. - PubMed
MeSH terms
Substances
Grants and funding
LinkOut - more resources
Full Text Sources
Other Literature Sources
Medical
Miscellaneous
