. 2017 Nov 1;127(11):4059-4074.
doi: 10.1172/JCI94585. Epub 2017 Oct 3.

Divergent effects of glucose and fructose on hepatic lipogenesis and insulin signaling

Affiliations

Divergent effects of glucose and fructose on hepatic lipogenesis and insulin signaling

Samir Softic et al. J Clin Invest. .

Erratum in

Abstract

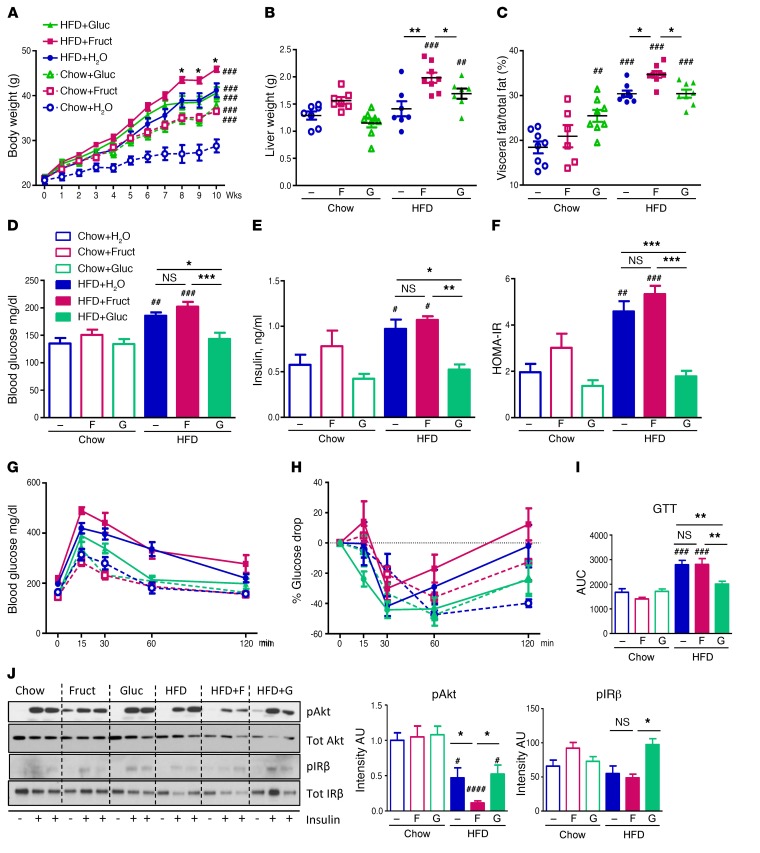
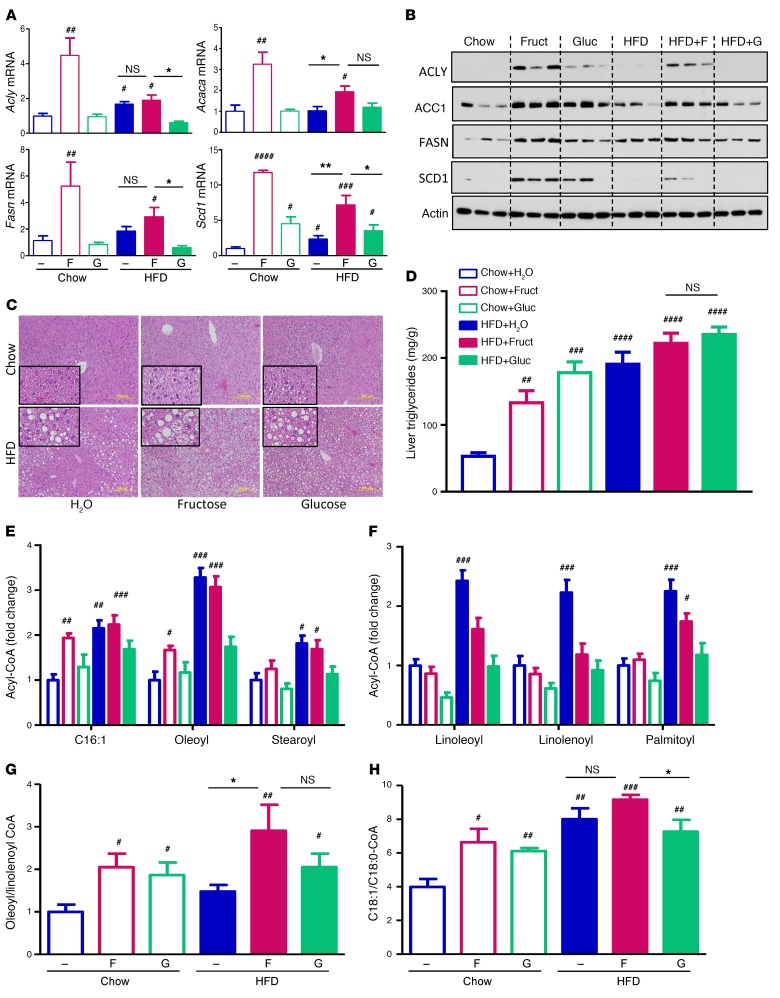
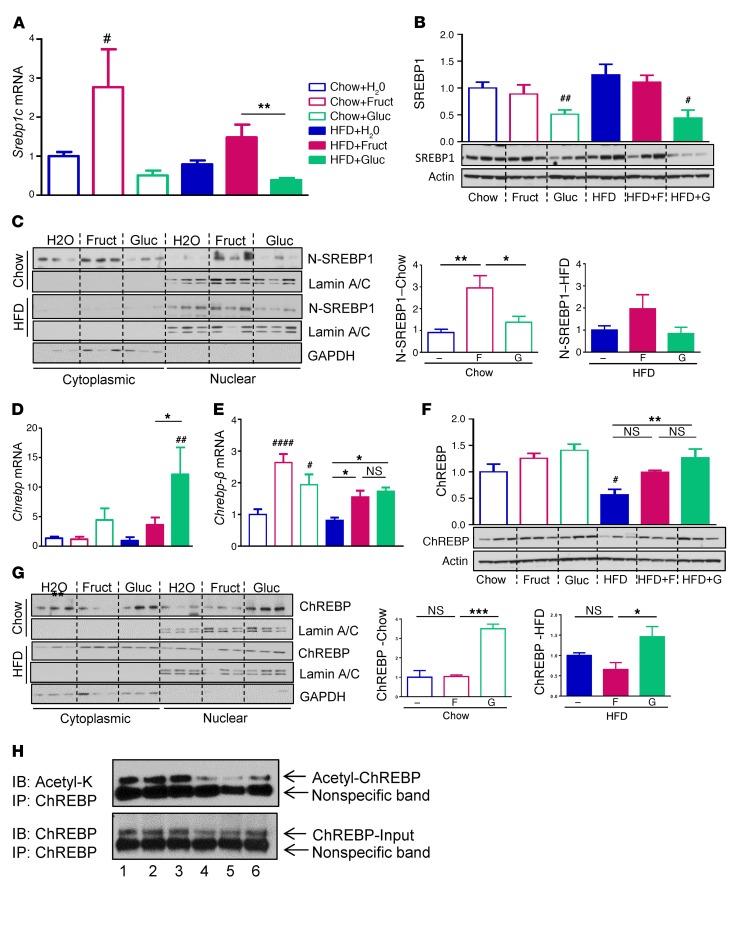
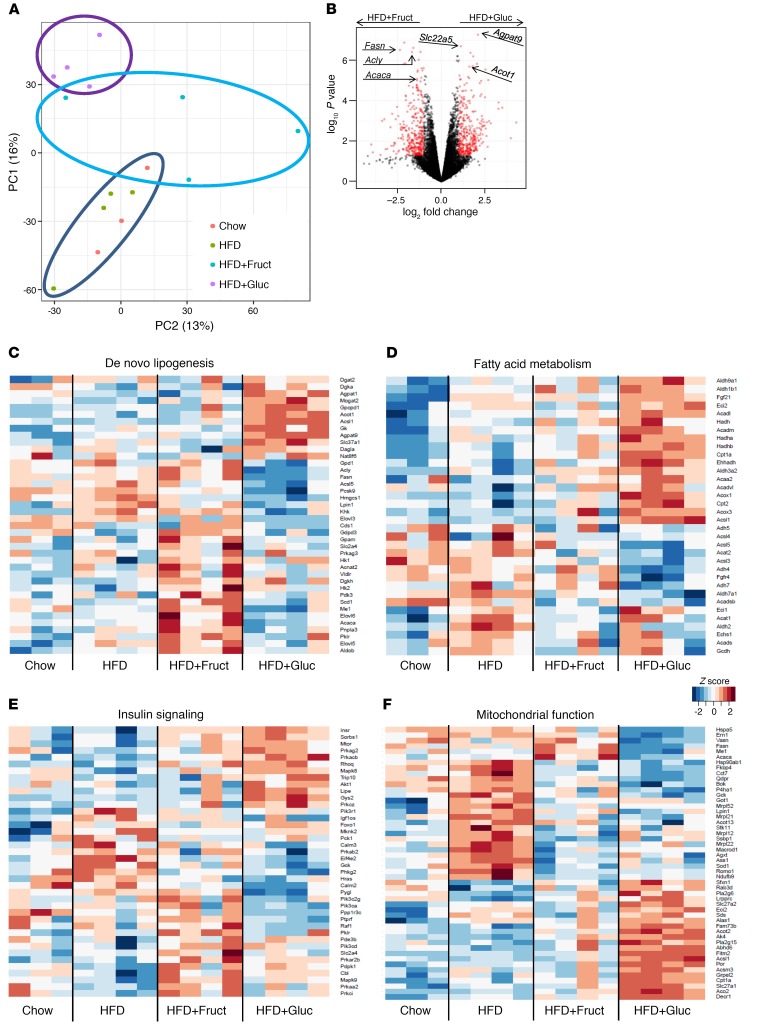
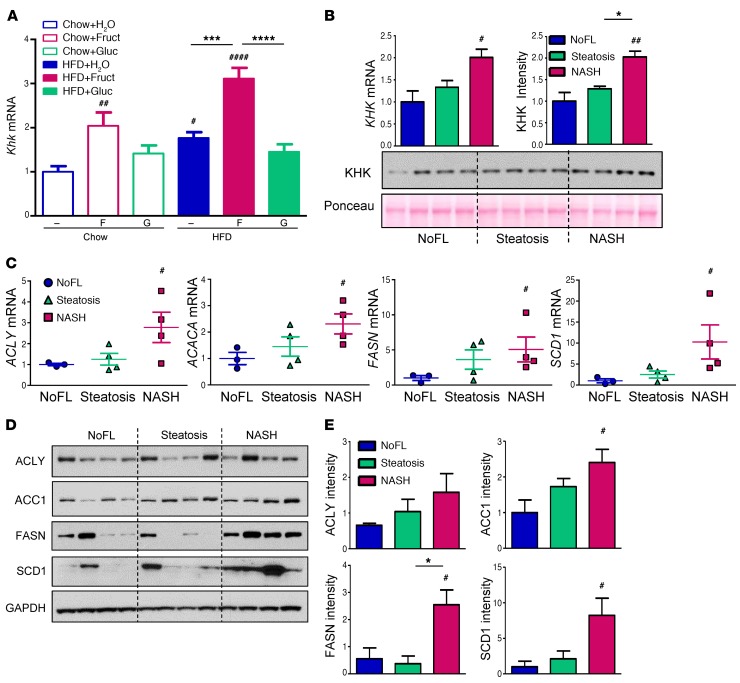
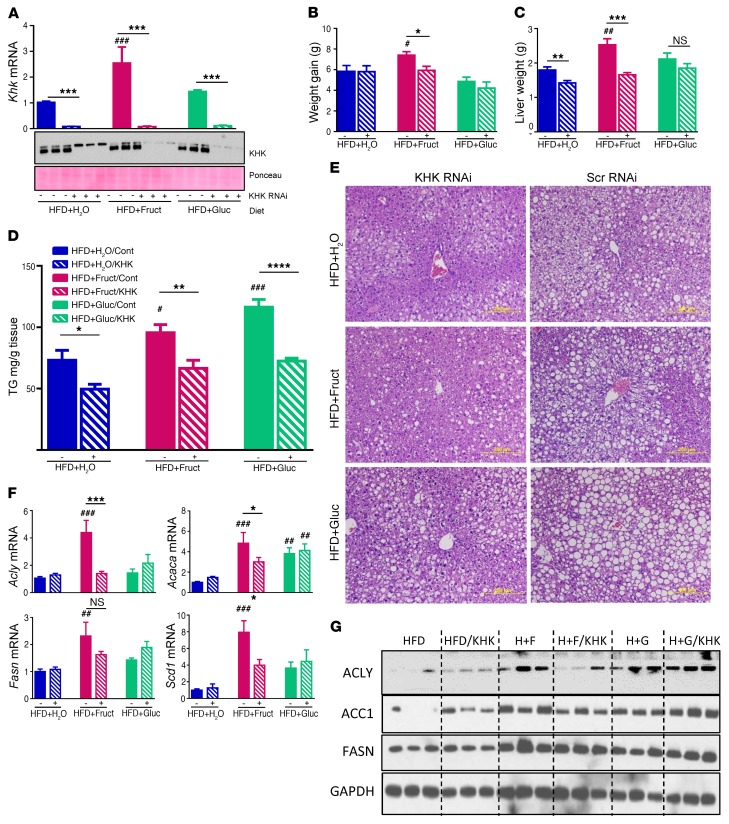
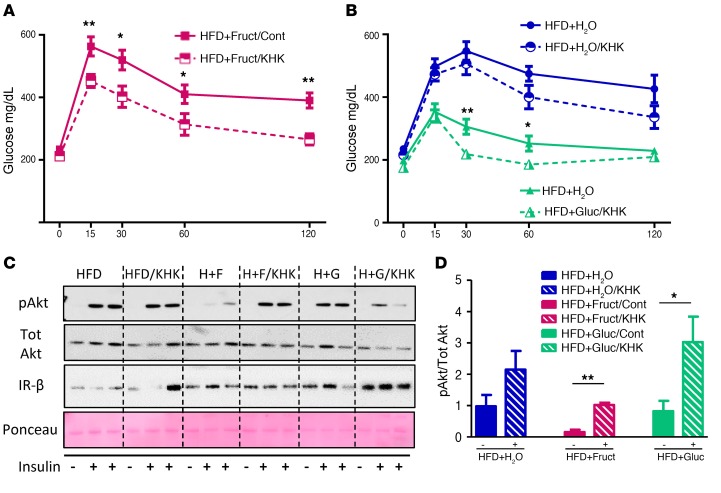
Overconsumption of high-fat diet (HFD) and sugar-sweetened beverages are risk factors for developing obesity, insulin resistance, and fatty liver disease. Here we have dissected mechanisms underlying this association using mice fed either chow or HFD with or without fructose- or glucose-supplemented water. In chow-fed mice, there was no major physiological difference between fructose and glucose supplementation. On the other hand, mice on HFD supplemented with fructose developed more pronounced obesity, glucose intolerance, and hepatomegaly as compared to glucose-supplemented HFD mice, despite similar caloric intake. Fructose and glucose supplementation also had distinct effects on expression of the lipogenic transcription factors ChREBP and SREBP1c. While both sugars increased ChREBP-β, fructose supplementation uniquely increased SREBP1c and downstream fatty acid synthesis genes, resulting in reduced liver insulin signaling. In contrast, glucose enhanced total ChREBP expression and triglyceride synthesis but was associated with improved hepatic insulin signaling. Metabolomic and RNA sequence analysis confirmed dichotomous effects of fructose and glucose supplementation on liver metabolism in spite of inducing similar hepatic lipid accumulation. Ketohexokinase, the first enzyme of fructose metabolism, was increased in fructose-fed mice and in obese humans with steatohepatitis. Knockdown of ketohexokinase in liver improved hepatic steatosis and glucose tolerance in fructose-supplemented mice. Thus, fructose is a component of dietary sugar that is distinctively associated with poor metabolic outcomes, whereas increased glucose intake may be protective.


Conflict of interest statement

Conflict of interest: C.R. Kahn and S. Softic received grant support from and J. Willoughby, C. Harbison, and K. Fitzgerald are employees of Alnylam Pharmaceuticals.

Figures

Figure 1
Figure 1. Fructose supplementation on HFD leads to higher weight gain and insulin resistance.
(A) Weight gain of mice on chow and HFD, supplemented with either regular, 30% fructose, or glucose-sweetened water for 10 weeks. (B) Liver weights of the same mice at sacrifice. (C) Percentage of visceral fat/total fat as measured by DEXA scan after 8 weeks on diet. (D) Blood glucose, (E) insulin levels and their calculated (F) HOMA-IR, measured after 8 weeks on diets. (G) Glucose tolerance test, (H) insulin tolerance test, and (I) glucose tolerance test calculated AUC measured after 8 weeks on diets. n = 7–8 mice per group. (J) Western blot analysis and ImageJ quantification of insulin signaling in the liver. F, fructose; G, glucose. n = 6 mice per group. Statistical analysis was performed using 2-way ANOVA with post hoc t tests between the individual groups. #P < 0.05; ##P < 0.01; ###P < 0.001; ####P < 0.0001, compared with Chow+H2O group. *P < 0.05; **P < 0.01; ***P < 0.001, within chow or HFD groups.
Figure 2
Figure 2. Fructose upregulates hepatic fatty acid synthesis.
(A) mRNA expression and (B) protein levels of enzymes involved in fatty acid synthesis. (C) H&E histology and (D) liver triglyceride content of mice after 10 weeks on different diets. Scale bars: 200 μm. Insert magnification, ×4. n = 7–8 mice per group. LC/MS quantification of (E) endogenously synthesized and (F) exogenously ingested Acyl-CoAs. (G) The ratios of oleoyl-CoA to linolenoyl-CoA and (H) C18:1-CoA to C18:0-CoA from livers of these mice. n = 6 mice per group. Statistical analysis was performed using 2-way ANOVA with post hoc t tests between the individual groups. #P < 0.05; ##P < 0.01; ###P < 0.001; ####P < 0.0001, compared with Chow+H2O group. *P < 0.05; **P < 0.01, within chow or HFD groups.
Figure 3
Figure 3. Fructose and glucose induce unique lipogenic transcription factors.
(A) mRNA expression and (B) protein levels of SREBP1 transcription factors in whole cell lysates from livers of mice after 10 weeks on diets. (C) Western blots of cytoplasmic and nuclear fractions of truncated active form of (N) SREBP1 and ImageJ quantification of N-SREBP1 protein. (D) mRNA expression of total Chrebp, (E) Chrebp-β isoform, and (F) total protein levels of ChREBP in whole cell liver lysates. (G) Western blots of cytoplasmic and nuclear factions of ChREBP and ImageJ quantification of nuclear fraction. n = 6 mice per group. (H) Immunoprecipitation of ChREBP followed by immunoblot for acetyl-K. 1, Chow+H2O; 2, Chow+Fruct; 3, Chow+Gluc; 4, HFD+H2O; 5, HFD+Fruct; 6, HFD+Gluc, with 3 samples pooled per group. Statistical analysis was performed using 2-way ANOVA with post hoc t tests between the individual groups. #P < 0.05; ##P < 0.01; ####P < 0.0001, compared with Chow+H2O group. *P < 0.05; **P < 0.01; ***P < 0.001, within chow or HFD groups.
Figure 4
Figure 4. Hepatic gene expression induced by HFD and sugar metabolism.
(A) Principal component analysis of RNA-seq data from the livers of mice following 10 weeks of diets. PC1, principal component 1. (B) Volcano plot comparison of genes induced in HFD+Gluc versus HFD+Fruct groups. Heatmap representation of genes involved in (C) de novo lipogenesis, (D) fatty acid metabolism, (E) insulin signaling, and (F) mitochondrial function pathways. n = 3–4 samples per group.
Figure 5
Figure 5. KHK is induced with fructose supplementation and in patients with progressive liver disease.
(A) mRNA expression of Khk in the livers of mice at 10 weeks on different diets. n = 6 mice per group. Statistical analysis was performed using 2-way ANOVA with post hoc t tests between the individual groups. #P < 0.05; ##P < 0.01; ####P < 0.0001, compared with Chow+H2O group. ***P < 0.001; ****P < 0.0001, within chow or HFD groups. (B) KHK mRNA and protein levels in the livers of obese adolescent patients undergoing bariatric surgery. (C) mRNA expression of enzymes regulating fatty acid synthesis as well as (D) Western blot analysis and (E) ImageJ quantification of their protein levels. n = 4 subjects per group. Statistical analysis was performed using 1-way ANOVA. #P < 0.05; ##P < 0.01, compared with NoFL group. *P < 0.05, between steatosis and NASH groups.
Figure 6
Figure 6. Khk knockdown improves liver steatosis.
(A) Khk mRNA expression and protein levels in mice after 10 weeks on diets. Mice were treated with control or siRNA targeting KHK for the last 4 weeks. (B) Weight gain after 4 weeks of siRNA treatment and (C) liver weight after 6 weeks on diet followed by 4 weeks of siRNA treatment, while continuing on the same diets. (D) Liver triglyceride quantification and (E) histology in the same mice at sacrifice. Scale bars: 200 μm. (F) mRNA and (G) protein levels of enzymes regulating fatty acid synthesis after treatment with control or KHK targeting siRNA. Cont, control. n = 6 mice per group. Statistical analysis was performed using 2-way ANOVA with post hoc t tests between the individual groups. #P < 0.05; ##P < 0.01; ###P < 0.001, compared with HFD+H2O/control group. *P < 0.05; **P < 0.01; ***P < 0.001; ****P < 0.0001; between control and KHK RNAi–treated groups.
Figure 7
Figure 7. Khk knockdown improves glucose tolerance.
Glucose tolerance in (A) HFD+Fruct and (B) HFD+H2O and HFD+Gluc mice after 6 weeks on diets followed by 4 weeks of treatment with siRNA. (C) Western blot analysis and (D) ImageJ quantification of insulin signaling from livers of these mice. n = 6 mice per group. Statistical analysis was performed using 2-way ANOVA with post hoc t tests between the individual groups. *P < 0.05; **P < 0.01, between control and KHK RNAi–treated groups.

References

    1. Ford ES, Giles WH, Mokdad AH. Increasing prevalence of the metabolic syndrome among u.s. Adults. Diabetes Care. 2004;27(10):2444–2449. doi: 10.2337/diacare.27.10.2444. - DOI - PubMed
    1. Gotto AM, et al. The metabolic syndrome: a call to action. Coron Artery Dis. 2006;17(1):77–80. doi: 10.1097/00019501-200602000-00013. - DOI - PubMed
    1. Loomba R, Sanyal AJ. The global NAFLD epidemic. Nat Rev Gastroenterol Hepatol. 2013;10(11):686–690. doi: 10.1038/nrgastro.2013.171. - DOI - PubMed
    1. Ebbeling CB, et al. A randomized trial of sugar-sweetened beverages and adolescent body weight. N Engl J Med. 2012;367(15):1407–1416. doi: 10.1056/NEJMoa1203388. - DOI - PMC - PubMed
    1. Ma J, et al. Sugar-sweetened beverage, diet soda, and fatty liver disease in the Framingham Heart Study cohorts. J Hepatol. 2015;63(2):462–469. doi: 10.1016/j.jhep.2015.03.032. - DOI - PMC - PubMed

MeSH terms