. 2017 Oct;94(10):946-956.
doi: 10.1097/OPX.0000000000001119.

The Ohio Contrast Cards: Visual Performance in a Pediatric Low-vision Site

Affiliations

The Ohio Contrast Cards: Visual Performance in a Pediatric Low-vision Site

Gregory R Hopkins 2nd et al. Optom Vis Sci. 2017 Oct.

Abstract

Significance: This report describes the first clinical use of the Ohio Contrast Cards, a new test that measures the maximum spatial contrast sensitivity of low-vision patients who cannot recognize and identify optotypes and for whom the spatial frequency of maximum contrast sensitivity is unknown.

Purpose: To compare measurements of the Ohio Contrast Cards to measurements of three other vision tests and a vision-related quality-of-life questionnaire obtained on partially sighted students at Ohio State School for the Blind.

Methods: The Ohio Contrast Cards show printed square-wave gratings at very low spatial frequency (0.15 cycle/degree). The patient looks to the left/right side of the card containing the grating. Twenty-five students (13 to 20 years old) provided four measures of visual performance: two grating card tests (the Ohio Contrast Cards and the Teller Acuity Cards) and two letter charts (the Pelli-Robson contrast chart and the Bailey-Lovie acuity chart). Spatial contrast sensitivity functions were modeled using constraints from the grating data. The Impact of Vision Impairment on Children questionnaire measured vision-related quality of life.

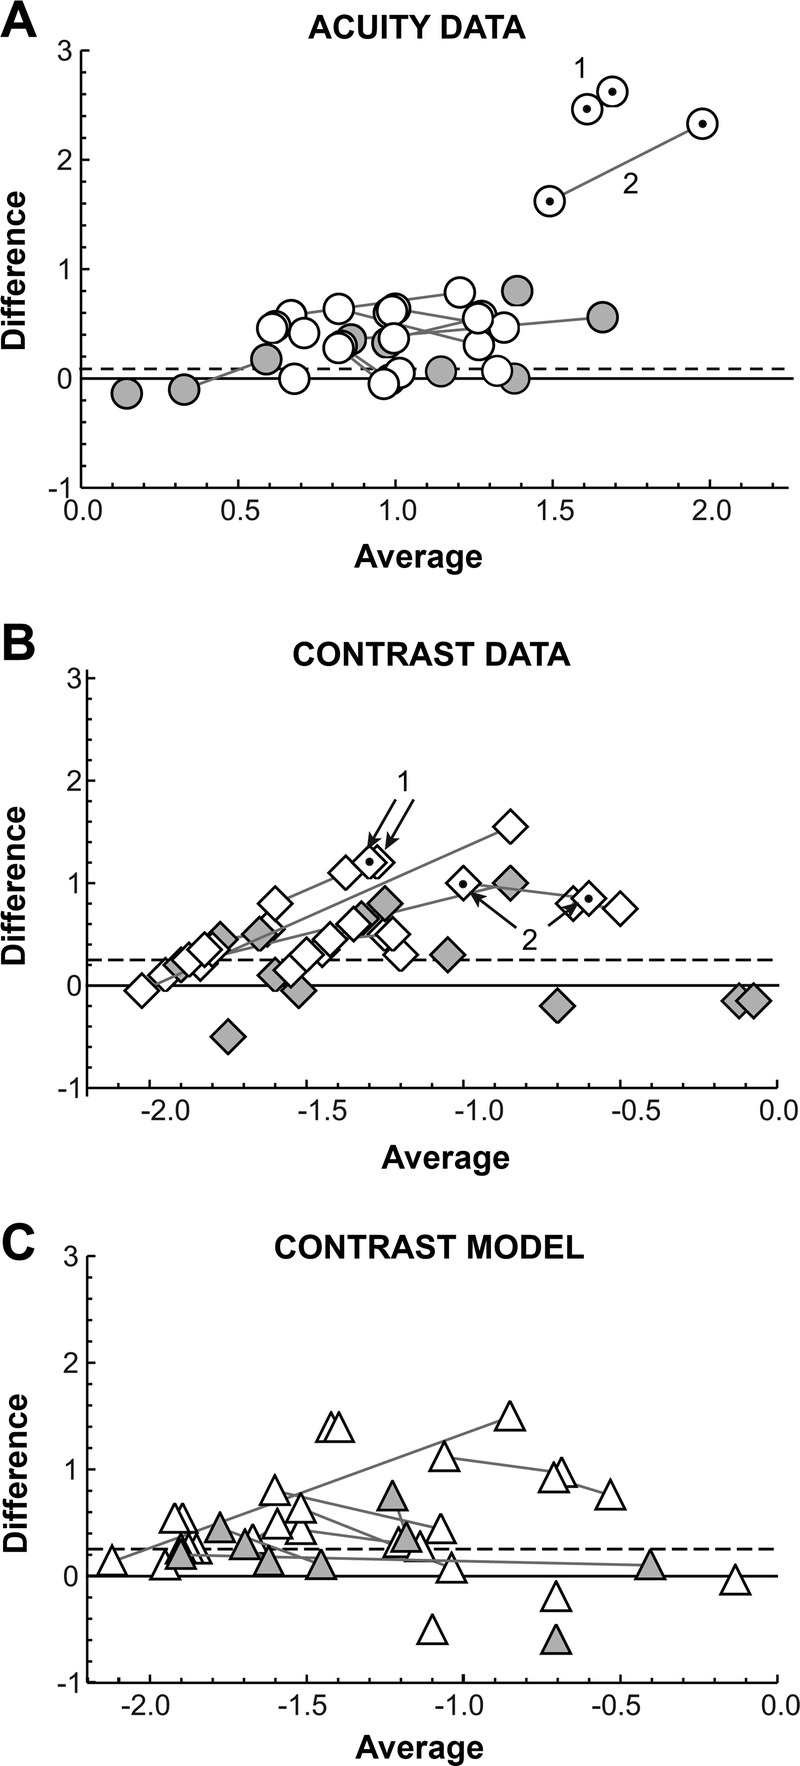
Results: Ohio Contrast Card contrast sensitivity was always less than 0.19 log10 units below the maximum possible contrast sensitivity predicted by the model; average Pelli-Robson letter contrast sensitivity was near the model prediction, but 0.516 log10 units below the maximum. Letter acuity was 0.336 logMAR below the grating acuity results. The model estimated the best testing distance in meters for optimum Pelli-Robson contrast sensitivity from the Bailey-Lovie acuity as distance = 1.5 - logMAR for low-vision patients. Of the four vision tests, only Ohio Contrast Card contrast sensitivity was independently and statistically significantly correlated with students' quality of life.

Conclusions: The Ohio Contrast Cards combine a grating stimulus, a looking indicator behavior, and contrast sensitivity measurement. They show promise for the clinical objective of advising the patient and his/her caregivers about the success the patient is likely to enjoy in tasks of everyday life.


Conflict of interest statement

Conflict of Interest Disclosure: None of the authors have reported a conflict of interest. The Ohio Contrast Cards are available for purchase, but the authors have no financial interest in any proceeds derived from the sale of the cards.

Figures

FIGURE 1
FIGURE 1
Contrast sensitivity functions on healthy adults, infants, and patients. (A) Adult data (19 × 24-degree stimuli), central fixation, continuous viewing. Blue diamonds: sine-wave stimuli; red squares: square-wave stimuli; left-hand solid red square, edge; black symbols: 3-month-olds (15-degree stimuli). (B) 40-Degree sine-wave stimuli, free fixation. Blue diamonds and curve: healthy adult data and curve extrapolated by those authors; black circles: a patient with hereditary optic atrophy. (C) “Full field” sine-wave stimuli. Blue diamonds healthy adults. Black circles (subject K) and green triangles (subject O), patients with Stargardt disease. The curve fitted to the normal data was transposed in two dimensions to fit the patient data. A sine-wave target at 3 cy/deg (vertical dashed lines in all panels) would do a good job of estimating the maximum sensitivity of normal adults, but would underestimate the contrast sensitivity of the infants in (A), the optic atrophy patient in (B), and the patients with Stargardt disease in (C).
FIGURE 2
FIGURE 2
Two examples of the Ohio Contrast Cards. The dot in the center of the lower contrast card is a peephole.
FIGURE 3
FIGURE 3
Comparison between visual acuity and contrast threshold performance. White symbols, Ohio State School for the Blind students; gray symbols, summer camp students; lines join students' fellow eyes; superimposed data points have been jittered in position by 0.05 or less for visibility on the graph. Dotted boxes: range of stimulus values available; symbols outside the boxes are incomplete data on students who could perform only one of the tests. Dots: stimuli viewed at 3 or 10 cm. Solid linear regression lines were fitted to the data by the mixed-effects analysis. (A) Letter charts; dashed lines, range of reproducibility for Pelli-Robson scores on low-vision patients from Dougherty et al. (B) Grating cards; dashed lines, range of reproducibility of the Teller Acuity Cards on deaf-blind students.
FIGURE 4
FIGURE 4
Performance on grating card tests compared with performance on letter charts. Graphic conventions as in Fig. 3. (A) Visual acuity. (B) Contrast threshold. Solid lines, equality predictions; dashed lines, limits of reproducibility from the Pelli-Robson chart and the Teller Acuity Cards, as in Fig. 3. (C) The estimated grating contrast sensitivity from the model described in the text as a function of the Pelli-Robson contrast sensitivity. Dashed line in C: prediction from the requirement of identifying the letters rather than simply detecting them. Diagnoses of numbered students: student 1, cortical vision impairment; student 2, optic atrophy. See text for further details.
FIGURE 5
FIGURE 5
Results from Fig. 4 shown as Bland-Altman plots: the difference between the logarithms of letter performance and grating performance is shown as a function of their average. Symbol conventions as in Fig. 3. Data would fall on the zero lines if the two measures in each chart were numerically equal. Dashed lines: predictions from the requirement of identifying the letters, as explained in the text. (A) logMAR values from the Bailey-Lovie Chart and the Teller Acuity Cards. (B) Pelli-Robson chart and the Ohio Contrast Cards. (C) Pelli-Robson chart and the predicted Pelli-Robson contrast sensitivity.
FIGURE 6
FIGURE 6
Predicted contrast sensitivity functions (CSFs) for square waves fitted to the grating card data. (A) Diagram of the model, for one eye. Circles, measured values: red circle, Ohio Contrast Card contrast sensitivity; black circle, Teller Acuity Card visual acuity; blue diamond: the maximum of the fitted CSF; yellow square: predicted sensory contrast sensitivity for the Pelli-Robson chart; green upright triangle, measured Pelli-Robson contrast sensitivity; green inverted triangle, measured Bailey-Lovie visual acuity. Quantities a to e: see text for definitions. (B and C) Examples of student CSFs.
FIGURE 7
FIGURE 7
Estimated best test distance from the model. (A) Histogram of distribution for this sample of students. (B) Best test distance as a function of students' grating acuity. Fellow eyes joined by lines. Diagonal solid line: rule of thumb proposed in the text. (C) Histogram of the contrast sensitivity errors for three estimates of contrast sensitivity; see text for further details.
FIGURE 8
FIGURE 8
Residual differences between predicted and observed performance. Fellow eyes joined by lines. Bold regression line was fitted to the data after averaging the two eyes' data within students. See text for further details.
FIGURE 9
FIGURE 9
The statistically significant association between the Ohio Contrast Card test results and the Impact of Vision Impairment on Children vision-related quality-of-life questionnaire results. White symbols: Ohio State School for the Blind; gray symbols: Ohio State School for the Blind summer camp. Line: linear regression.
None

References

    1. McDonald MA, Dobson V, Sebris SL, et al. The Acuity Card Procedure: A Rapid Test of Infant Acuity. Invest Ophthalmol Vis Sci 1985;26:1158–62. - PubMed
    1. Lennie P, Van Hemel SB. Visual Impairments: Determining Eligibility for Social Security Benefits. Washington, DC: National Academy Press; 2002. - PubMed
    1. Owsley C, Sloane ME. Contrast Sensitivity, Acuity, and the Perception of ‘Real-World’ Targets. Br J Ophthalmol 1987;71:791–6. - PMC - PubMed
    1. Pelli D, Robson J, Wilkins A. The Design of a New Letter Chart for Measuring Contrast Sensitivity. Clin Vis Sci 1988;2:187–99.
    1. Campbell FW, Howell ER, Johnstone JR. A Comparison of Threshold and Suprathreshold Appearance of Gratings With Components in the Low and High Spatial Frequency Range. J Physiol 1978;284:193–201. - PMC - PubMed