. 2017 Dec 1;26(23):4668-4679.
doi: 10.1093/hmg/ddx348.

Amyotrophic lateral sclerosis-associated mutant SOD1 inhibits anterograde axonal transport of mitochondria by reducing Miro1 levels

Affiliations

Amyotrophic lateral sclerosis-associated mutant SOD1 inhibits anterograde axonal transport of mitochondria by reducing Miro1 levels

Annekathrin Moller et al. Hum Mol Genet. .

Abstract

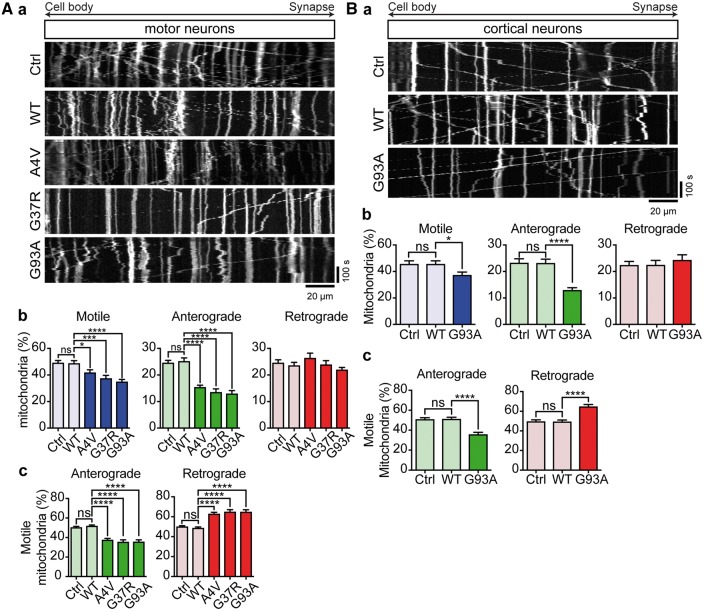
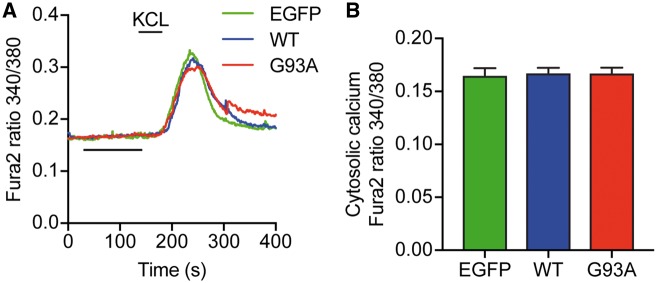
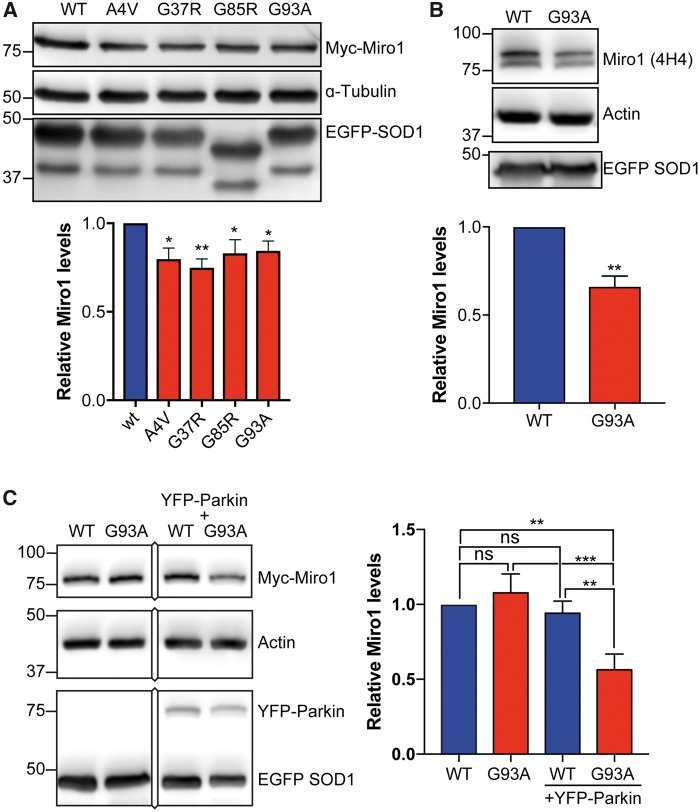
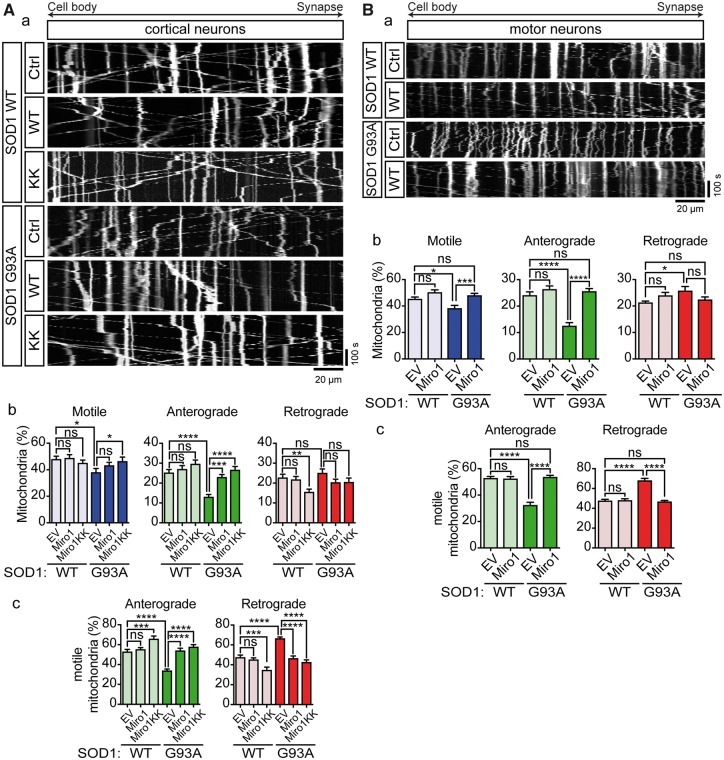
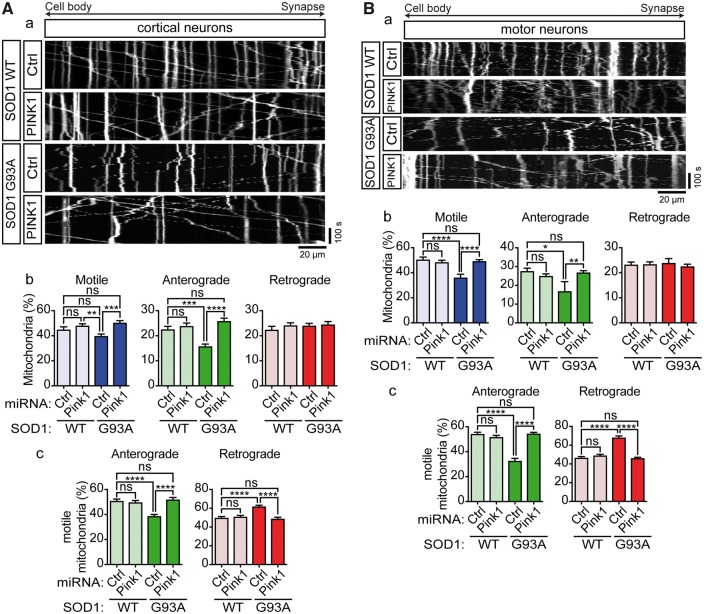
Defective axonal transport is an early neuropathological feature of amyotrophic lateral sclerosis (ALS). We have previously shown that ALS-associated mutations in Cu/Zn superoxide dismutase 1 (SOD1) impair axonal transport of mitochondria in motor neurons isolated from SOD1 G93A transgenic mice and in ALS mutant SOD1 transfected cortical neurons, but the underlying mechanisms remained unresolved. The outer mitochondrial membrane protein mitochondrial Rho GTPase 1 (Miro1) is a master regulator of mitochondrial axonal transport in response to cytosolic calcium (Ca2+) levels ([Ca2+]c) and mitochondrial damage. Ca2+ binding to Miro1 halts mitochondrial transport by modifying its interaction with kinesin-1 whereas mitochondrial damage induces Phosphatase and Tensin Homolog (PTEN)-induced Putative Kinase 1 (PINK1) and Parkin-dependent degradation of Miro1 and consequently stops transport. To identify the mechanism underlying impaired axonal transport of mitochondria in mutant SOD1-related ALS we investigated [Ca2+]c and Miro1 levels in ALS mutant SOD1 expressing neurons. We found that expression of ALS mutant SOD1 reduced the level of endogenous Miro1 but did not affect [Ca2+]c. ALS mutant SOD1 induced reductions in Miro1 levels were Parkin dependent. Moreover, both overexpression of Miro1 and ablation of PINK1 rescued the mitochondrial axonal transport deficit in ALS mutant SOD1-expressing cortical and motor neurons. Together these results provide evidence that ALS mutant SOD1 inhibits axonal transport of mitochondria by inducing PINK1/Parkin-dependent Miro1 degradation.


Figures

Figure 1.
Figure 1.
ALS mutant SOD1 impairs axonal transport of mitochondria. Axonal transport of mitochondria was analyzed in motor neurons (A) and cortical neurons (B). (Aa, Ba) Kymographs show transport of mitochondria in rat motor neurons and cortical neurons expressing EGFP (Ctrl), EGFP-SOD1 WT, A4V, G37R or G93A. (Ab, c; Bb, c) Quantitative analysis of mitochondrial transport shows that expression of ALS mutant SOD1 significantly impairs overall motility of mitochondria (Ab, Bb—Motile) because of a selective block of anterograde (Ab, Bb—Anterograde), but not retrograde (Ab, Bb—Retrograde) transport. As a consequence, SOD1 G93A disturbed the balance of transport to promote net retrograde movement (Ac, Bc). Results are shown as mean ± SEM, statistical significance was determined by one-way ANOVA followed by Fisher’s LSD test, ns, not significant, * P < 0.05, **** P < 0.0001, N (cortical neurons): Ctrl: 24, WT: 21, G93A: 24 from 5 experiments; N (motor neurons) = Ctrl: 16, WT: 20, A4V: 20, G37R: 21, G93A: 21 from 3 experiments.
Figure 2.
Figure 2.
ALS mutant SOD1 G93A does not affect resting [Ca2+]c. Cortical neurons were transduced with EGFP, EGFP-SOD1 WT or G93A lentivirus and [Ca2+]c determined by of Fura2 ratio imaging. To ensure that only viable neurons were taken into account, a transient Ca2+ influx was invoked by depolarization with 50 mM KCl. Average Ca2+ traces are shown in (A). Resting [Ca2+]c was calculated as the average [Ca2+]c between 50 and 150 s of recording and values for individual cells averaged to generate the bar graphs in (B). SOD1 G93A did not change resting [Ca2+]c in comparison to EGFP control or SOD1 WT-expressing neurons. Results are shown as mean ± SEM, statistical significance was determined by one-way ANOVA, N (cells) = EGFP: 32, WT: 36, G93A: 37 from 3 experiments.
Figure 3.
Figure 3.
ALS mutant SOD1 reduces Miro1 expression levels via Parkin. (A, B) Western blot analysis of myc-Miro1 levels in HEK293 cells expressing EGFP-SOD1 WT, A4V, G93A, or G37R (A) or of endogenous Miro1 in cortical neurons expressing EGFP-SOD1 WT or G93A (B). ALS mutant SOD1 caused a decrease in Miro1 levels. Miro1 levels were corrected for loading using the α-tubulin or actin loading control and are shown relative to SOD1 WT. Expression of EGFP-SOD1 was verified on separate blots. (C) Western blot analysis of myc-Miro1 levels in HeLa cells expressing EGFP-SOD1 WT or G93A with or without co-expression of YFP-Parkin. ALS mutant SOD1 G93A-induced degradation of Miro1 was Parkin dependent. Results are shown as mean ± SEM, statistical significance was determined by (A) one-way ANOVA followed by Fisher’s LSD test, N= WT: 8, A4V: 7, G37R: 6, G85R: 8, G93A: 8, (B) unpaired t-test, N = 4, or (C) one-way ANOVA followed by Fisher’s LSD test, N = 6, ns not significant, * P < 0.05, ** P < 0.01, *** P < 0.001.
Figure 4.
Figure 4.
Expression of Miro1 rescues axonal transport of mitochondria in ALS mutant SOD1 expressing neurons. (Aa, Ba) Kymographs show transport of mitochondria in rat cortical neurons and motor neurons co-expressing EGFP-SOD1 WT or G93A with empty vector (Ctrl), myc-Miro1 (WT), or Myc-Miro1E208K/E328K (KK). (Ab, c; Bb, c) Quantitative analysis of mitochondrial transport shows that expression of ALS mutant SOD1 significantly impairs overall motility of mitochondria (Ab, Bb—Motile) because of a selective block of anterograde (Ab, Bb—Anterograde), but not retrograde transport (Ab, Bb—Retrograde). As a consequence, SOD1 G93A disturbed the balance of transport to inhibit anterograde and promote retrograde movement (Ac, Bc). Co-expression of myc-Miro1 WT or KK, fully rescued impaired transport of mitochondria (Ab, Bb) and rebalanced anterograde and retrograde transport (Ac, Bc). Results are shown as mean ± SEM, statistical significance was determined by one-way ANOVA followed by Fisher’s LSD test, ns, not significant, * P < 0.05, *** P < 0.001, **** P < 0.0001, N (cortical neurons): SOD1 WT+Ctrl: 18, SOD1 WT+WT: 24, SOD1 WT+KK: 23, SOD1 G93A+Ctrl: 20, SOD1 G93A+WT: 24, SOD1 G93A+KK: 22 from 4 experiments; N (motor neurons) = WT+Ctrl: 15, SOD1 WT+WT: 16, SOD1 G93A+Ctrl: 19, SOD1 G93A+WT: 29 from 5 experiments.
Figure 5.
Figure 5.
Knockdown of PINK1 rescues axonal transport of mitochondria in ALS mutant SOD1 expressing neurons. (Aa, Ba) Kymographs show transport of mitochondria in rat cortical neurons and motor neurons co-expressing EGFP-SOD1 WT or G93A with non-targeting control miRNA (Ctrl) or PINK1-targeting (PINK1) miRNA. (Ab, c; Bb, c) Quantitative analysis of mitochondrial transport shows that expression of ALS mutant SOD1 significantly impairs overall motility of mitochondria (Ab, Bb—Motile) because of a selective block of anterograde (Ab, Bb—Anterograde), but not retrograde transport (Ab, Bb—Retrograde). As a consequence, SOD1 G93A disturbed the balance of transport to inhibit anterograde and promote retrograde movement (Ac, Bc). Ablation of PINK1 expression fully rescued impaired transport of mitochondria (Ab, Bb) and rebalanced anterograde and retrograde transport (Ac, Bc). Results are shown as mean ± SEM, statistical significance was determined by one-way ANOVA followed by Fisher’s LSD test, ns, not significant, * P < 0.05, *** P < 0.001, **** P < 0.0001, N (cortical neurons): SOD1 WT+Ctrl: 25, SOD1 WT+PINK1: 32, SOD1 G93A+Ctrl: 39, SOD1 G93A+PINK1: 35 from 4 experiments; N (motor neurons) = SOD1 WT+Ctrl: 13, SOD1 WT+PINK1: 19, SOD1 G93A+Ctrl: 16, SOD1 G93A+PINK1: 27 from 4 experiments.

References

    1. Kiernan M.C., Vucic S., Cheah B.C., Turner M.R., Eisen A., Hardiman O., Burrell J.R., Zoing M.C. (2011) Amyotrophic lateral sclerosis. Lancet, 377, 942–955. - PubMed
    1. Renton A.E., Chio A., Traynor B.J. (2014) State of play in amyotrophic lateral sclerosis genetics. Nat. Neurosci., 17, 17–23. - PMC - PubMed
    1. Abel O., Powell J.F., Andersen P.M., Al-Chalabi A. (2012) ALSoD: a user-friendly online bioinformatics tool for amyotrophic lateral sclerosis genetics. Hum. Mutat., 33, 1345–1351. - PubMed
    1. Webster C.P., Smith E.F., Shaw P.J., De Vos K.J. (2017) Protein homeostasis in amyotrophic lateral sclerosis: therapeutic opportunities. Front. Mol. Neurosci., 10, 123.. - PMC - PubMed
    1. De Vos K.J., Hafezparast M. (2017) Neurobiology of axonal transport defects in motor neuron diseases: opportunities for translational research. Neurobiol. Dis., 105, 283–299. - PMC - PubMed

MeSH terms