. 2017 Nov 1;158(11):3954-3973.
doi: 10.1210/en.2017-00511.

Metabolic, Reproductive, and Neurologic Abnormalities in Agpat1-Null Mice

Affiliations

Metabolic, Reproductive, and Neurologic Abnormalities in Agpat1-Null Mice

Anil K Agarwal et al. Endocrinology. .

Abstract

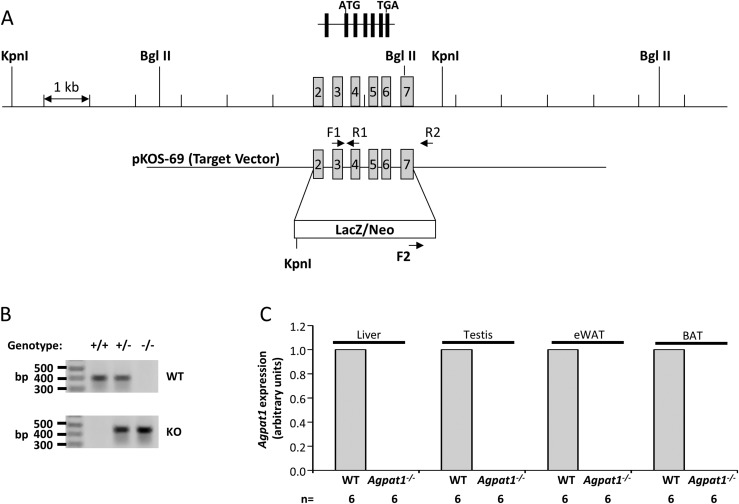
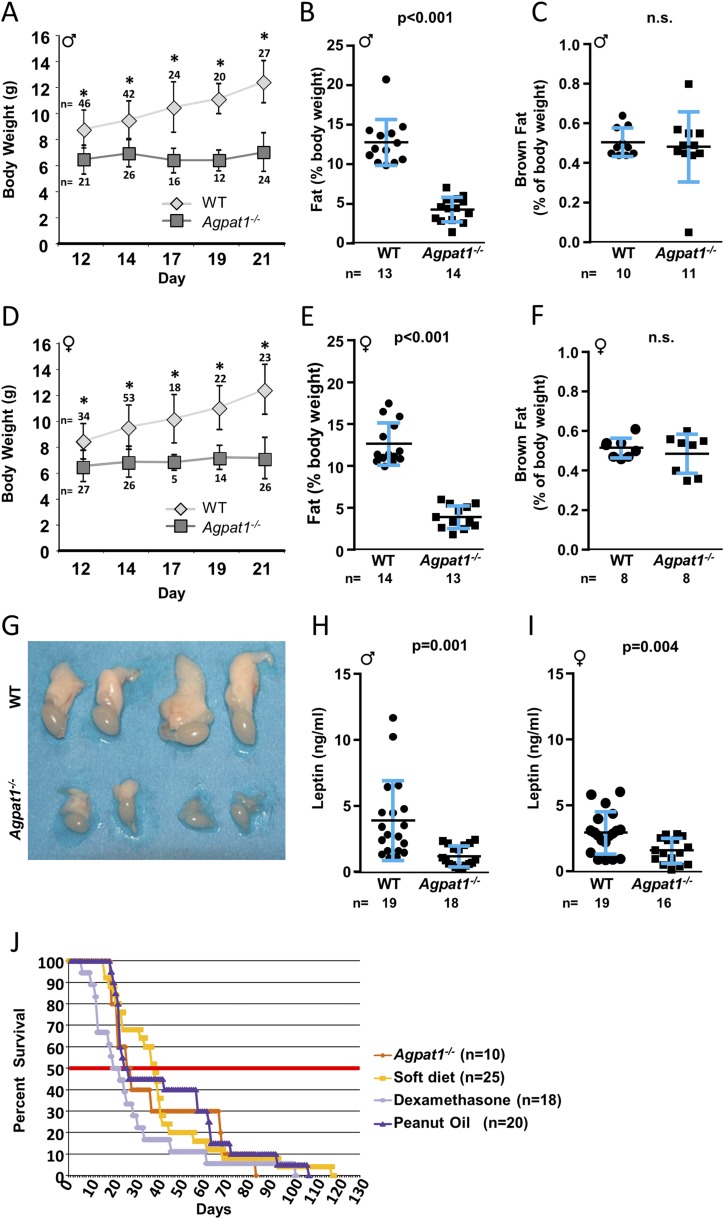
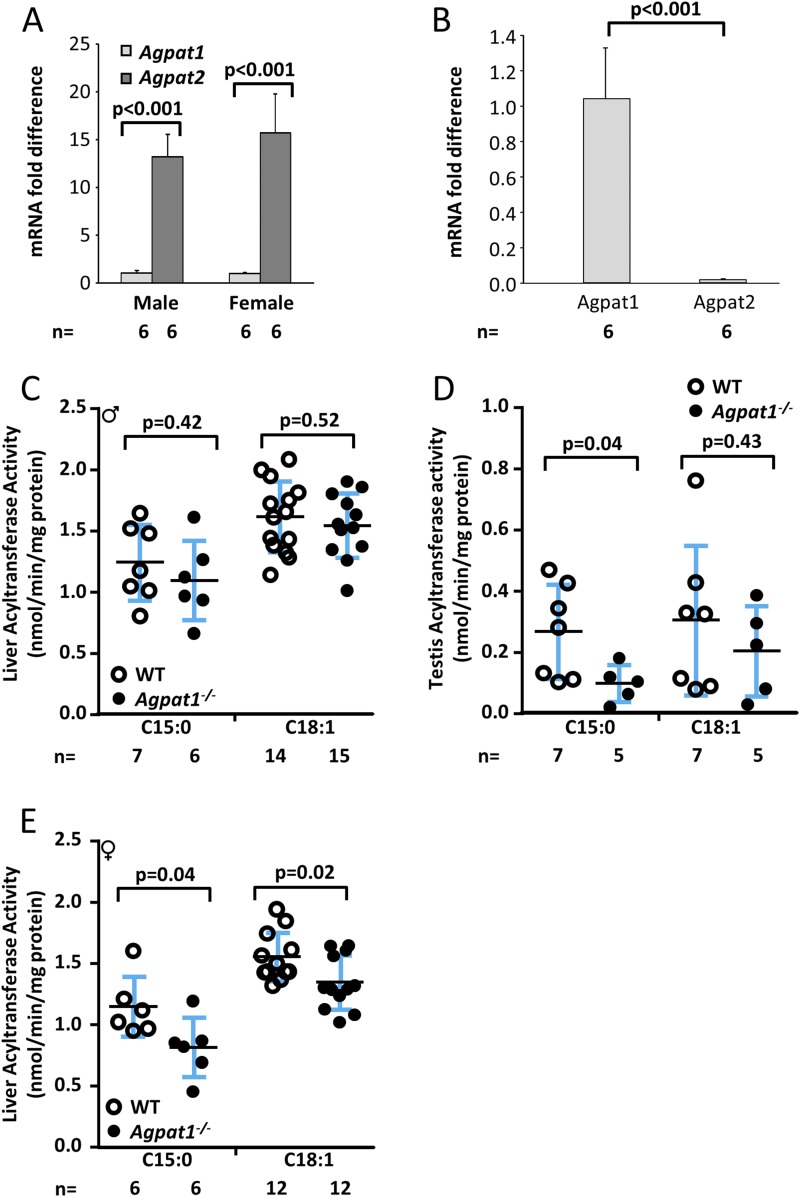
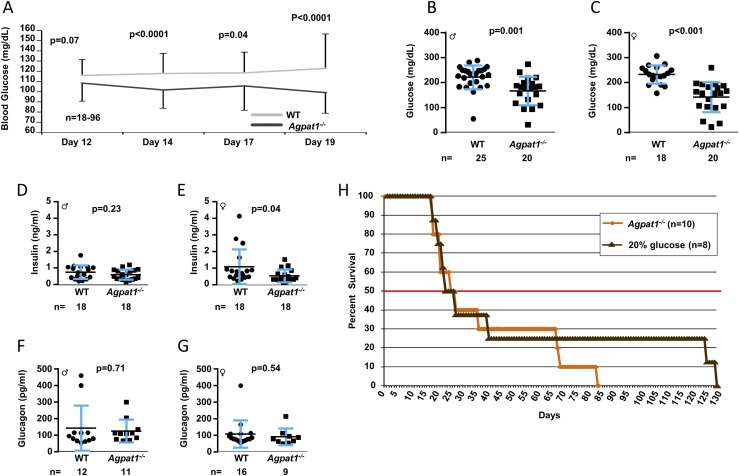
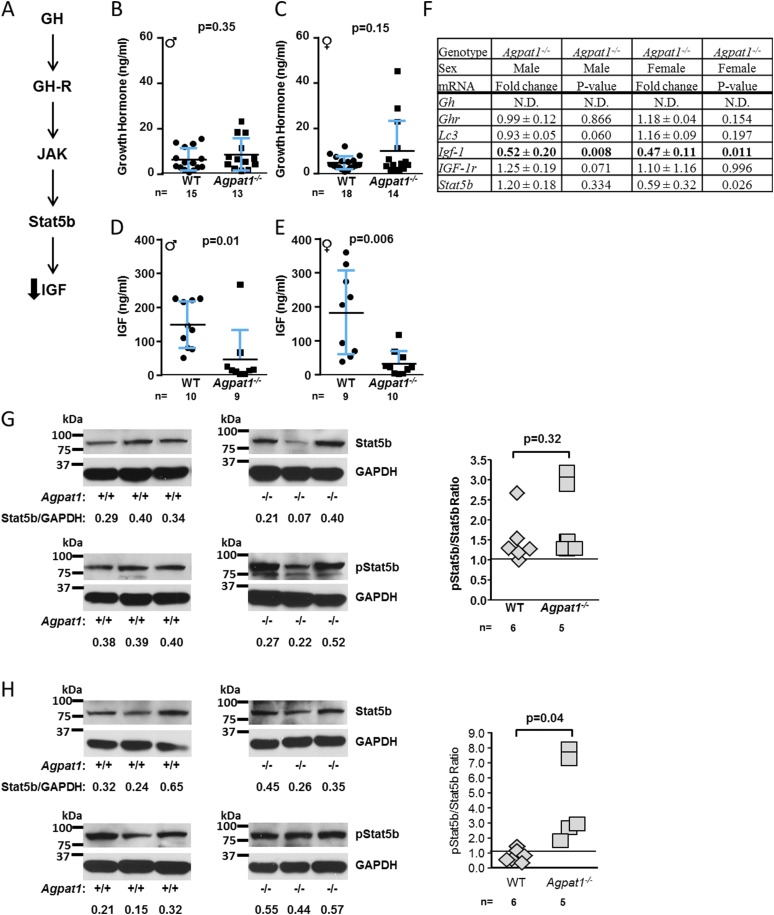
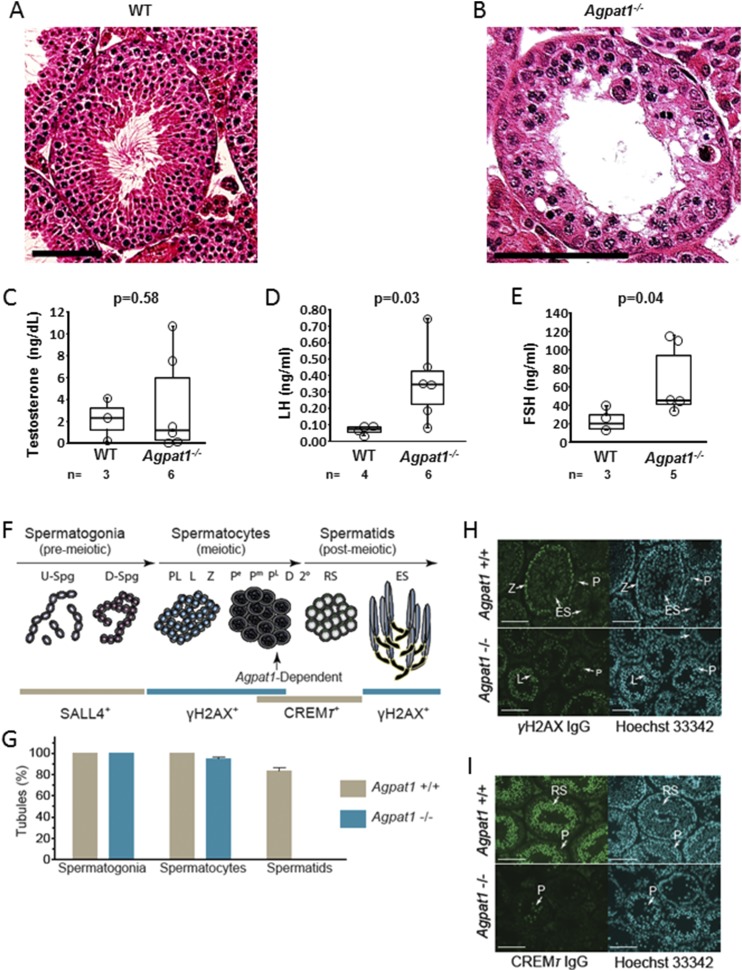
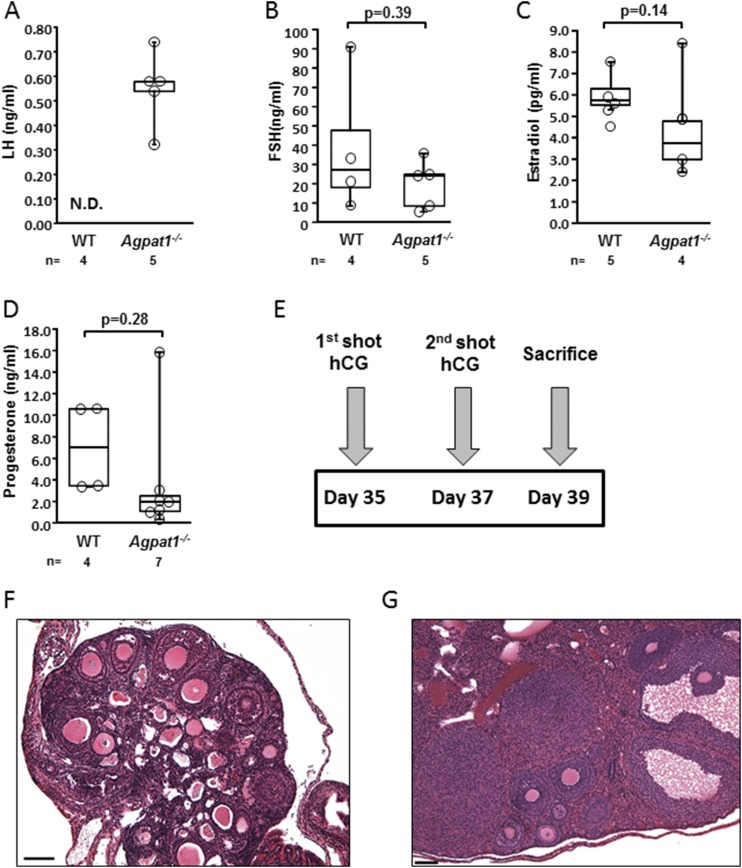
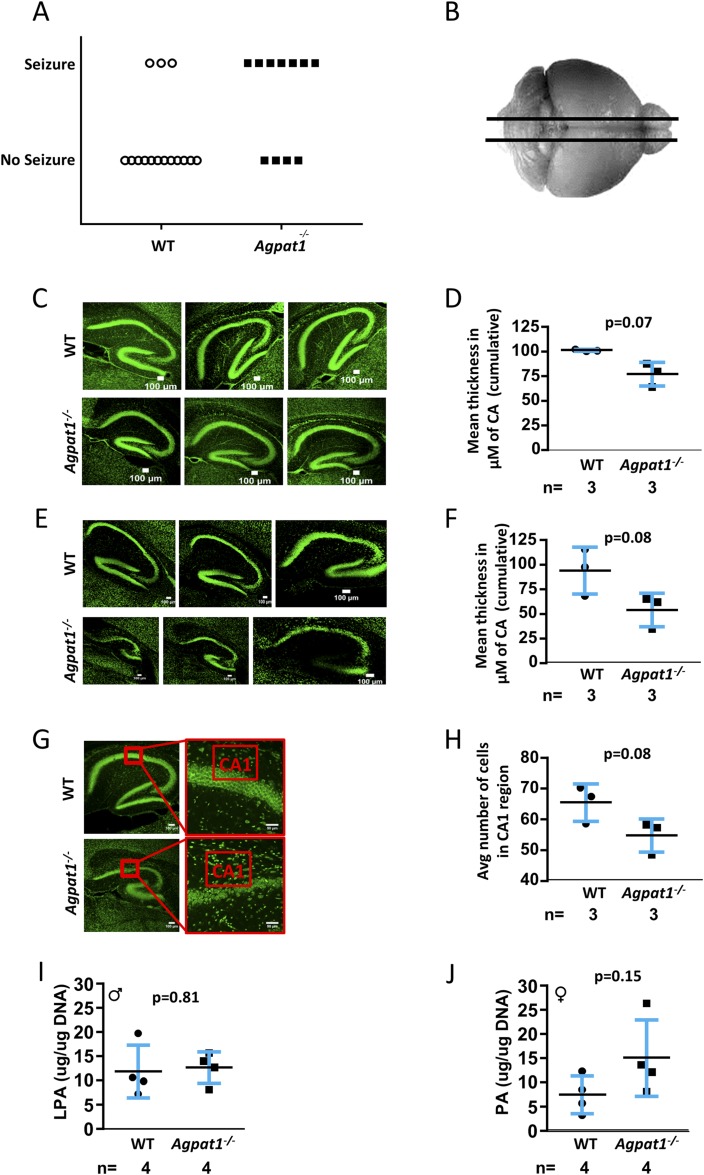
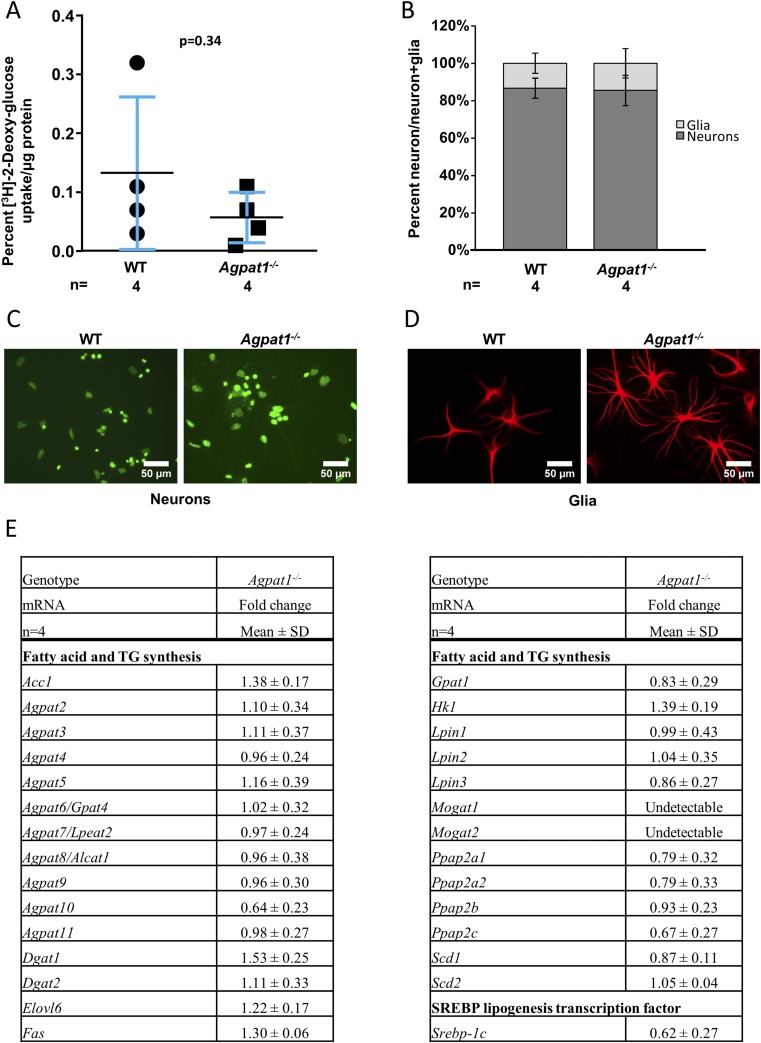
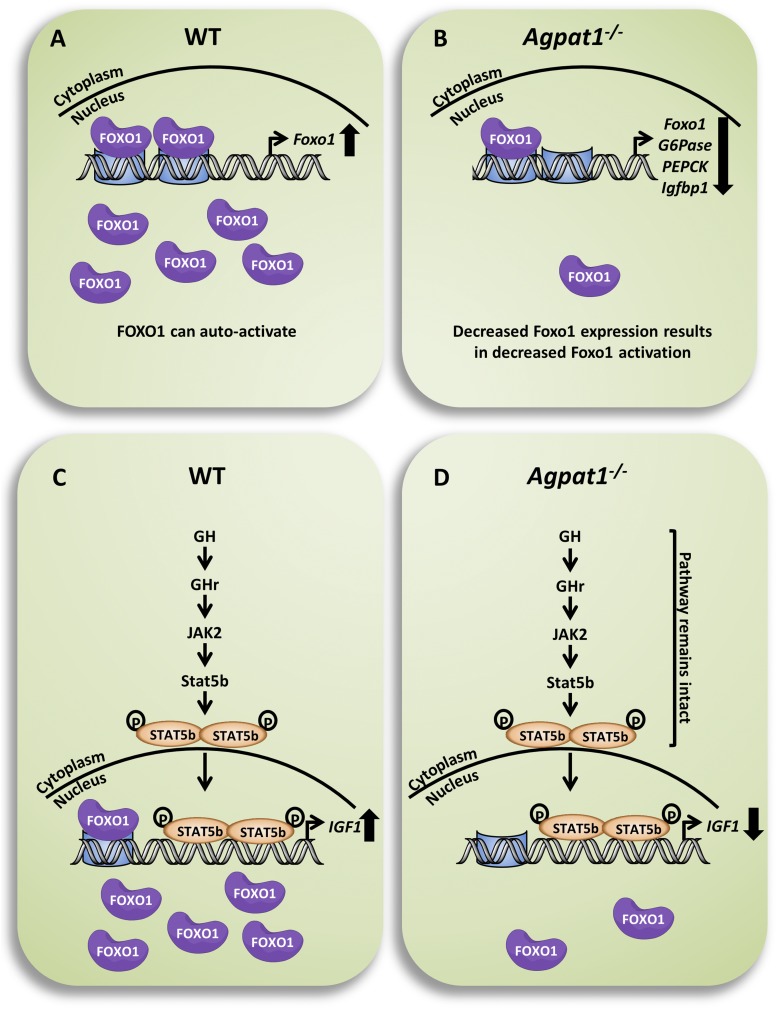
Defects in the biosynthesis of phospholipids and neutral lipids are associated with cell membrane dysfunction, disrupted energy metabolism, and diseases including lipodystrophy. In these pathways, the 1-acylglycerol-3-phosphate O-acyltransferase (AGPAT) enzymes transfer a fatty acid to the sn-2 carbon of sn-1-acylglycerol-3-phosphate (lysophosphatidic acid) to form sn-1, 2-acylglycerol-3-phosphate [phosphatidic acid (PA)]. PA is a precursor for key phospholipids and diacylglycerol. AGPAT1 and AGPAT2 are highly homologous isoenzymes that are both expressed in adipocytes. Genetic defects in AGPAT2 cause congenital generalized lipodystrophy, indicating that AGPAT1 cannot compensate for loss of AGPAT2 in adipocytes. To further explore the physiology of AGPAT1, we characterized a loss-of-function mouse model (Agpat1-/-). The majority of Agpat1-/- mice died before weaning and had low body weight and low plasma glucose levels, independent of plasma insulin and glucagon levels, with reduced percentage of body fat but not generalized lipodystrophy. These mice also had decreased hepatic messenger RNA expression of Igf-1 and Foxo1, suggesting a decrease in gluconeogenesis. In male mice, sperm development was impaired, with a late meiotic arrest near the onset of round spermatid production, and gonadotropins were elevated. Female mice showed oligoanovulation yet retained responsiveness to gonadotropins. Agpat1-/- mice also demonstrated abnormal hippocampal neuron development and developed audiogenic seizures. In summary, Agpat1-/- mice developed widespread disturbances of metabolism, sperm development, and neurologic function resulting from disrupted phospholipid homeostasis. AGPAT1 appears to serve important functions in the physiology of multiple organ systems. The Agpat1-deficient mouse provides an important model in which to study the contribution of phospholipid and triacylglycerol synthesis to physiology and diseases.


Figures

Figure 1.
Figure 1.
Strategy for deletion of Agpat1 in the mouse and biochemical confirmation. (A) The WT allele marked with exons 2 to 7 is shown; exon 1 is noncoding in the Agpat1 gene. The homologous gene deletion strategy was such that the β-galactosidase (LacZ) gene was inserted in place of exons 2 to 7. The primers used for amplifying the WT (F1 + R1) and KO (F2 + R2) alleles are marked. (B) The expected genotype for WT, heterozygous, and KO alleles by PCR amplification is shown. The image was cropped from the original image shown as Supplemental Fig. 17. The location of the primers used for amplification are noted in (A). (C) Agpat1 mRNA expression in the liver, testis, epididymal white adipose tissue (eWAT), and brown adipose tissue (BAT) of Agpat1−/− mice was undetectable. Six individual samples were analyzed for this assay (n = 6). Agpat1 was normalized to cyclophilin. Primers used for amplification are provided in Supplemental Table 3.
Figure 2.
Figure 2.
Agpat1−/− mice had reduced body weight, total body fat, and plasma leptin level. The body weight of Agpat1−/− mice did not increase as the mice aged compared with WT mice [(A) male; (D) female] (numbers of animals are shown above or below the symbols). For statistical analysis, see the Materials and Methods section. The nuclear magnetic resonance spectroscopy measurement shows that Agpat1−/− mice had decreased total body fat [(B) male; (E) female]. There was no significant difference (n.s.) in the brown fat pad between 21-day-old WT and Agpat1−/− (C) male and (F) female mice. (G) We observed reduced epididymal fat pads in all Agpat1−/− male mice. Shown are fat pads attached to testes from 21-day-old WT and Agpat1−/− mice (two each). Reduced leptin levels were observed in 21-day-old (H) male and (I) female mice. (J) Rescue from neonatal death was attempted in Agpat1−/− mice by administration of peanut oil, a soft diet, or dexamethasone (dex). Mixed-sex groups of Agpat1−/− mice were injected intraperitoneally daily with dex (1 μg/g) or peanut oil (100 μL) until the mice succumbed. The soft diet was placed in a petri dish on the cage floor. In the treatment schedule, there was a decrease in the survivability at 50% survival only for the dex-treated group (P = 0.0539). However, the overall survival of treated Agpat1−/− mice was not much different from that of untreated mice. The number of mice tested is shown for each treatment group. Percent survivability was calculated against the total number of mice at the start of the treatment. Such treatment started around day 14, when the genotypes were available. The thick horizontal midline represents 50% survivability. The black line and error bars represent the mean ± standard deviation, with the number of animals used shown beneath graphs (B, C, E, F, H, and I) and beside graph (J). *P < 0.001 by mixed-effects repeated-measures analysis in (A) and (D). Dot plot P value was determined by two-tailed Student t test. Survival curve P value was determined by generalized Wilcoxon test followed by the Dunnett test for comparisons to the control group. ♂, male; ♀, female.
Figure 3.
Figure 3.
Biochemical analyses in the Agpat1−/− mice. (A) The relative expression of Agpat1 vs Agpat2 in the livers of day 21 male and female WT mice is shown. Expression was analyzed from individual complementary DNA performed once in triplicate, and the data are presented as the mean fold difference (n = 6 each sex). Agpat1 and Agpat2 were normalized to cyclophilin. (B) The relative expression of Agpat1 vs Agpat2 in the testis of day 21 male WT mice is shown. Expression was analyzed from individual complementary DNA performed once in duplicate, and the data are presented as the mean fold difference (n = 6). Agpat1 and Agpat2 were normalized to cyclophilin. (C) Enzymatic measurement of total AGPAT (acyltransferase) activity in the livers of male WT and Agpat1−/− mice is shown. (D) Enzymatic activity of total AGPAT in the testes of WT and Agpat1−/− mice is shown. (E) Enzymatic measurement of total AGPAT (acyltransferase) activity in the livers of female WT and Agpat1−/− mice is shown. The acyl-CoA used was C15:0 = pentadecylic acid and C18:1 = oleic acid. Symbols represent individual data points, and the line represents the mean ± standard deviation (SD) with the n value shown below the graph. Bars represent the mean ± SD. P value was determined by two-tailed Student t test. ♂, male; ♀, female. Primer pairs used are provided in Supplemental Table 3.
Figure 4.
Figure 4.
Agpat1−/− mice were hypoglycemic. (A) Reduced blood glucose level in Agpat1−/− mice compared with the level in WT mice via tail vein is shown between days 12 and 19. The P value was determined by mixed-effects repeated-measures analysis. The plasma glucose levels remained low even at day 21 as measured in plasma obtained by cardiac puncture [(B) male; (C) female]. The line represents the mean ± standard deviation with the number of animals used underneath the graph. The low plasma glucose levels in Agpat1−/− mice were not due to hyperinsulinemia [(D) male; (E) female]. There was also no difference in glucagon levels in Agpat1−/− mice compared with WT mice [(F) male; (G) female]. (H) A survival curve was generated by administration of glucose (100 μL of 20% glucose per mouse per day) until the death of the mouse, which did not change the survivability of Agpat1−/− mice. The line horizontal graph-width line at 50% represents the %50% survivability. Survival curve P value was determined by the generalized Wilcoxon test followed by the Dunnett test for comparisons to the control group. Dot plot P value was determined by two-tailed Student t test. ♂, male; ♀, female.
Figure 5.
Figure 5.
GH signaling pathway in the livers of Agpat1−/− mice. (A) Schematic shows the GH signal transduction in which GH binds its cognate growth hormone receptor (GH-R) and activates Janus kinase (JAK), which then phosphorylates signal transducer and activator of transcription 5b (Stat5b). Phosphorylated Stat5b (p-Stat5b) dimerizes and translocates to the nucleus and activates GH-specific gene expression. (B, C) Plasma GH levels remained unchanged in both sexes. (D, E) However, plasma IGF-1 levels were decreased in Agpat1−/− mice of both sexes. (F) Liver gene expression of Lc3, Gh, Ghr, Igf-1r, and Stat5b remained unaffected in both sexes. Expression of Igf-1 is shown in bold type. N.D., not detectable. Shown are the mean ± standard deviation (SD) fold changes from individual samples (male, n = 5; female, n = 6) compared with WT = 1. (G, H) Immunoblot for Stat5b and p-Stat5b is shown; the representative images of three independent samples were obtained from six WT and five Agpat1−/− mice. The images were used for semiquantification using ImageJ. The Stat5b and p-Stat5b spots were normalized to GAPDH. The ratios of Stat5b to GAPDH are given below the images. The ratio of unphosphorylated to phosphorylated Stat5b reached statistical significance only in females [(G) male; (H) female]. We noticed a faster migrating band also identified with the p-Stat5b antibody used, which is a nonspecific band. The gel blots as shown have been cropped from the X-ray film images provided as Supplemental Fig. 18. In (B–E), the line represents the mean ± SD, with the number of animals used underneath the graph. P value was determined by two-tailed Student t test. Gh, growth hormone; Ghr, growth hormone receptor; Lc3, microtubule-associated protein 1A/1B-light chain 3; Igf-1, insulinlike growth factor 1; Igf-1r, insulinlike growth factor 1 receptor; ♂, male; ♀, female.
Figure 6.
Figure 6.
Absence of elongating spermatids in Agpat1−/− mice. (A) Morphology of representative testicular section from 6-week-old WT mouse, stained with hematoxylin and eosin, is shown. In WT testes, spermatids can be seen. (B) Spermatids are absent in testes of 6-week-old Agpat1−/− mice. Scale, 100 μM. (C−E) At 6 weeks, plasma testosterone (C) is unchanged compared with that of WT mice (n = 3 to 6). (D) LH and (E) FSH levels in Agpat1−/− mice were significantly higher than levels in WT mice, indicating the arrest of spermatogenesis (n = 3 to 6). For the box-and-whisker plots, the boxes represent the 25th and 75th percentiles, the line represents the median, and the whiskers represent the minimum and maximum values. (F) Prominent steps in spermatogenic cell development were monitored in WT and Agpat1−/− mice using antibodies to SALL4, γH2AX, and CREMƬ, which selectively label nuclei in spermatogonia, spermatocytes, and round spermatids, respectively (–33). γH2AX also selectively labels elongated nuclei in elongating spermatids (31). The vertical arrow notes spermatogenic arrest classified at steps between late-pachytene spermatocyte and round spermatid development. (G) Percentage of seminiferous tubule cross sections containing SALL4+ spermatogonia, γH2AX+ spermatocytes, or CREMƬ+ spermatids in ∼42-day-old WT and Agpat1−/− mice (n = 3 mice per genotype, ± standard error of the mean; 75 to 100 seminiferous tubule cross sections were scored per mouse per genotype). (H) γH2AX (green) and Hoechst 33342 (cyan) colabeling in WT and Agpat1−/− mouse testis sections. Scale, 100 µM. (I) CREMƬ (green) and Hoechst 33342 (cyan) colabeling in WT and Agpat1−/− mouse testis sections. The arrows point to spermatocytes and round spermatids displaying distinct CREMƬ-labeling intensities. Scale, 100 µM. P value was determined by two-tailed Student t test. 2°, secondary spermatocytes; D, diplotene spermatocytes; D-Spg, differentiating spermatogonia; ES, elongating spermatids; L, leptotene spermatocytes; Pe, early pachytene spermatocytes; Pm, middle pachytene spermatocytes; PL, late pachytene spermatocytes; PL, preleptotene spermatocytes; RS, round spermatids; S, Sertoli cells. U-Spg, undifferentiated spermatogonia; Z, zygotene spermatocytes.
Figure 7.
Figure 7.
The ovaries of Agpat1−/− mice were responsive to human chorionic gonadotropin (hCG) stimulation. The levels of (A) LH, (B) FSH, (C) estradiol, and (D) progesterone in WT and Agpat1−/− plasma at 6 weeks are shown. (E) The treatment schedule of mice injected with hCG is shown. WT and Agpat1−/− mice were given hCG injections (5 IU) as shown in the schematic and were euthanized 2 days later. (F, G) The morphology of hematoxylin and eosin−stained ovarian sections from (F) untreated and (G) treated Agpat1−/− mice show an increase in distinct regions of the corpora lutea in treated female mice. Images are representative of three independent images. Scale, 100 μM. For the box-and-whisker plots, the boxes represent the 25th and 75th percentiles, the line represents the median, and the whiskers represent the minimum and maximum values. The number of animals used is shown underneath the graph. The P value was determined by two-tailed Student t test. N.D., not detectable.
Figure 8.
Figure 8.
Agpat1−/− mice showed audiogenic seizure response and abnormal hippocampus structure. (A) A significant number of Agpat1−/− mice showed audiogenic seizure response compared with WT mice under similar conditions. Seizure was ranked by the Racine scale (20, 21). Seven of 11 Agpat1−/− mice had behavioral seizure activity when subjected to a 100-dB audiogenic startle stimulus for 1 minute, whereas only 3 of 15 WT mice showed the same response (P = 0.0426, Mann-Whitney U test) (see also Supplemental Video 1). (B) Schematic of the brain region used for sectioning is shown. (C−E) Sagittal sections of WT and Agpat1−/− brains (C) stained with NeuroD to mark the neurons at day 14 and (D) the mean thickness of the CA region are shown. Sagittal sections of WT and Agpat1−/− brains (E) stained with NeuroD to mark the neurons at day 21 and (F) the mean thickness of the CA region are shown. The independent biological replicates are depicted. Each sample represents the mean of three measurements. (G) Neurons were counted in three different mouse hippocampal CA1 regions. Shown are representative images from WT and Agpat1−/− sections used for counting neurons and (H) the quantification of neuron counts. There was no change in the LPA or PA level in the hippocampus of Agpat1−/− mice compared with levels in WT mice. The line represents the mean ± standard deviation with the number of animals used underneath the graph. The P value was determined by two-tailed Student t test. ♂, male; ♀, female.
Figure 9.
Figure 9.
Neurons of the hippocampal region of Agpat1−/− mice showed no reduced ability in [3H]-2-deoxyglucose uptake. (A) Cultured neurons exposed to [3H]-2-deoxyglucose showed no difference in glucose uptake. Symbols represent the individual data points. The line represents the mean ± standard deviation (SD), with the number of animals used underneath the graph. The P value was determined by two-tailed Student t test. (B) The neuron and glia populations in cultured neurons are shown. In our culture, the neuron population was ∼85% for both WT and Agpat1−/− mice. (C, D) Isolated neurons from day 4 to 5 hippocampi were cultured and stained (C) with NeuroD to identify neurons and (D) with glial fibrillary acidic protein, a glia-specific antibody. (E) There was no change in the expression pattern of genes related to fatty acid and triglyceride (TG) synthesis in the neurons of the Agpat1−/− hippocampus compared with the WT hippocampus. Fold change was compared with WT = 1. Shown are the mean ± SD fold changes from individual samples (n = 4). Acc1, acetyl–coenzyme A carboxylase; Agpat, acylglycerol-3-phosphate O-acyltransferase; Dgat, diglyceride acyltransferase; Elovl6, fatty acid elongase 6; Fas, fatty acid synthase; Gpat1, glycerol-3-phosphate acyltransferase, mitochondrial; Hk1, hexokinase 1; Lpin, lipin; Mogat, monoacylglycerol acyltransferase; Ppap, phosphatidic acid phosphatase; Scd, stearoyl–coenzyme A desaturase; Srebp-1c, sterol regulatory element-binding protein 1c.
Figure 10.
Figure 10.
Schematic of pathways for transcriptional activation of Forkhead box protein O1 (FOXO1) and IGF-1 in the mouse liver. (A) FOXO1 activates its own transcription, which leads to activation of genes such as glucose-6-phosphatase (G6pase), phosphoenolpyruvate kinase (Pepck), and insulinlike growth factor binding protein 1 (Igfbp1). (B) In the livers of Agpat1−/− mice, decreased expression of Foxo1 resulted in decreased expression of Foxo1, G6Pase, Pepck, and Igfbp1. (C) The GH signaling pathway, which results in the phosphorylation of Stat5b, is shown. Upon dimerization, phosphorylated Stat5b moves into the nucleus and activates transcription of Igf-1. The Igf-1 promoter also contains FOXO1 binding sites, which could also activate Igf-1; however, this has not been shown experimentally. (D) In the livers of Agpat1−/− mice, the GH signaling pathway remains intact. However, a decrease in Igf-1 expression, which could result from the decreased Foxo1 levels, is shown. This event is not related to the phosphorylation of FOXO1. The thick downward arrows on far right represent decreased transcription, whereas the thick upward arrows represent increased transcription.

Similar articles

Cited by

References

    1. Kennedy EP. The synthesis of cytidine diphosphate choline, cytidine diphosphate ethanolamine, and related compounds. J Biol Chem. 1956;222(1):185–191. - PubMed
    1. Han GS, Wu WI, Carman GM. The Saccharomyces cerevisiae Lipin homolog is a Mg2+-dependent phosphatidate phosphatase enzyme. J Biol Chem. 2006;281(14):9210–9218. - PMC - PubMed
    1. Donkor J, Sariahmetoglu M, Dewald J, Brindley DN, Reue K. Three mammalian lipins act as phosphatidate phosphatases with distinct tissue expression patterns. J Biol Chem. 2007;282(6):3450–3457. - PubMed
    1. Tang X, Benesch MG, Brindley DN. Lipid phosphate phosphatases and their roles in mammalian physiology and pathology. J Lipid Res. 2015;56(11):2048–2060. - PMC - PubMed
    1. Temprano A, Sembongi H, Han GS, Sebastián D, Capellades J, Moreno C, Guardiola J, Wabitsch M, Richart C, Yanes O, Zorzano A, Carman GM, Siniossoglou S, Miranda M. Redundant roles of the phosphatidate phosphatase family in triacylglycerol synthesis in human adipocytes. Diabetologia. 2016;59(9):1985–1994. - PMC - PubMed

Substances