. 2017 Nov 15;26(22):4352-4366.
doi: 10.1093/hmg/ddx321.

Impaired axonal retrograde trafficking of the retromer complex augments lysosomal deficits in Alzheimer's disease neurons

Affiliations

Impaired axonal retrograde trafficking of the retromer complex augments lysosomal deficits in Alzheimer's disease neurons

Prasad Tammineni et al. Hum Mol Genet. .

Abstract

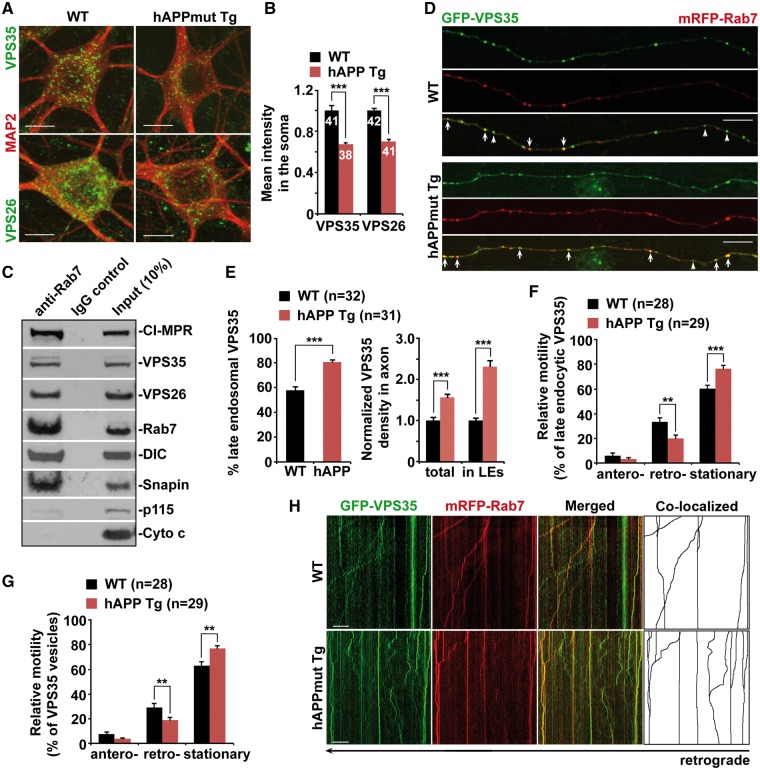
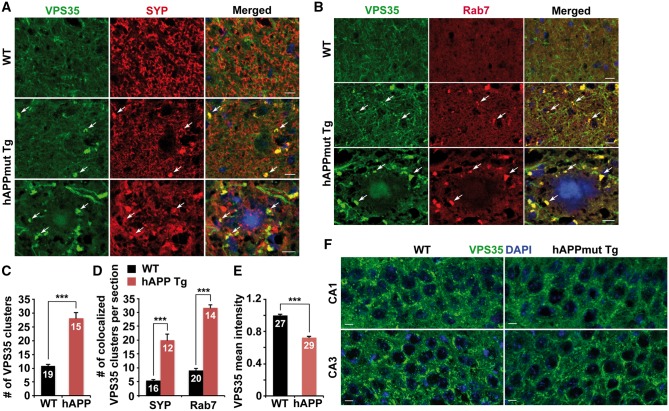
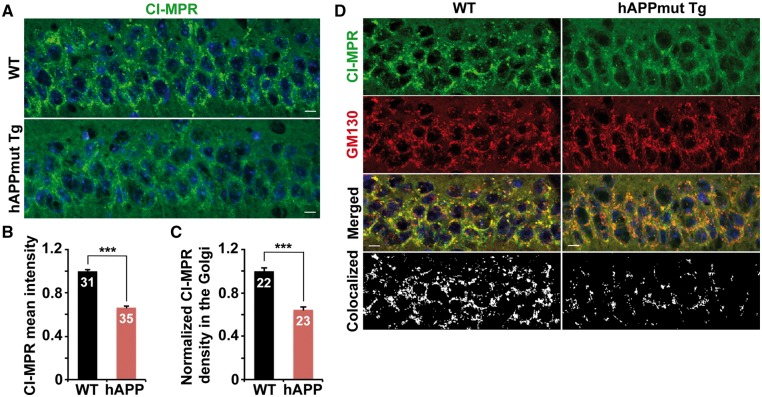
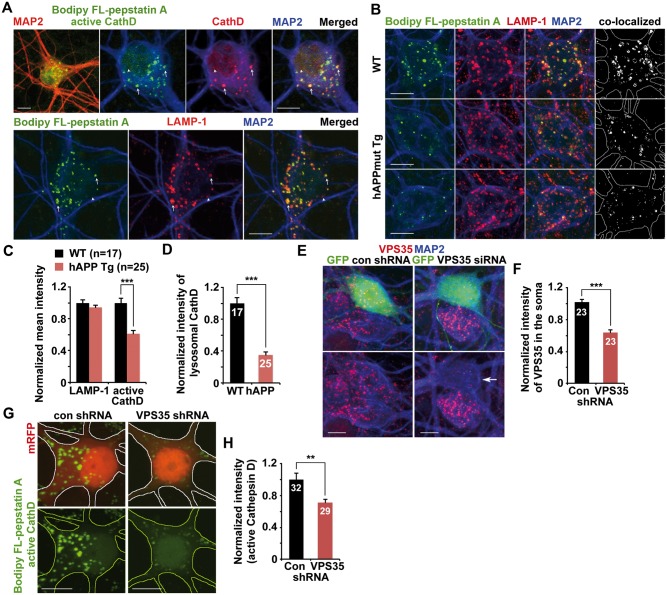
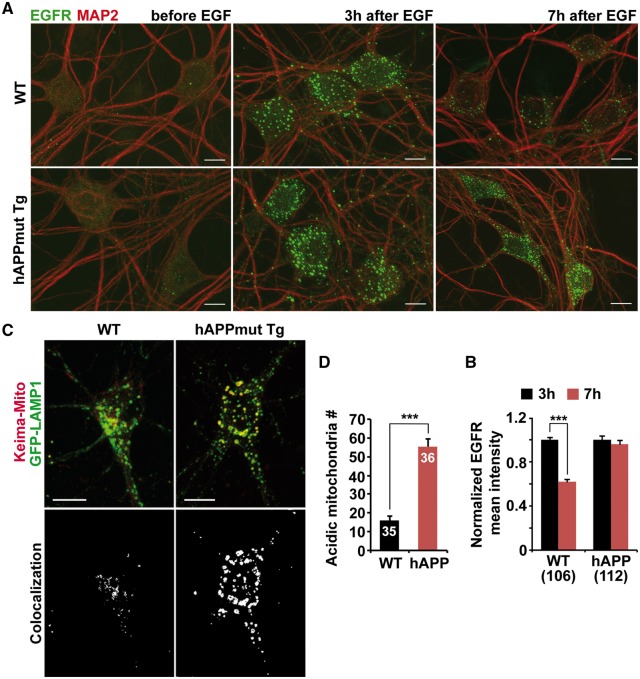
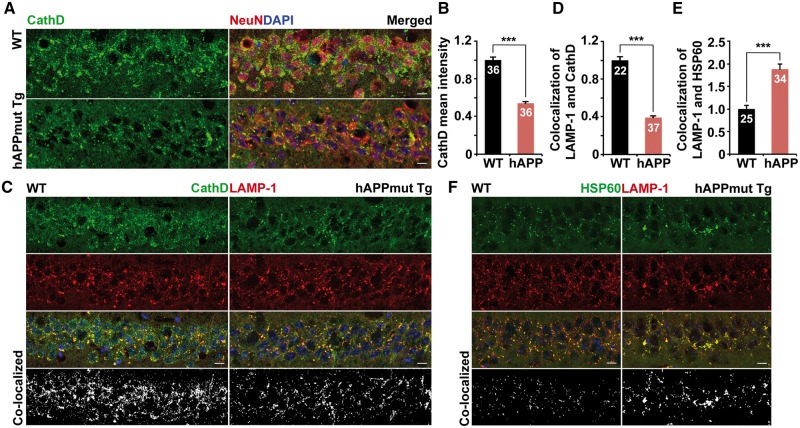
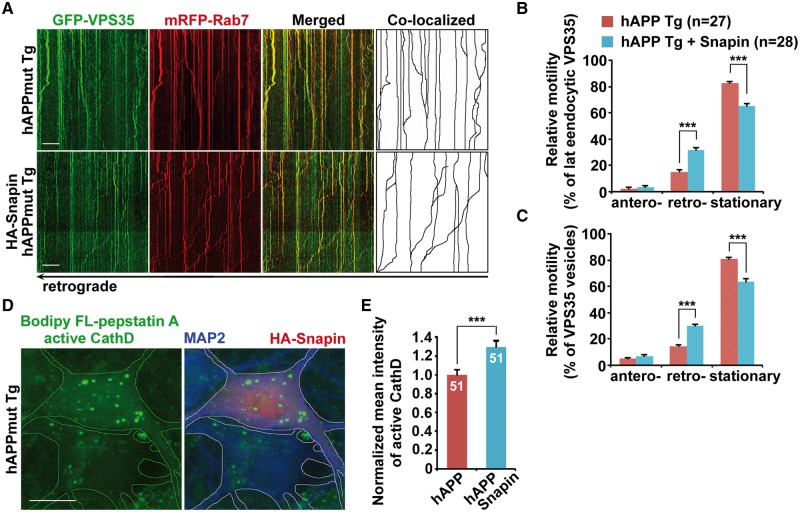
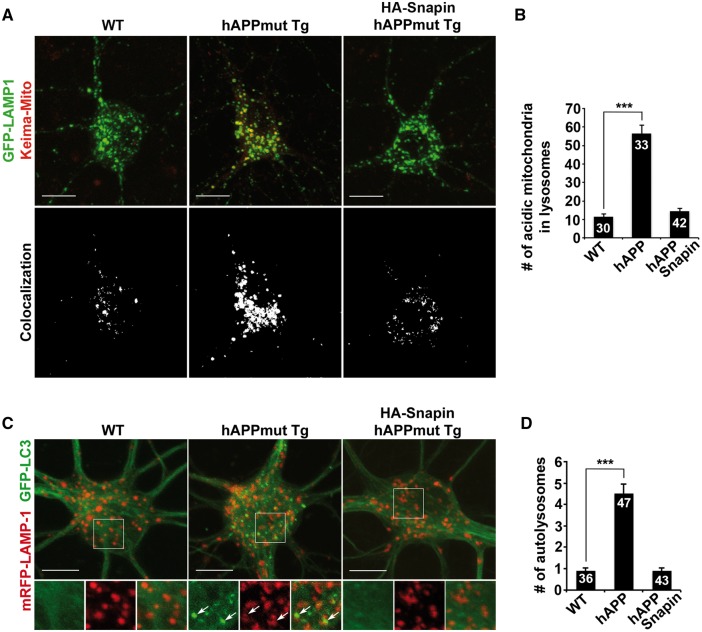
Lysosomal proteolysis is essential for the quality control of intracellular components and the maintenance of cellular homeostasis. Lysosomal alterations have been implicated as one of the main cellular defects contributing to the onset and progression of Alzheimer's disease (AD). However, the mechanism underlying lysosomal deficits in AD remains poorly understood. Here, we reveal that lysosomal deficits are attributed to retromer dysfunction induced by altered retromer trafficking in the axon of AD-related mutant human amyloid precursor protein (hAPP) transgenic (Tg) mouse neurons. We demonstrate that retrograde transport of retromer is impaired, leading to its significant reduction in the soma and abnormal retention within late endosomes in distal axons of mutant hAPP neurons. Therefore, retromer-mediated endosome-to-Golgi retrieval of cation-independent mannose-6-phosphate receptors (CI-MPR) in the soma is disrupted in mutant hAPP neurons, causing defects in lysosome biogenesis. Such defects result in protease deficiency in lysosomes and impaired lysosomal proteolysis, as evidenced by aberrant accumulation of sequestered substrates within lysosomes. Intriguingly, enhancement of retrograde transport in mutant hAPP neurons facilitates the trafficking of axonal retromer toward the soma and thus enhances protease transport to lysosomes, thereby restoring lysosomal proteolytic activity. Taken together, our study provides new insights into the regulation of retromer trafficking through retrograde axonal transport to fulfil its function in promoting lysosome biogenesis in the soma, suggesting a potential approach for rescuing lysosomal proteolysis deficits in AD.


Figures

Figure 1.
Figure 1.
Impaired trafficking of the retromer toward the soma of mutant hAPP Tg neurons. (A and B) Representative images (A) and quantitative analysis (B) showing reduced targeting of the retromer proteins VPS35 and VPS26 to the soma of mutant hAPP Tg neurons. Note that the densities of somatic VPS35 and VPS26 were significantly reduced in mutant hAPP neurons. The mean intensity of VPS35 or VPS26 in the soma of hAPP neurons was normalized against that of MAP2 from the same neurons and compared to that of WT littermate controls. (C) Immunoisolation assay showing association of VPS35, VPS26 and CI-MPR with late endosomes in mouse brains. Rab7-associated late endosomes were immunoisolated with anti-Rab7-coated Dyna magnetic beads from light membrane fractions of mouse brains, followed by sequential immunoblotting on the same membranes after stripping between each antibody application. The purity of the preparation was confirmed by the absence of p115 (a Golgi marker) and cytochrome c (a mitochondrial marker). (D and E) Representative images (D) and quantitative analysis (E) showing aberrant retention of VPS35 within late endocytic organelles along mutant hAPP Tg axons. Note that the densities of VPS35 and late endosome-associated VPS35 were increased in hAPP axons. While late endosome-loaded VPS35 is marked by arrows, the non-late endosomal VPS35 is indicated by arrowheads. The percentage of VPS35 co-localized with Rab7-labeled late endosomes in the axons of WT and mutant hAPP neurons was quantified. The average numbers of total VPS35 or VPS35 associated with Rab7-labeled late endosomes per 10 μm axon in mutant hAPP neurons were further quantified and normalized to those of WT neurons, respectively (E). (F–H) Impaired retrograde transport of late endosome-loaded VPS35 in the axon of mutant hAPP Tg neurons. The relative motility of axonal VPS35 and late endosome-associated VPS35 was measured. Vertical lines represent stationary organelles; oblique lines or curves to the right represent anterograde movements; lines to the left indicate retrograde transport. Cortical neurons were transfected with GFP-VPS35 and mRFP-Rab7 at DIV5, followed by time-lapse imaging at DIV13-15. Note that a significant portion of VPS35 co-localized and co-migrated with late endosomes along the same axon of WT neurons. Data were quantified from a total number of neurons (n) as indicated in parentheses (E, F and G) or on the top of bars (B) from at least four independent repeats. Scale bars: 10 μm. Error bars: SEM. Student's t test: ***P < 0.001; **P < 0.01.
Figure 2.
Figure 2.
Reduced density of somatic retromer in mutant hAPP Tg mouse brains. (A–D) Representative images (A and B) and quantitative analysis (C and D) showing accumulation of the retromer protein VPS35 within late endosomes in hippocampal mossy fibers of mutant hAPP Tg mouse brains. Note that late endosome-loaded retromer was retained within dystrophic presynaptic terminals surrounding amyloid plaques. The average numbers of VPS35 clusters and VPS35 co-localized with SYP or Rab7 in the hippocampal mossy fiber per imaging slice section (320 μm × 320 μm) were quantified, respectively. (E and F) Reduced density of somatic VPS35 in the hippocampal neurons of mutant hAPP Tg mouse brains. The mean intensity of somatic VPS35 in hippocampal regions per imaging slice section (320 μm × 320 μm) was quantified. Scale bars: 10 μm. Data were quantified from a total number of imaging hippocampal slice sections indicated on the top of bars (C, D and E) from three pairs of mice. Error bars represent SEM. Student’s t test: ***P < 0.001.
Figure 3.
Figure 3.
Impaired Golgi targeting of CI-MPR in the soma of mutant hAPP Tg mouse neurons. (A and B) Reduced density of somatic CI-MPR in the hippocampal neurons of mutant hAPP Tg mouse brains. The mean intensity of somatic CI-MPR in hippocampal regions per imaging slice section (320 μm × 320 μm) was quantified. (C and D) Quantitative analysis (C) and representative images (D) showing that CI-MPR trafficking to the Golgi is decreased in hippocampal regions of mutant hAPP Tg mice. The Golgi targeting of CI-MPR was expressed as co-localized intensity of CI-MPR with GM130 (a Golgi marker) in the soma of hippocampal neurons. Scale bars: 10 μm. Data were quantified from a total number of imaging hippocampal slice sections indicated on the top of bars (B and C) from three pairs of mice. Error bars represent SEM. Student’s t test: ***P < 0.001.
Figure 4.
Figure 4.
Reduced protease density within lysosomes in mutant hAPP Tg neurons. (A) Active protease-loaded mature lysosomes are mainly located in the soma of neurons. The mature form of active Cathepsin D (CathD) was labeled by loading Bodipy FL-pepstatin A for 30 min, followed by fixation and immuostaining with antibodies against Cathepsin D or LAMP-1. Bodipy FL-pepstatin A selectively binds to a mature form of active Cathepsin D within mature acidic lysosomes. The co-labeled organelles reflect mature lysosomes (arrows) while puncta labeled by Cathepsin D or LAMP-1 alone are most likely immature Cathepsin D or immature lysosomes (arrowheads). Note that mature lysosomes labeled by both Bodipy FL-pepstatin A and LAMP-1 are barely detected in MAP2-indicated neuronal processes of cortical neurons. (B–D) Representative images (B) and quantitative analysis (C and D) showing reduced density of lysosomal Cathepsin D in cortical neurons from mutant hAPP Tg mice. Data were expressed as the mean intensity of LAMP-1 or active Cathepsin D or the co-localized mean intensity of LAMP-1 with active Cathepsin D, respectively. Note that the density of luminal active Cathepsin D within somatic lysosomes positive for both LAMP-1 and Bodipy FL-pepstatin A was significantly reduced in hAPP neurons. (E and F) Small hairpin RNA (shRNA)-mediated VPS35 knockdown in WT neurons. Cortical neurons were co-transfected with GFP and VPS35-shRNA or control shRNA at DIV 5, followed by immunostaining with antibodies against VPS35 and MAP2 at DIV10. Arrow points to a neuron with reduced fluorescence intensity of VPS35 in the soma following expressing VPS35-shRNA. The mean intensity of somatic VPS35 was quantified and normalized to that of MAP2 from the same neuron and to those of untransfected neurons from the same imaging fields before comparing to neurons transfected with control shRNA. (G and H) Reduced intensity of lysosomal active Cathepsin D labeled by Bodipy FL-pepstatin A in the soma of WT neurons expressing VPS35-shRNA. Quantitative data were expressed as normalized mean intensity of Bodipy FL-pepstatin A fluorescence in the soma of VPS35-shRNA expressed neurons relative to that of controls. Scale bars: 10 μm. Data were quantified from a total number of neurons indicated in parentheses (C) or on the top of bars (D, F and H) from at least three independent experiments. Error bars: SEM. Student's t test: ***P < 0.001; **P < 0.01.
Figure 5.
Figure 5.
Impaired lysosomal proteolysis in mutant hAPP Tg neurons. (A and B) Reduced degradation of internalized EGFR in mutant hAPP Tg neurons. Cortical neurons were co-immunostained with EGFR and MAP2 before or 3 or 7 h after EGF incubation (A). The mean intensity of EGFR was normalized against MAP2 from the same neurons and expressed as ratios relative to the mean intensity after 3 h EGF incubation (B). (C and D) Representative images (C) and quantitative analysis (D) showing aberrant accumulation of acidic mitochondria labeled by Keima-Mito within LAMP-1-marked lysosomal compartments in the soma of mutant hAPP Tg neurons. Visualization of acidic mitochondria is achieved by collecting emission of Keima-Mito at 550 nm. The number of acidic mitochondria within lysosomes per neuron was quantified. Scale bars: 10 μm. Data were quantified from a total number of neurons indicated in parentheses (B) or on the top of bars (D) from at least three independent experiments. Error bars: SEM. Student's t test: ***P < 0.001.
Figure 6.
Figure 6.
AD-linked lysosomal deficits in mutant hAPP Tg mouse brains. (A and B) Representative images (A) and quantitative analysis (B) showing reduced density of lysosomal hydrolase Cathepsin D (CathD) in the soma of the hippocampal regions of mutant hAPP Tg mice. Data were expressed as the mean intensity of Cathepsin D per imaging hippocampal slice section (320 μm × 320 μm). (C and D) Reduced density of lysosomal Cathepsin D in hippocampal neurons of mutant hAPP Tg mice. Note that the co-localized mean intensity of LAMP-1 with CathD is reduced in the soma of the hippocampal regions of mutant hAPP Tg mice. Data were expressed as the co-localized mean intensity of LAMP-1 with Cathepsin D per imaging hippocampal slice section (320 μm × 320 μm). (E and F) Quantitative analysis (E) and representative images (F) showing aberrant retention of mitochondria within lysosomes in the hippocampal regions of hAPP mice. Data were expressed as co-localized mean intensity of LAMP-1 with HSP60 per imaging hippocampal slice section (320 μm × 320 μm). Scale bars: 10 μm. Data were quantified from a total number of imaging hippocampal slice sections indicated on the top of bars (B, D and E) from three pairs of mice. Error bars: SEM. Student's t test: ***P < 0.001.
Figure 7.
Figure 7.
Increasing lysosomal delivery of proteases through enhanced retrograde transport of axonal retromer in mutant hAPP Tg neurons. (A–C) Representative kymographs (A) and quantitative analysis (B and C) showing enhanced retrograde transport of late endosomal retromer following overexpression of Snapin in mutant hAPP Tg neurons. (D and E) Increased density of active Cathepsin D (CathD) labeled by Bodipy FL-pepstatin A in the soma of hAPP neurons expressing Snapin. The mean intensities of Bodipy FL-pepstatin A in the soma of hAPP neurons in the presence and absence of Snapin from the same imaging fields were quantified. Scale bars: 10 μm. Data were quantified from a total number of neurons indicated in parentheses (B and C) or on the top of bars (E) from at least three independent experiments. Error bars represent SEM. Student’s t test: ***p < 0.001.
Figure 8.
Figure 8.
Enhanced retrograde transport-resulted attenuation of lysosomal proteolysis deficits in mutant hAPP neurons. (A and B) Snapin-enhanced retrograde transport reduces accumulation of acidic mitochondria within lysosomes in the soma of hAPP neurons. The average number of acidic mitochondria within lysosomes in the soma of neurons was quantified. (C and D) Representative images (C) and quantitative analysis (D) showing that elevated Snapin expression facilitates lysosomal clearance of autophagic cargoes in hAPP neurons. Note that autolysosomes were accumulated in hAPP neurons, but were markedly reduced following overexpression of Snapin. The average number of autolysosomes co-labeled by GFP-LC3 and mRFP-LAMP-1 in the soma of neurons was quantified. Scale bars: 10 μm. Data were quantified from a total number of neurons (n) as indicated on the top of the bar (B and D) from at least four independent repeats. Error bars: SEM. Student's t test: ***P < 0.001.

Similar articles

Cited by

References

    1. Luzio J.P., Pryor P.R., Bright N.A. (2007) Lysosomes: fusion and function. Nat. Rev. Mol. Cell. Biol., 8, 622–632. - PubMed
    1. Saftig P., Klumperman J. (2009) Lysosome biogenesis and lysosomal membrane proteins: trafficking meets function. Nat. Rev. Mol. Cell. Biol., 10, 623–635. - PubMed
    1. Saftig P., Haas A. (2016) Turn up the lysosome. Nat. Cell. Biol., 18, 1025–1027. - PubMed
    1. Nixon R.A. (2005) Endosome function and dysfunction in Alzheimer's disease and other neurodegenerative diseases. Neurobiol. Aging, 26, 373–382. - PubMed
    1. Nixon R.A., Cataldo A.M. (2006) Lysosomal system pathways: genes to neurodegeneration in Alzheimer's disease. J. Alzheimers Dis., 9, 277–289. - PubMed

Publication types

Substances