. 2017 Oct 1;58(12):4940-4947.
doi: 10.1167/iovs.17-22540.

Imaging Lenticular Autofluorescence in Older Subjects

Affiliations

Imaging Lenticular Autofluorescence in Older Subjects

Jason Charng et al. Invest Ophthalmol Vis Sci. .

Abstract

Purpose: To evaluate whether a practical method of imaging lenticular autofluorescence (AF) can provide an individualized measure correlated with age-related lens yellowing in older subjects undergoing tests involving shorter wavelength lights.

Methods: Lenticular AF was imaged with 488-nm excitation using a confocal scanning laser ophthalmoscope (cSLO) routinely used for retinal AF imaging. There were 75 older subjects (ages 47-87) at two sites; a small cohort of younger subjects served as controls. At one site, the cSLO was equipped with an internal reference to allow quantitative AF measurements; at the other site, reduced-illuminance AF imaging (RAFI) was used. In a subset of subjects, lens density index was independently estimated from dark-adapted spectral sensitivities performed psychophysically.

Results: Lenticular AF intensity was significantly higher in the older eyes than the younger cohort when measured with the internal reference (59.2 ± 15.4 vs. 134.4 ± 31.7 gray levels; P < 0.05) as well as when recorded with RAFI without the internal reference (10.9 ± 1.5 vs. 26.1 ± 5.7 gray levels; P < 0.05). Lenticular AF was positively correlated with age; however, there could also be large differences between individuals of similar age. Lenticular AF intensity correlated well with lens density indices estimated from psychophysical measures.

Conclusions: Lenticular AF measured with a retinal cSLO can provide a practical and individualized measure of lens yellowing, and may be a good candidate to distinguish between preretinal and retinal deficits involving short-wavelength lights in older eyes.


Figures
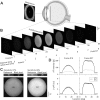
Figure 1
Figure 1
Depth-resolved quantitative autofluorescence (qAF) imaging of the human lens. (A, B) A confocal scanning laser ophthalmoscope is first focused on the iris in infrared reflectance mode (A), and then optical sectioning tomography (64 slices) is performed over 8-mm depth from anterior to posterior direction using AF imaging with short-wavelength (488 nm) excitation (B). Autofluorescence intensity increases as the focal plane moves from the anterior segment to the middle of the lens; there is a decline in intensity as the focus shifts toward posterior lens. (C, D) Representative results in a subject obtained with two sensitivity settings to evaluate the range of linearity and saturation. Lenticular qAF (L-qAF) images at frame #27 (corresponding to peak intensity) and the corresponding calibration reference and black level images; numbers represent the raw gray level values averaged over a 60 × 60-pixel region at pupil center and 200 × 18-pixel regions for the reference and black level (C). Plots show AF intensity as raw gray level values as a function of distance along the horizontal axis (upper plot), and the corresponding L-qAF calculation (lower plot) at frames #18 and #27. The results generated by the two sensitivity settings become nearly identical after conversion from raw gray levels to L-qAF.
Figure 2
Figure 2
Lenticular quantitative autofluorescence (L-qAF). (A, B) Lenticular qAF (L-qAF) in two representative older eyes (ages 70, 73) of similar age plotted against distance along optical axis (black lines) shows single-peaked curves with different maximal values. Dashed lines show the average L-qAF in younger eyes. Insets, peak L-AF frames for each eye on a pseudocolor scale. (C) Lenticular qAF values plotted against age. Dashed line depicts the linear regression fit to the whole cohort. Triangles indicate the two representative subjects shown in (A, B).
Figure 3
Figure 3
Lenticular autofluorescence without the internal fluorescence reference. (A, B) Lenticular autofluorescence (L-AF) imaging in two representative older eyes (ages 56, 55) of similar age plotted against distance along optical axis (solid black lines) show higher intensities compared with the average of younger eyes (dashed line). Insets, peak L-AF frames for both older eyes on an adjusted gray scale to allow visualization. (C) Lenticular autofluorescence values plotted against age. Dashed line depicts the linear regression fit to the whole cohort. Triangles indicate the two representative subjects shown in (A, B).
Figure 4
Figure 4
Correlation of perceptual lens density index with lenticular autofluorescence (L-AF). (A) Psychophysical estimation of lens density index involves consideration of the spectral sensitivity of rhodopsin (RHO), lens transmission component 1 (TL1), and lens transmission component 2 (TL2). Both RHO and TL2 sensitivity were held invariant among subjects, whereas TL1 was scaled individually for each subject to adjust the spectral shape. S representing the sum of RHO, TL1, and TL2 shows the expected changes in the scotopic sensitivity spectrum as a function of the scaling parameter. (B) Dark-adapted spectral sensitivity functions (solid lines) in two representative subjects estimated from sensitivities assessed at 420, 500, 560, and 650 nm (circles, average ± SD). Shown is a 63-year-old with a lower lens density index (upper) compared with another subject of similar age with a higher lens density index (lower). Gray lines depict the standard scotopic luminosity function. (C) Lenticular autofluorescence peak intensity [gl] plotted against perceptual lens density estimates obtained from scotopic sensitivity values [log]. Regression line is shown.

Similar articles

Cited by

References

    1. Sobrin L, Seddon JM. . Nature and nurture- genes and environment- predict onset and progression of macular degeneration. Prog Retin Eye Res. 2014; 40: 1– 15. - PMC - PubMed
    1. Owsley C, Jackson GR, Cideciyan AV,et al. . Psychophysical evidence for rod vulnerability in age-related macular degeneration. Invest Ophthalmol Vis Sci. 2000; 41: 267– 273. - PubMed
    1. Holz FG, Steinberg JS, Gobel A, Fleckenstein M, Schmitz-Valckenberg S. . Fundus autofluorescence imaging in dry AMD: 2014 Jules Gonin lecture of the Retina Research Foundation. Graefes Arch Clin Exp Ophthalmol. 2015; 253: 7– 16. - PubMed
    1. Fraser RG, Tan R, Ayton LN, Caruso E, Guymer RH, Luu CD. . Assessment of retinotopic rod photoreceptor function using a dark-adapted chromatic perimeter in intermediate age-related macular degeneration. Invest Ophthalmol Vis Sci. 2016; 57: 5436– 5442. - PubMed
    1. Gliem M, Muller PL, Finger RP, McGuinness MB, Holz FG, Charbel Issa P. . Quantitative fundus autofluorescence in early and intermediate age-related macular degeneration. JAMA Ophthalmol. 2016; 134: 817– 824. - PubMed

Publication types