. 2017 Sep 29;45(17):9947-9959.
doi: 10.1093/nar/gkx600.

Quantitative proteomics reveals that long non-coding RNA MALAT1 interacts with DBC1 to regulate p53 acetylation

Affiliations

Quantitative proteomics reveals that long non-coding RNA MALAT1 interacts with DBC1 to regulate p53 acetylation

Ruibing Chen et al. Nucleic Acids Res. .

Erratum in

Abstract

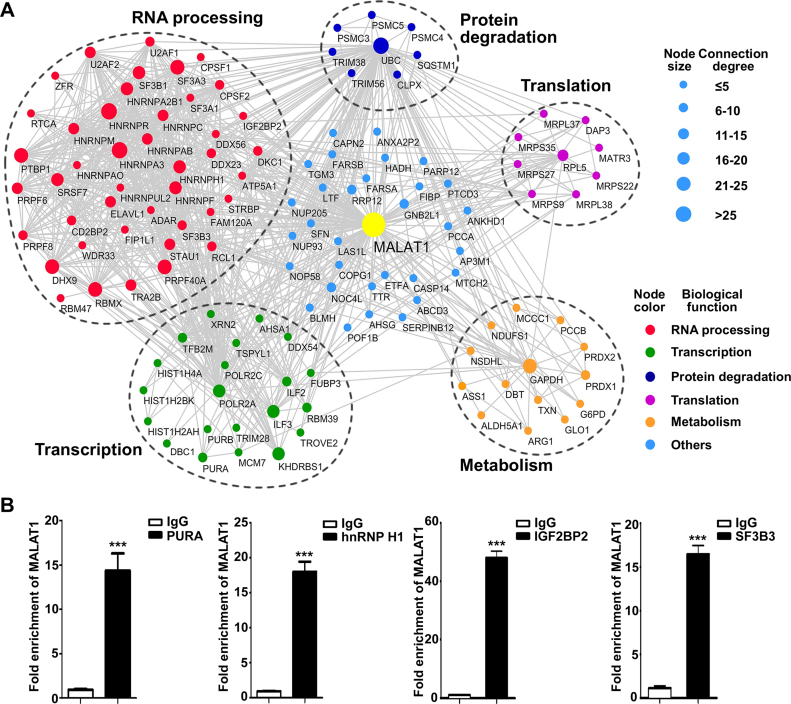
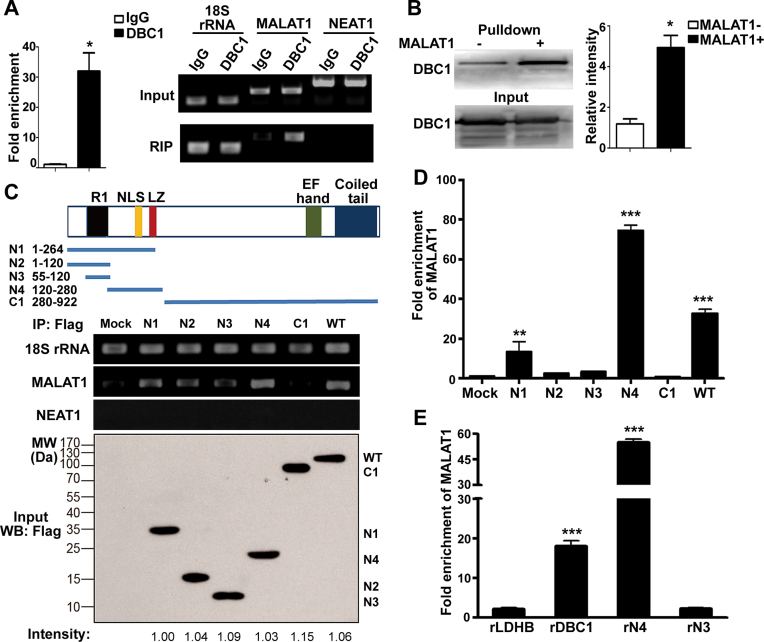
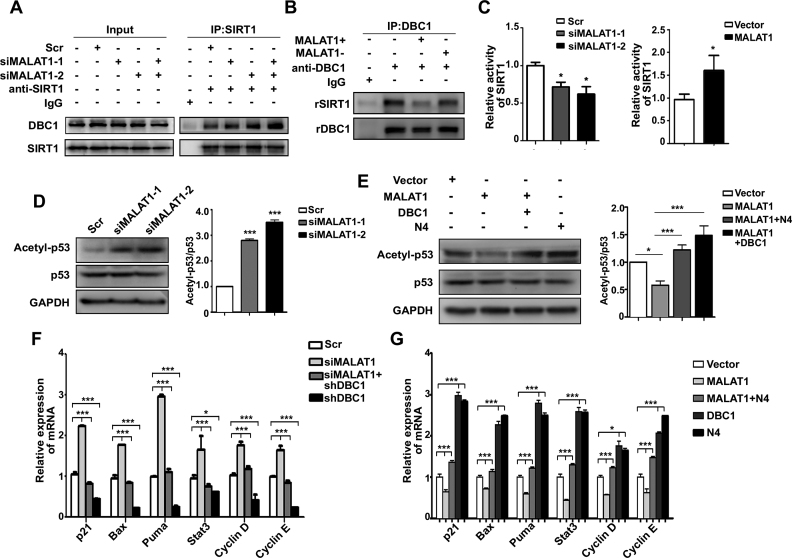
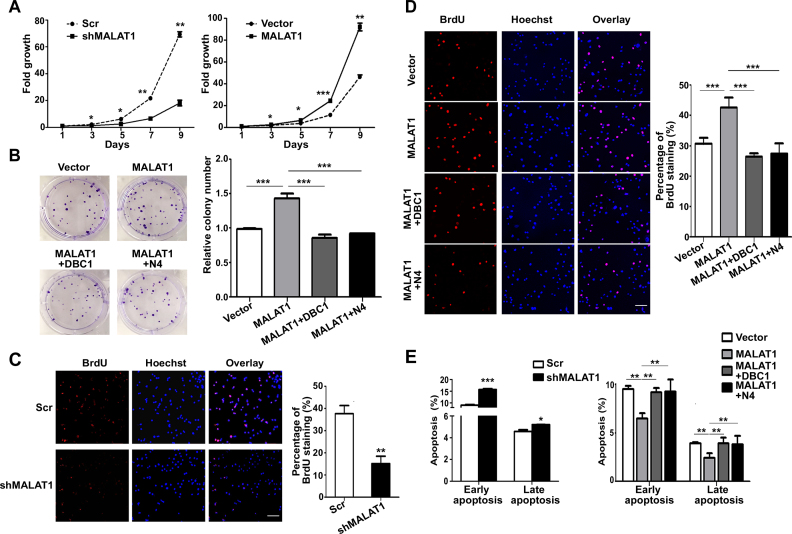
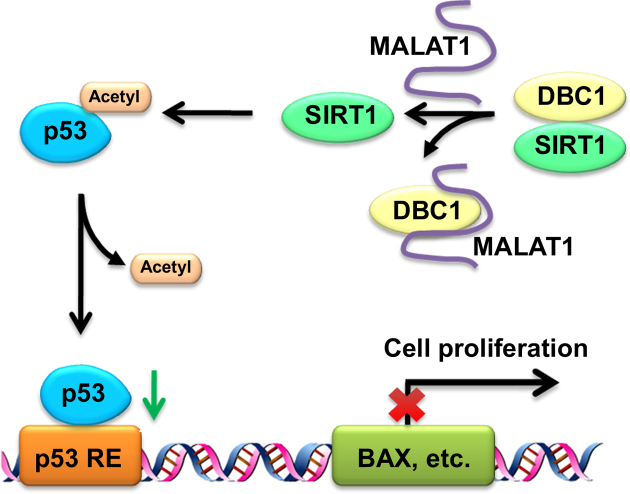
Metastasis-associated lung adenocarcinoma transcript 1 (MALAT1) is a broadly expressed lncRNA involved in many aspects of cellular processes. To further delineate the underlying molecular mechanism, we employed a high-throughput strategy to characterize the interacting proteins of MALAT1 by combining RNA pull-down, quantitative proteomics, bioinformatics, and experimental validation. Our approach identified 127 potential MALAT1-interacting proteins and established a highly connected MALAT1 interactome network consisting of 788 connections. Gene ontology annotation and network analysis showed that MALAT1 was highly involved in five biological processes: RNA processing; gene transcription; ribosomal proteins; protein degradation; and metabolism regulation. The interaction between MALAT1 and depleted in breast cancer 1 (DBC1) was validated using RNA pull-down and RNA immunoprecipitation. Further mechanistic studies reveal that MALAT1 binding competes with the interaction between sirtuin1 (SIRT1) and DBC1, which then releases SIRT1 and enhances its deacetylation activity. Consequently, the deacetylation of p53 reduces the transcription of a spectrum of its downstream target genes, promotes cell proliferation and inhibits cell apoptosis. Our results uncover a novel mechanism by which MALAT1 regulates the activity of p53 through the lncRNA-protein interaction.


Figures

Figure 1.
Figure 1.
Overview of the experimental workflow. Cells were cultured in the SILAC medium. Sense and antisense MALAT1 chains were randomly incorporated with biotin-16-UTP using in vitro transcription. The synthesized MALAT1 was incubated with cellular proteins extracted from SILAC-labeled HepG2 cells. The antisense MALAT1 was used as a negative control and processed in parallel. The MALAT1-interacting proteins were pulled down using streptavidin-conjugated magnetic beads. Then, the beads were mixed and separated using SDS-PAGE. Each gel lane was divided into ten bands and digested with trypsin for LC–MS/MS analyses.
Figure 2.
Figure 2.
Network representation of the MALAT1-interacting proteins and validation of selected identified MALAT1-interacting proteins using RIP. (A) The PPI information was obtained through a database search using String 9.0 and GeneMANIA, incorporated with lncRNA–protein interactions identified in this study, and imported into Cytoscape 3.1.1 for network construction. Proteins and their interactions are shown as nodes and edges. The node size reflects the interaction degree. The proteins are grouped based on their biological functions, as represented by the node color. (B) RIP enrichment was determined as the relative levels of MALAT1 in the immunoprecipitates of PURA, hnRNP H1, IGF2BP2, and SF3B3 compared with the IgG control, and 18S rRNA was used as internal standard. Data represent the means ± SD of triplicate independent analyses (***P < 0.001, by Student's t-test).
Figure 3.
Figure 3.
MALAT1 directly interacts with the aa120–280 region of DBC1. (A) qRT-PCR analysis of MALAT1 in the immunoprecipitates of DBC1 as compared to the IgG control, and 18S rRNA was used as internal standard (left panel). Data represent the means ± SD of triplicate independent analyses (*P < 0.05, by Student's t-test). Agarose gel electrophoresis analysis of the qRT-PCR products of MALAT1, 18S rRNA and NEAT1 in the cell lysates and immunoprecipitates of DBC1 (right panel). (B) RNA pull-down experiment showed the interaction between DBC1 and MALAT1. Biotin-labeled MALAT1 fragment (6918–8441 nt) was incubated with HepG2 cell lysates, and the enriched DBC1 was detected by western blot. The antisense MALAT1 was used as control. The right panel shows the relative intensities of DBC1 in the immunoblots of MALAT1 pull-down as compared to the antisense control (*P < 0.05, by Student's t-test). (C) Schematic diagram of the plasmids encoding Flag-tagged full-length or the fragments of DBC1 (upper panel). Lower panel: plasmids encoding Flag-tagged full-length or fragments of DBC1 were transfected in the HepG2 cells, and their expression levels were detected by western blot. RIP of each fragment was performed using the anti-Flag antibody, and qRT-PCR was used to determine the enriched levels of MALAT1, 18S rRNA, and NEAT1 in the immunoprecipitates. Normal HepG2 cells were used as control. (D) Histogram represents the fold enrichment of MALAT1 in the Flag immunoprecipitates as measured by qRT-PCR. Data represent the means ± SD of triplicate independent analyses (**P < 0.01; ***P < 0.001, by one-way ANOVA). (E) In vitro His-tag pull-down assay using rDBC1, DBC1-N3, and DBC1-N4. 2 μg of recombinant protein purified from E. coli was incubated with 1 μg of in vitro transcribed sense MALAT1 or antisense MALAT1 for 1 h at 4 °C. The recombinant proteins were isolated using Dynabeads® His-tag isolation magnetic beads. The enriched MALAT1 was examined using qRT-PCR. An irrelevant protein rLDHB was used as negative control. Data represent the means ± SD of triplicate independent experiments (***P < 0.001, by Student's t-test).
Figure 4.
Figure 4.
MALAT1 regulates the activities of p53 via DBC1. (A) Co-IP of SIRT1 in control and MALAT1-knockdown HepG2 cells. SIRT1 and DBC1 were detected by western blot analysis. (B) Co-IP of SIRT1 and DBC1 in vitro. 2 μg of rDBC1 and rSIRT1 were incubated with 1 μg of in vitro transcribed sense MALAT1 or antisense MALAT1 for 1 h at 4°C. Next, DBC1 was isolated with anti-DBC1 antibody, and SIRT1 and DBC1 in the immunoprecipitates were analyzed by western blot. (C) The deacetylation activity of SIRT1 in MALAT1-knockdown (left panel) and MALAT1-overexpressing (right panel) HepG2 cells. The data are means ± SD of triplicate independent experiments (*P < 0.05, by Student's t-test). (D) Western blot of acetyl-p53 and p53 in MALAT1-downregulated cells (left panel). The histogram shows the relative intensities of p53 acetylation verses total p53 levels (right panel) measured by the ImageJ software (http://rsb.info.nih.gov/ij/index.html). Data represent the means ± SD (***P < 0.001, by one-way ANOVA). (E) Western blot analysis of acetyl-p53 and p53 in the HepG2 cells transfected with MALAT1 expression plasmid, co-transfected with expression plasmids encoding MALAT1 and full-length DBC1 or DBC1-N4 fragment (left panel). Histogram shows the relative intensities of p53 acetylation verses total p53 levels measured by ImageJ (right panel). Data represent the means ± SD (*P < 0.05; ***P < 0.001, by one-way ANOVA). qRT-PCR analysis of p53 target genes in MALAT1-knockdown cells (F) and MALAT1-overexpressing cells (G). Data represent means ± SD of four independent experiments (*P < 0.05 and ***P < 0.001, by one-way ANOVA).
Figure 5.
Figure 5.
MALAT1 regulates cell proliferation and apoptosis in HepG2 cells through binding with DBC1. (A) The growth curve of MALAT1-downregulated cells (left panel) and MALAT1-overexpressed cells (right panel) over 9 days. Cells (2 × 10⁵) were seeded in each well, and the cell numbers were counted every 48 h. Data are from three independent assays. Bar, mean; error bar, SD (*P < 0.05, **P < 0.01, ***P < 0.001, by repeated measures ANOVA). (B) Colony-formation assay of HepG2-MALAT1 and HepG2 cells co-transfected with both MALAT1 and DBC1 or DBC1-N4. Representative images show the results of the colony-formation assay (left panel). Histogram shows the relative colony numbers (right panel). Data are from three independent assays. Bar, mean; error bar, SD (***P < 0.001, by one-way ANOVA). BrdU incorporation analysis of MALAT1-knockdown HepG2 cells (C) and MALAT1-overexpressing cells with or without the overexpression of full-length or N4 fragment of DBC1 respectively (D). Representative images showing alterations in S phase distribution (left panel). Histogram shows the percentage of BrdU staining (right panel). Data are from three independent assays. Bar, mean; error bar, SD (**P < 0.01, ***P < 0.001, by Student's t-test or one-way ANOVA). (E) Annexin V assay for analyzing cell apoptosis in HepG2 cells transfected with shMALAT1 plasmid (left panel) or MALAT1-overexpressing plasmid with or without co-transfection of full-length or N4 fragment of DBC1 respectively (right panel). Data are from three independent assays. Bar, mean; error bar, SD (*P < 0.05, **P < 0.01, ***P < 0.001, by Student's t-test or one-way ANOVA).
Figure 6.
Figure 6.
The proposed mechanism of MALAT1 regulating p53 through interacting with DBC1. MALAT1 binds with DBC1, inhibits the interaction between DBC1 and SIRT1, and enhances the deacetylation activity of SIRT1. The upregulation of MALAT1 reduces p53 acetylation as well as impairs its transcription activity, and thus inhibits the functions of p53.

Comment in

References

    1. ENCODE Project Consortium An integrated encyclopedia of DNA elements in the human genome. Nature. 2012; 489:57–74. - PMC - PubMed
    1. Ponting C.P., Belgard T.G.. Transcribed dark matter: meaning or myth? Hum. Mol. Genet. 2010; 19:R162–R168. - PMC - PubMed
    1. Birney E., Stamatoyannopoulos J.A., Dutta A., Guigo R., Gingeras T.R., Margulies E.H., Weng Z., Snyder M., Dermitzakis E.T., Thurman R.E. et al. . Identification and analysis of functional elements in 1% of the human genome by the ENCODE pilot project. Nature. 2007; 447:799–816. - PMC - PubMed
    1. Batista P.J., Chang H.Y.. Long noncoding RNAs: cellular address codes in development and disease. Cell. 2013; 152:1298–1307. - PMC - PubMed
    1. Guttman M., Rinn J.L.. Modular regulatory principles of large non-coding RNAs. Nature. 2012; 482:339–346. - PMC - PubMed

MeSH terms