

MutSβ abundance and Msh3 ATP hydrolysis activity are important drivers of CTG•CAG repeat expansions
- PMID: 28973443
- PMCID: PMC5622409
- DOI: 10.1093/nar/gkx650
MutSβ abundance and Msh3 ATP hydrolysis activity are important drivers of CTG•CAG repeat expansions
Abstract
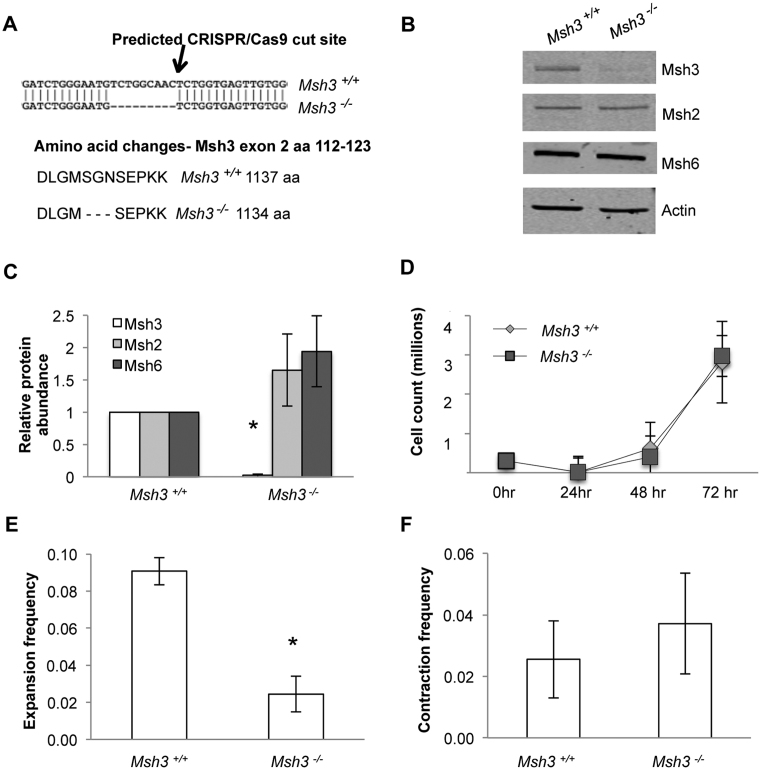
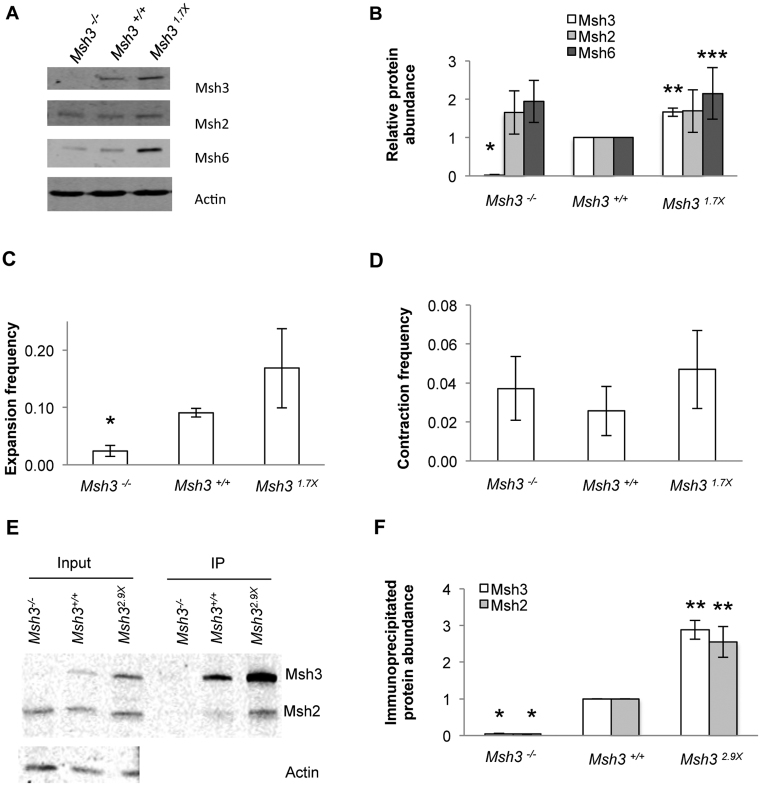
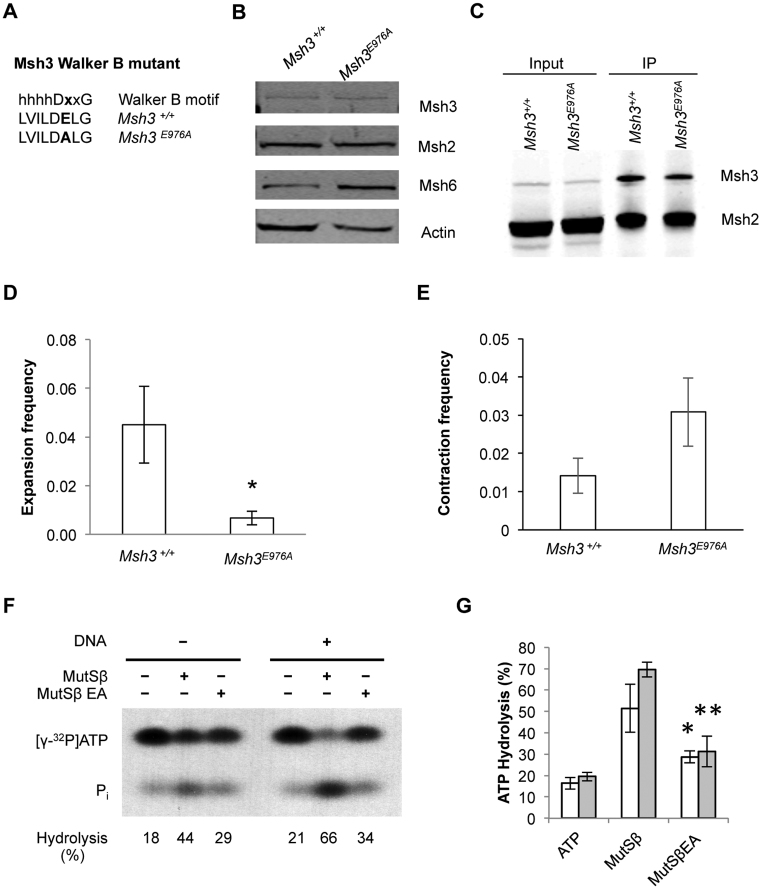
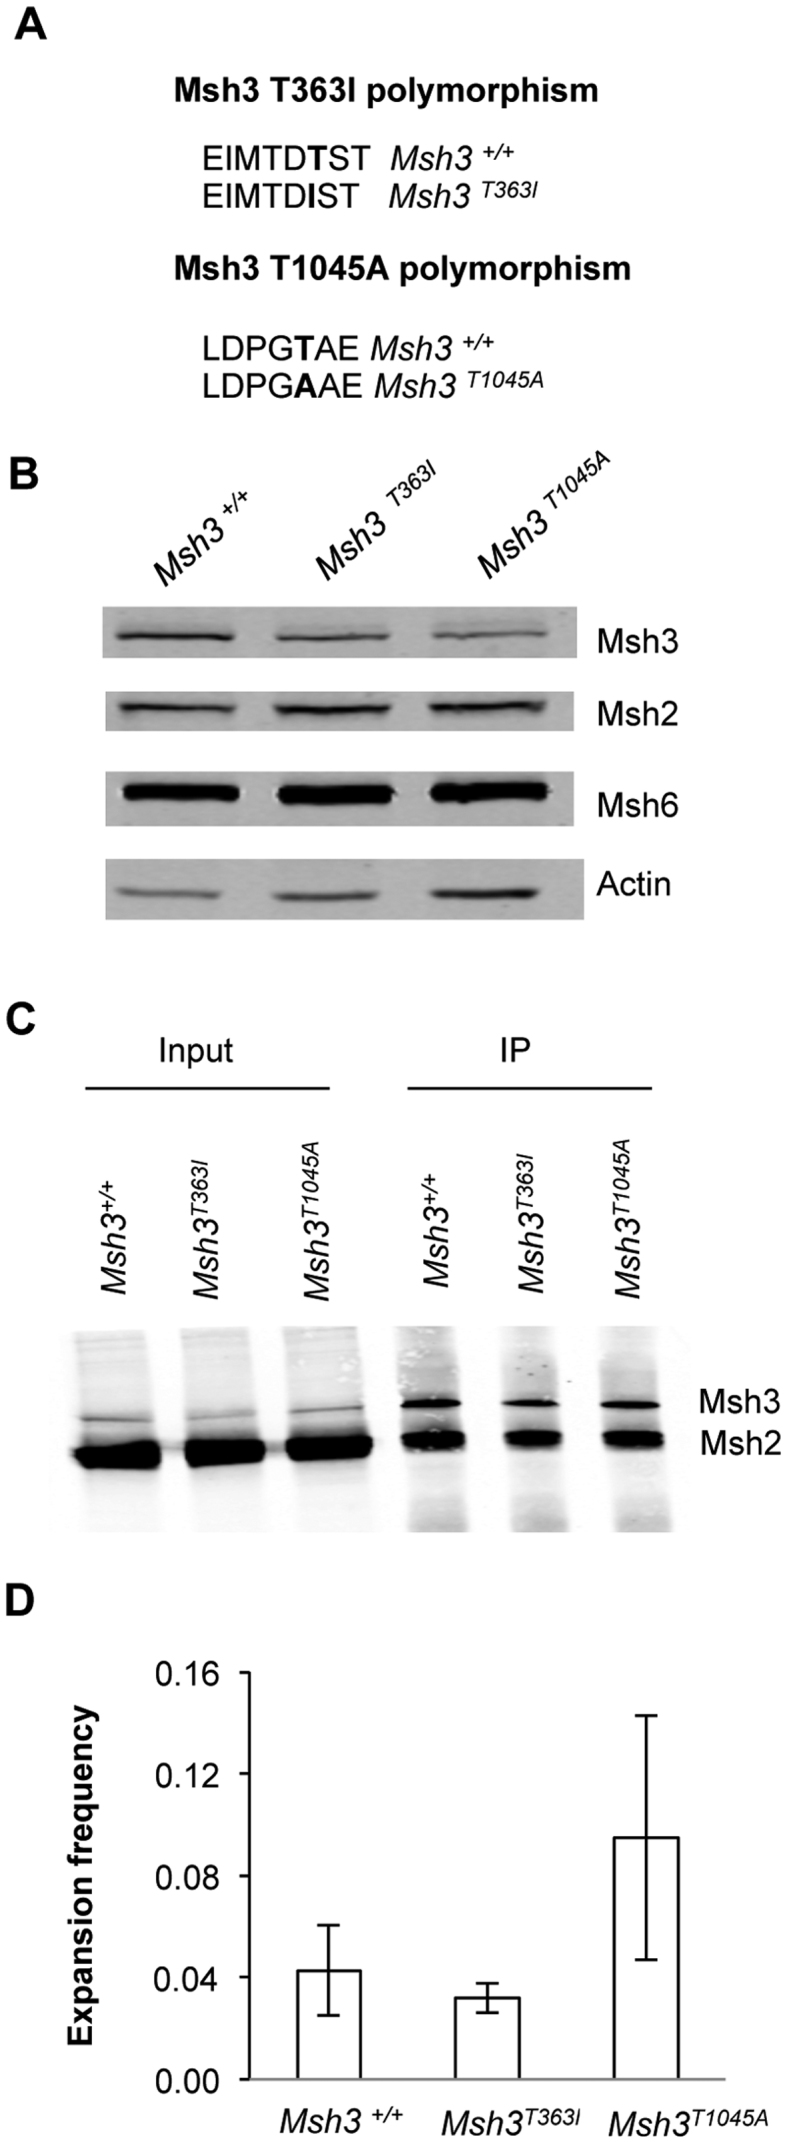
CTG•CAG repeat expansions cause at least twelve inherited neurological diseases. Expansions require the presence, not the absence, of the mismatch repair protein MutSβ (Msh2-Msh3 heterodimer). To evaluate properties of MutSβ that drive expansions, previous studies have tested under-expression, ATPase function or polymorphic variants of Msh2 and Msh3, but in disparate experimental systems. Additionally, some variants destabilize MutSβ, potentially masking the effects of biochemical alterations of the variations. Here, human Msh3 was mutated to selectively inactivate MutSβ. Msh3-/- cells are severely defective for CTG•CAG repeat expansions but show full activity on contractions. Msh3-/- cells provide a single, isogenic system to add back Msh3 and test key biochemical features of MutSβ on expansions. Msh3 overexpression led to high expansion activity and elevated levels of MutSβ complex, indicating that MutSβ abundance drives expansions. An ATPase-defective Msh3 expressed at normal levels was as defective in expansions as Msh3-/- cells, indicating that Msh3 ATPase function is critical for expansions. Expression of two Msh3 polymorphic variants at normal levels showed no detectable change in expansions, suggesting these polymorphisms primarily affect Msh3 protein stability, not activity. In summary, CTG•CAG expansions are limited by the abundance of MutSβ and rely heavily on Msh3 ATPase function.
© The Author(s) 2017. Published by Oxford University Press on behalf of Nucleic Acids Research.
Figures
Similar articles
-
Coordinated roles of SLX4 and MutSβ in DNA repair and the maintenance of genome stability.Crit Rev Biochem Mol Biol. 2021 Apr;56(2):157-177. doi: 10.1080/10409238.2021.1881433. Epub 2021 Feb 17. Crit Rev Biochem Mol Biol. 2021. PMID: 33596761 Free PMC article. Review.
-
MSH2 ATPase domain mutation affects CTG*CAG repeat instability in transgenic mice.PLoS Genet. 2009 May;5(5):e1000482. doi: 10.1371/journal.pgen.1000482. Epub 2009 May 15. PLoS Genet. 2009. PMID: 19436705 Free PMC article.
-
Absence of MutSβ leads to the formation of slipped-DNA for CTG/CAG contractions at primate replication forks.DNA Repair (Amst). 2016 Jun;42:107-18. doi: 10.1016/j.dnarep.2016.04.002. Epub 2016 Apr 16. DNA Repair (Amst). 2016. PMID: 27155933 Free PMC article.
-
MutSβ and histone deacetylase complexes promote expansions of trinucleotide repeats in human cells.Nucleic Acids Res. 2012 Nov 1;40(20):10324-33. doi: 10.1093/nar/gks810. Epub 2012 Aug 31. Nucleic Acids Res. 2012. PMID: 22941650 Free PMC article.
-
Disease-associated repeat instability and mismatch repair.DNA Repair (Amst). 2016 Feb;38:117-126. doi: 10.1016/j.dnarep.2015.11.008. Epub 2015 Dec 12. DNA Repair (Amst). 2016. PMID: 26774442 Review.
Cited by
-
Double strand breaks drive toxicity in Huntington's disease mice with or without somatic expansion.bioRxiv [Preprint]. 2025 May 28:2025.05.27.654663. doi: 10.1101/2025.05.27.654663. bioRxiv. 2025. PMID: 40501854 Free PMC article. Preprint.
-
Mutant huntingtin protein induces MLH1 degradation, DNA hyperexcision, and cGAS-STING-dependent apoptosis.Proc Natl Acad Sci U S A. 2024 Mar 26;121(13):e2313652121. doi: 10.1073/pnas.2313652121. Epub 2024 Mar 18. Proc Natl Acad Sci U S A. 2024. PMID: 38498709 Free PMC article.
-
DNA mismatch repair in trinucleotide repeat instability.Sci China Life Sci. 2017 Oct;60(10):1087-1092. doi: 10.1007/s11427-017-9186-7. Epub 2017 Oct 24. Sci China Life Sci. 2017. PMID: 29075942 Free PMC article. Review.
-
Coordinated roles of SLX4 and MutSβ in DNA repair and the maintenance of genome stability.Crit Rev Biochem Mol Biol. 2021 Apr;56(2):157-177. doi: 10.1080/10409238.2021.1881433. Epub 2021 Feb 17. Crit Rev Biochem Mol Biol. 2021. PMID: 33596761 Free PMC article. Review.
-
De novo mutations, genetic mosaicism and human disease.Front Genet. 2022 Sep 26;13:983668. doi: 10.3389/fgene.2022.983668. eCollection 2022. Front Genet. 2022. PMID: 36226191 Free PMC article. Review.
References
-
- Orr H.T., Zoghbi H.Y.. Trinucleotide repeat disorders. Annu. Rev. Neurosci. 2007; 30:575–621. - PubMed
-
- Lopez Castel A., Cleary J.D., Pearson C.E.. Repeat instability as the basis for human diseases and as a potential target for therapy. Nat. Rev. Mol. Cell. Biol. 2010; 11:165–170. - PubMed
-
- Palombo F., Iaccarino I., Nakajima E., Ikejima M., Shimada T., Jiricny J.. hMutSbeta, a heterodimer of hMSH2 and hMSH3, binds to insertion/deletion loops in DNA. Curr. Biol. 1996; 6:1181–1184. - PubMed
MeSH terms
Substances
Supplementary concepts
Grants and funding
LinkOut - more resources
Full Text Sources
Other Literature Sources
Research Materials
