. 2017 Sep 29;45(17):10042-10055.
doi: 10.1093/nar/gkx635.

Modulation of proteostasis counteracts oxidative stress and affects DNA base excision repair capacity in ATM-deficient cells

Affiliations

Modulation of proteostasis counteracts oxidative stress and affects DNA base excision repair capacity in ATM-deficient cells

Mattia Poletto et al. Nucleic Acids Res. .

Abstract

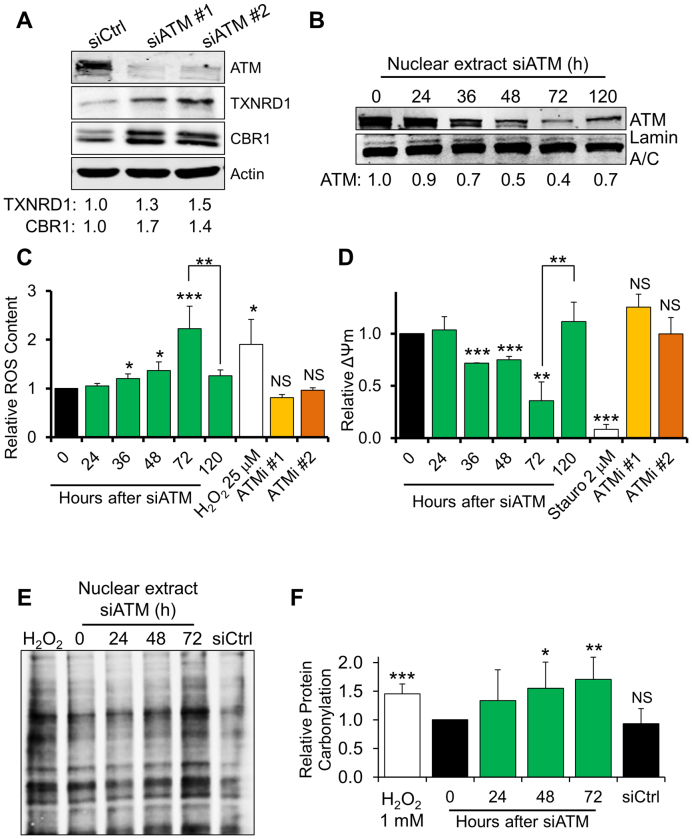
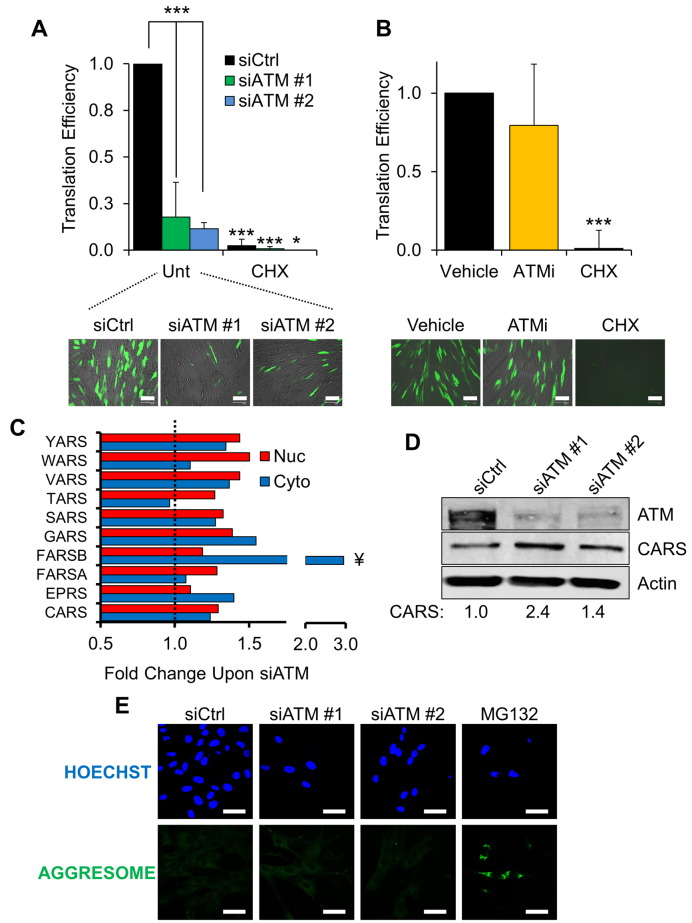
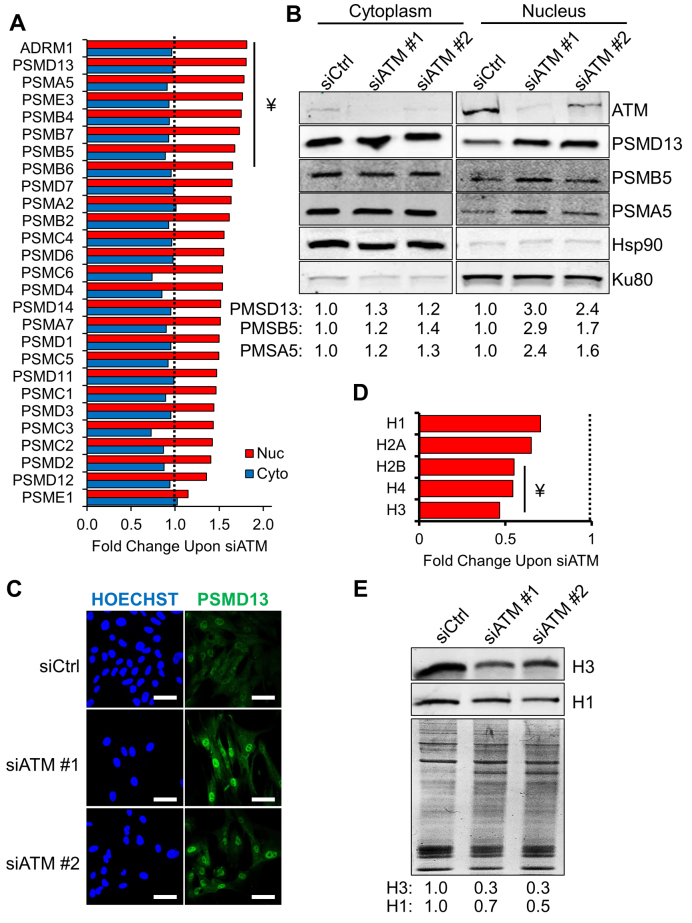
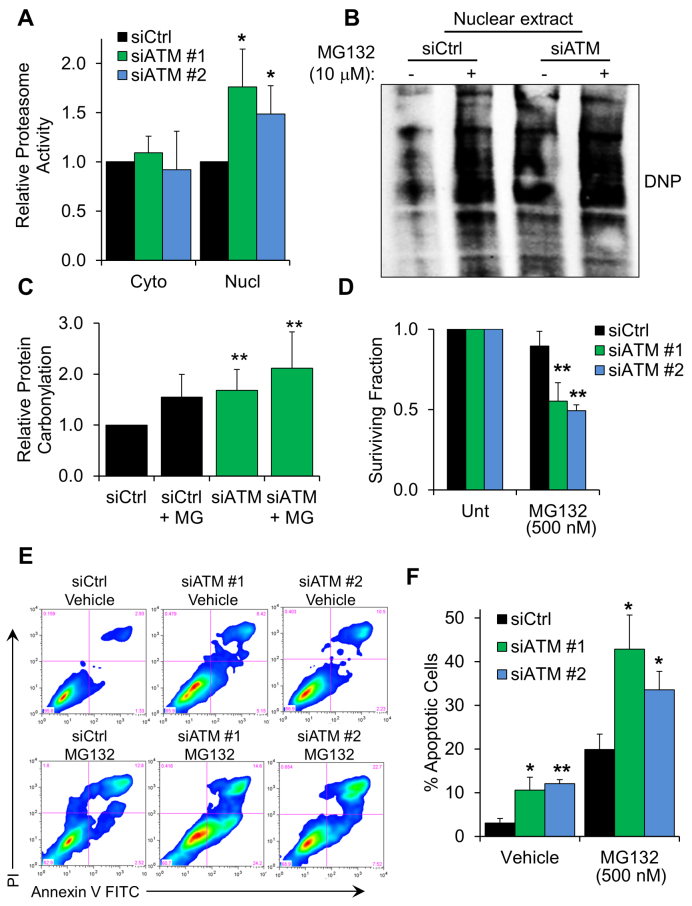
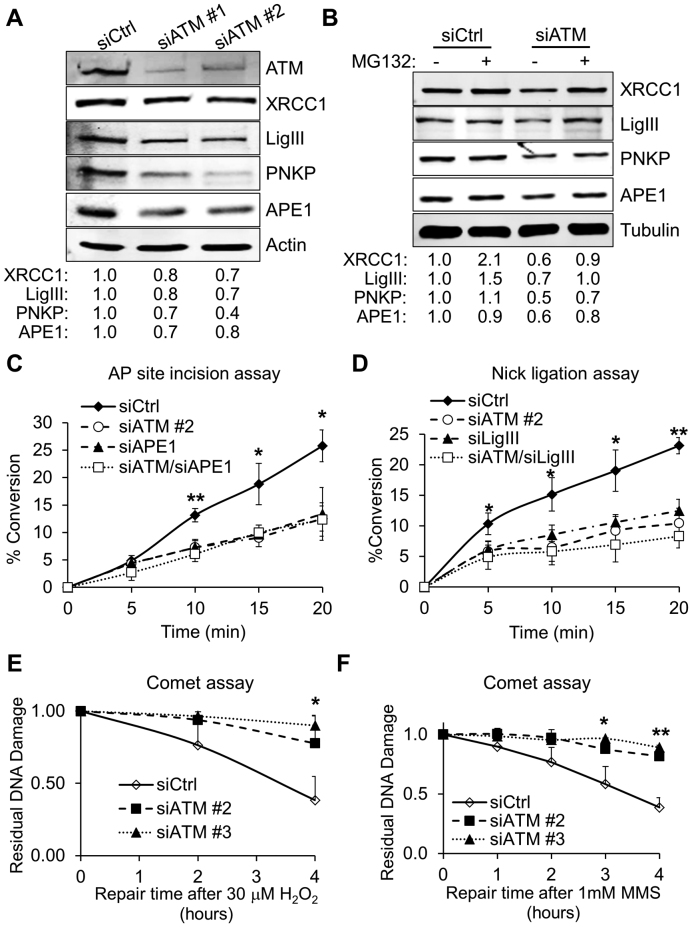
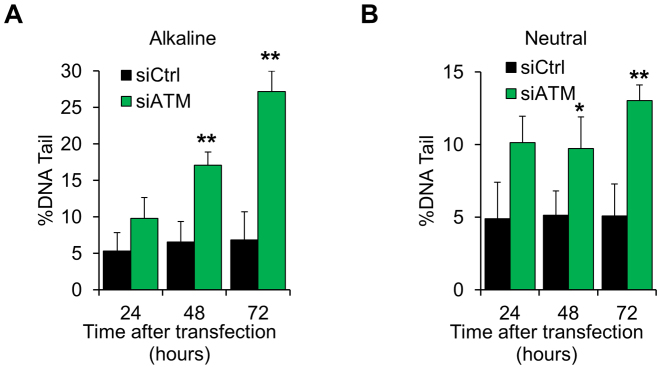
Ataxia telangiectasia (A-T) is a syndrome associated with loss of ATM protein function. Neurodegeneration and cancer predisposition, both hallmarks of A-T, are likely to emerge as a consequence of the persistent oxidative stress and DNA damage observed in this disease. Surprisingly however, despite these severe features, a lack of functional ATM is still compatible with early life, suggesting that adaptation mechanisms contributing to cell survival must be in place. Here we address this gap in our knowledge by analysing the process of human fibroblast adaptation to the lack of ATM. We identify profound rearrangement in cellular proteostasis occurring very early on after loss of ATM in order to counter protein damage originating from oxidative stress. Change in proteostasis, however, is not without repercussions. Modulating protein turnover in ATM-depleted cells also has an adverse effect on the DNA base excision repair pathway, the major DNA repair system that deals with oxidative DNA damage. As a consequence, the burden of unrepaired endogenous DNA lesions intensifies, progressively leading to genomic instability. Our study provides a glimpse at the cellular consequences of loss of ATM and highlights a previously overlooked role for proteostasis in maintaining cell survival in the absence of ATM function.


Figures

Figure 1.
Figure 1.
ATM-depleted fibroblasts progressively accumulate ROS and oxidative protein damage. (A) Representative Western blot analysis on ATM-depleted fibroblasts showing upregulation of proteins involved in the antioxidant response. TIG1 cells were transfected with either a control siRNA (siCtrl) or an ATM-targeting siRNA (siATM#1, siATM #2). Actin was used as loading control. Densitometric quantification of the indicated proteins is reported at the bottom of the gel (N = 2). (B) Western blot analysis on a representative time course depletion of ATM. TIG1 fibroblasts were treated as indicated and ATM expression was monitored in nuclear cell extracts. Lamin A/C was used as loading control. (C) Quantification of ROS content using flow-cytometry in siATM-treated fibroblasts. TIG1 fibroblasts were treated as indicated. H2O2 (25 μM, 30 min) was used as a positive control for induction of ROS. ATM inhibitors (Ku-55933 – ATMi #1 and Ku-60019 – ATMi #2, both 10 μM) were provided fresh every 24 h for a total of 72 h (N = 3). (D) Quantification of mitochondrial membrane potential (ΔΨm) in siATM-treated fibroblasts using flow-cytometry. Cells were treated as in panel C. Staurosporine (2 μM, 2 h) was used as a positive control for mitochondrial membrane depolarisation (N = 3). (E) Detection of protein carbonylation in nuclear extracts obtained from fibroblasts depleted of ATM for the indicated time. Carbonylated proteins were detected by derivatisation with dinitrophenylhydrazone (DNP) followed by Western blot using an anti-DNP antibody. Equal amounts of cell extract were loaded in each lane. H2O2 (1 mM, 30 minutes) was used as a positive control for induction of protein carbonylation. (F) Quantification of protein carbonylation in ATM-depleted fibroblasts; the histogram displays densitometric data from the analysis reported in panel E (N = 6). Results are expressed as mean ± SD from the indicated number (N) of independent experiments: *P < 0.05; **P < 0.01; ***P < 0.001; NS: not significant.
Figure 2.
Figure 2.
Fibroblasts lacking ATM show changes in protein biosynthesis. (A) Protein translation assay. TIG1 fibroblasts were transfected with the indicated siRNA and subsequently with an EGFP reporter, as indicated in ‘Materials and Methods’. Translation efficiency was determined by calculating the ratio between the fluorescence of the reporter (bottom panel) and EGFP transcription. ATM-depleted cells show significantly lower translation efficiency than control fibroblasts. Cycloheximide-treated cells (CHX, 25 μg/ml for 24 hours) were used as positive control for translation suppression. Scale bar in the representative micrographs is 100 μm (N = 3). (B) Translation assay carried out as in panel A. Cells were treated with either vehicle (DMSO) or ATM kinase inhibitor (KU-55933, 10 μM for 72 h, fed fresh every 24 h). Scale bar 100 μm (N = 3). (C) Proteomics data showing the fold change in aaRSs expression upon ATM depletion. Red and blue bars show the change in protein expression in the nuclear and cytoplasmic fractions, respectively. Data are expressed as the average fold change calculated between two technical replicates. The dashed line represents the normalised expression level in cells transfected with the control siRNA. ¥: statistically significant hits (Z-score > 2). (D) Validation of the SILAC data using Western blot. The expression level of CARS was measured 72 h after transfection with different ATM-targeting siRNAs. Densitometric quantification of CARS is reported at the bottom (N = 2). (E) Immunofluorescence analysis on TIG1 fibroblasts treated with the indicated siRNA. Aggresome formation was detected as described in ‘Materials and Methods’. MG132 (5 μM for 16 h) was used as positive control for induction of protein aggregates. Nuclei were stained with Hoechst. Scale bars 50 μm. Results are expressed as mean ± SD from the indicated number (N) of independent experiments: *P < 0.05; ***P < 0.001.
Figure 3.
Figure 3.
Accumulation of nuclear proteasome and degradation of histones in ATM-depleted fibroblasts. (A) Proteomics data showing the fold change of proteasome subunit levels in fibroblasts depleted of ATM. Red and blue bars show the change in protein expression in the nuclear and cytoplasmic compartments, respectively. Data shown are expressed as the average fold change calculated between two technical replicates. The dashed line represents the normalised protein expression level in cell transfected with the control siRNA. ¥: statistically significant hits (Z-score > 2). (B) Validation of the SILAC data using Western blot. Levels of the indicated proteasome subunits were analysed in cytoplasmic and nuclear fractions after ATM depletion for 72 h using the indicated siRNA. Hsp90 and Ku80 were used as loading controls for the cytoplasmic and nuclear compartment, respectively. Densitometric quantification of the indicated proteins is reported at the bottom (N = 2). (C) Validation of the SILAC data by immunofluorescence. Localisation and expression levels of PSMD13 were analysed upon ATM depletion for 72 h using the indicated siRNA. Scale bars 50 μm. (D) Proteomics data showing the decrease in histone protein levels upon ATM depletion. The histogram shows the change in protein expression in the nuclear fraction. Data shown are expressed as the average fold change calculated between two technical replicates. The dashed line represents the normalised histone expression level in cells transfected with the control siRNA. ¥: statistically significant hits (Z-score < 2). (E) Representative Western blot analysis validating the results presented in panel A and showing a decreased amount of histones upon ATM depletion. TIG1 fibroblasts were treated with the indicated siRNA and acid-extracted protein fractions were analysed 72 h post transfection. A Coomassie-stained gel is used to show equal loading. Densitometric quantification of the indicated proteins is reported at the bottom (N = 2). Results are expressed as mean from the indicated number (N) of independent experiments.
Figure 4.
Figure 4.
Proteasome activity is required for survival of ATM-depleted fibroblasts. (A) Chymotrypsin-like proteasomal activity measured in either cytoplasmic or nuclear cell extracts from TIG1 cells. Protein extraction was carried out 72 hours after transfection with the indicated siRNA (N = 3). (B) Representative Western blot showing accumulation of carbonylated proteins in the nuclear compartment of fibroblasts depleted of ATM, upon inhibition of proteasomal activity. MG132 treatment (10 μM, 6 h) was carried out 72 h after siRNA transfection. Equal amounts of cell extract were loaded in each lane. (C) Densitometric quantification of protein carbonylation in the experiment showed in panel B (N = 8). (D) Viability assay showing fibroblast sensitivity to proteasome inhibition. TIG1 fibroblasts were transfected with the indicated siRNA; 48 hours after transfection cells were incubated with MG132 (500 nM) for further 24 h. Cell viability was measured using a Trypan Blue exclusion assay (N = 4). (E) Representative FACS profiles of cells stained with Annexin V and propidium iodide (PI). Cells were treated as in panel D before staining. (F) Percentage of apoptotic cells obtained from FACS analysis of cells treated as in panel E (N = 3). Results are expressed as mean ± SD from the indicated number (N) of independent experiments: *P < 0.05; **P < 0.01.
Figure 5.
Figure 5.
Reduced BER capacity in ATM-depleted fibroblasts. (A) Representative Western blot comparing BER protein levels in whole cell extracts from TIG1 cells. Protein extraction was carried out 72 h after transfection with the indicated siRNA. Fold change in protein expression relative to the control sample (siCtrl) is indicated at the bottom of the blot. Actin was used as loading control (N = 4). (B) Representative Western blot comparing BER protein levels in whole cell extracts from TIG1 cells depleted of ATM in the presence of proteasome inhibitor. MG132 treatment (10 μM, 6 h) was carried out before cell harvesting, 72 h after transfection with the indicated siRNA. Fold change in protein expression relative to the control sample is indicated at the bottom of the blot. Tubulin was used as loading control (N = 3). (C) AP site incision assay showing impaired endonuclease activity at abasic sites in cells treated with the indicated siRNA. The assay was carried out as described in ‘Materials and Methods’ using whole cell extracts obtained from cells treated as indicated (N = 3). (D) Nick ligation assay showing impaired SSB ligation activity in ATM-depleted cells. The assay was carried out as described in ‘Materials and Methods’ using nuclear cell extracts obtained from cells treated with the indicated siRNA (N = 3). (E) Alkaline comet assay showing slower DNA repair kinetics for ATM-depleted cells. TIG1 fibroblasts were transfected with the indicated siRNA; 72 h after transfection cells were treated with H2O2 (30 μM, 10 min) and allowed to repair for the indicated amount of time. DNA repair is expressed as fraction of residual DNA damage after H2O2 treatment (N = 3). (F) Alkaline comet assay showing slower DNA repair kinetics in ATM-depleted cells. TIG1 fibroblasts were treated as in panel E using MMS (1 mM, 10 min) and allowed to repair for the indicated amount of time. DNA repair is expressed as fraction of residual DNA damage after MMS treatment (N = 3). Results are expressed as mean ± SD from the indicated number (N) of independent experiments: *P < 0.05; **P < 0.01.
Figure 6.
Figure 6.
Spontaneous accumulation of DNA strand breaks in ATM-deficient cells. (A) Alkaline comet assay on TIG1 cells depleted of ATM for the indicated amount of time. The amount of DNA damage, expressed as percentage of DNA in the comet tails, increases in a time-dependent manner (N = 3). (B) Neutral comet assay on TIG1 cells treated as in panel A. The amount of DNA damage, expressed as percentage of DNA in the comet tails, increases in a time-dependent manner (N = 3). Results are expressed as mean ± SD from the indicated number (N) of independent experiments: *P < 0.05; **P < 0.01.

Similar articles

Cited by

References

    1. Lavin M.F., Gueven N., Bottle S., Gatti R.A.. Current and potential therapeutic strategies for the treatment of ataxia-telangiectasia. Br. Med. Bull. 2007; 81–82:129–147. - PubMed
    1. Savitsky K., Bar-Shira A., Gilad S., Rotman G., Ziv Y., Vanagaite L., Tagle D.A., Smith S., Uziel T., Sfez S. et al. . A single ataxia telangiectasia gene with a product similar to PI-3 kinase. Science. 1995; 268:1749–1753. - PubMed
    1. Gatti R.A., Berkel I., Boder E., Braedt G., Charmley P., Concannon P., Ersoy F., Foroud T., Jaspers N.G., Lange K. et al. . Localization of an ataxia-telangiectasia gene to chromosome 11q22-23. Nature. 1988; 336:577–580. - PubMed
    1. Paull T.T. Mechanisms of ATM Activation. Annu. Rev. Biochem. 2015; 84:711–738. - PubMed
    1. Bakkenist C.J., Kastan M.B.. DNA damage activates ATM through intermolecular autophosphorylation and dimer dissociation. Nature. 2003; 421:499–506. - PubMed

MeSH terms