

Supplemental Nutrition Assistance Program (SNAP) Participation and Health Care Expenditures Among Low-Income Adults
- PMID: 28973507
- PMCID: PMC5710268
- DOI: 10.1001/jamainternmed.2017.4841
Supplemental Nutrition Assistance Program (SNAP) Participation and Health Care Expenditures Among Low-Income Adults
Abstract
Importance: Food insecurity is associated with high health care expenditures, but the effectiveness of food insecurity interventions on health care costs is unknown.
Objective: To determine whether the Supplemental Nutrition Assistance Program (SNAP), which addresses food insecurity, can reduce health care expenditures.
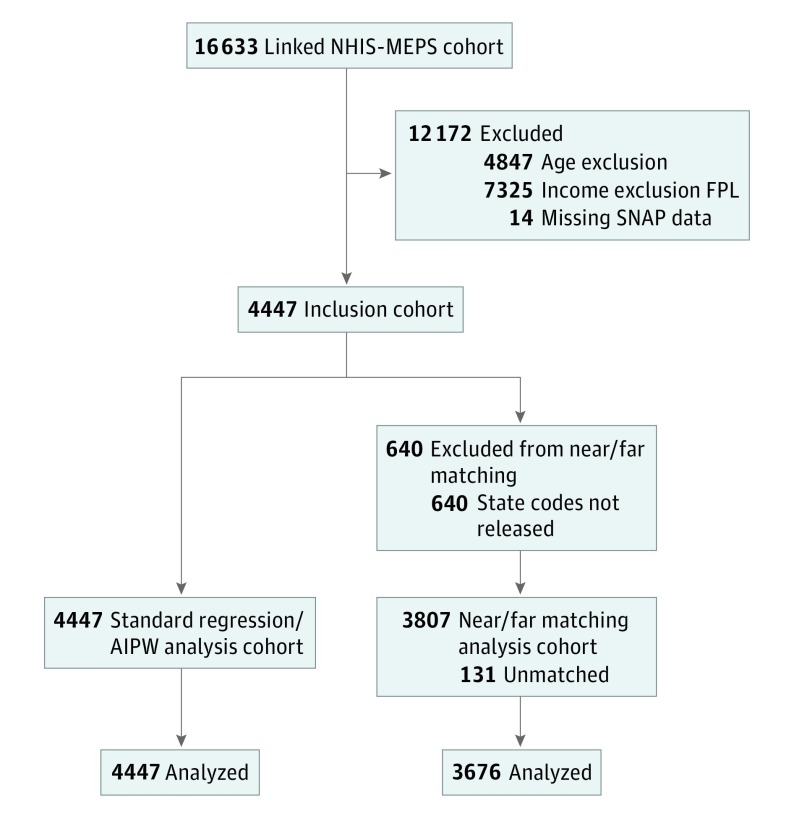
Design, setting, and participants: This is a retrospective cohort study of 4447 noninstitutionalized adults with income below 200% of the federal poverty threshold who participated in the 2011 National Health Interview Survey (NHIS) and the 2012-2013 Medical Expenditure Panel Survey (MEPS).
Exposures: Self-reported SNAP participation in 2011.
Main outcomes and measures: Total health care expenditures (all paid claims and out-of-pocket costs) in the 2012-2013 period. To test whether SNAP participation was associated with lower subsequent health care expenditures, we used generalized linear modeling (gamma distribution, log link, with survey design information), adjusting for demographics (age, gender, race/ethnicity), socioeconomic factors (income, education, Social Security Disability Insurance disability, urban/rural), census region, health insurance, and self-reported medical conditions. We also conducted sensitivity analyses as a robustness check for these modeling assumptions.
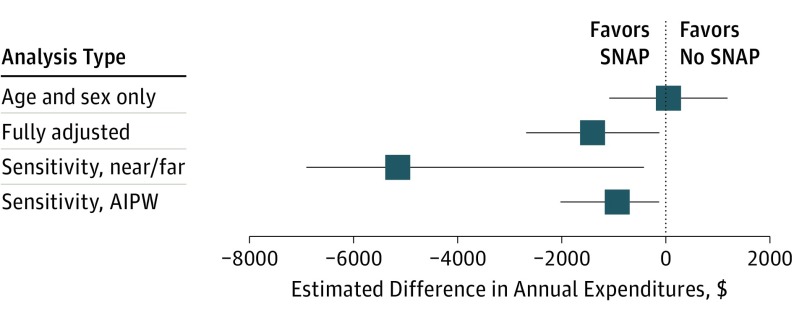
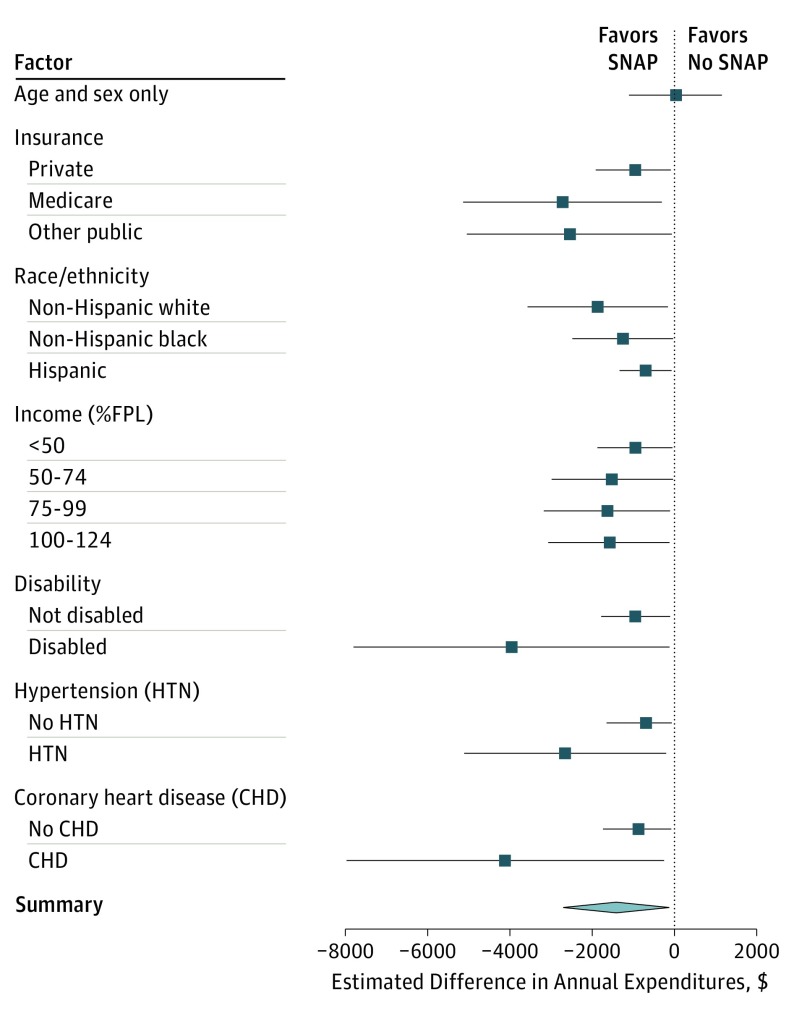
Results: A total of 4447 participants (2567 women and 1880 men) were enrolled in the study, mean (SE) age, 42.7 (0.5) years; 1889 were SNAP participants, and 2558 were not. Compared with other low-income adults, SNAP participants were younger (mean [SE] age, 40.3 [0.6] vs 44.1 [0.7] years), more likely to have public insurance or be uninsured (84.9% vs 67.7%), and more likely to be disabled (24.2% vs 10.6%) (P < .001 for all). In age- and gender-adjusted models, health care expenditures between those who did and did not participate in SNAP were similar (difference, $34; 95% CI, -$1097 to $1165). In fully adjusted models, SNAP was associated with lower estimated annual health care expenditures (-$1409; 95% CI, -$2694 to -$125). Sensitivity analyses were consistent with these results, also indicating that SNAP participation was associated with significantly lower estimated expenditures.
Conclusions and relevance: SNAP enrollment is associated with reduced health care spending among low-income American adults, a finding consistent across several analytic approaches. Encouraging SNAP enrollment among eligible adults may help reduce health care costs in the United States.
Conflict of interest statement
Figures
Similar articles
-
Association of Grocery Expenditure Relative to Thrifty Food Plan Cost with Diet Quality of Women Participating in the Supplemental Nutrition Assistance Program.J Acad Nutr Diet. 2018 Dec;118(12):2315-2323. doi: 10.1016/j.jand.2018.07.015. Epub 2018 Sep 28. J Acad Nutr Diet. 2018. PMID: 30270030
-
Trends and Disparities in Diet Quality Among US Adults by Supplemental Nutrition Assistance Program Participation Status.JAMA Netw Open. 2018 Jun;1(2):e180237. doi: 10.1001/jamanetworkopen.2018.0237. JAMA Netw Open. 2018. PMID: 30498812 Free PMC article.
-
Association Between Supplemental Nutrition Assistance Program Participation and Cost-Related Medication Nonadherence Among Older Adults With Diabetes.JAMA Intern Med. 2019 Jan 1;179(1):63-70. doi: 10.1001/jamainternmed.2018.5011. JAMA Intern Med. 2019. PMID: 30453334 Free PMC article.
-
Interventions to address household food insecurity in high-income countries.Proc Nutr Soc. 2018 Aug;77(3):270-281. doi: 10.1017/S002966511800006X. Epub 2018 Mar 27. Proc Nutr Soc. 2018. PMID: 29580316 Review.
-
Strengthening the Public Health Impacts of the Supplemental Nutrition Assistance Program Through Policy.Annu Rev Public Health. 2020 Apr 2;41:453-480. doi: 10.1146/annurev-publhealth-040119-094143. Annu Rev Public Health. 2020. PMID: 32237988 Review.
Cited by
-
Recommendations From SNAP Participants to Improve Wages and End Stigma.Am J Public Health. 2019 Dec;109(12):1664-1667. doi: 10.2105/AJPH.2019.305362. Epub 2019 Oct 17. Am J Public Health. 2019. PMID: 31622134 Free PMC article.
-
Dose response relationship between food insecurity and quality of life in United States adults: 2016-2017.Health Qual Life Outcomes. 2023 Mar 8;21(1):21. doi: 10.1186/s12955-023-02103-3. Health Qual Life Outcomes. 2023. PMID: 36890499 Free PMC article.
-
Association Between Receipt of a Medically Tailored Meal Program and Health Care Use.JAMA Intern Med. 2019 Jun 1;179(6):786-793. doi: 10.1001/jamainternmed.2019.0198. JAMA Intern Med. 2019. PMID: 31009050 Free PMC article.
-
Philadelphia's Excise Tax on Sugar-Sweetened and Artificially Sweetened Beverages and Supplemental Nutrition Assistance Program Benefit Redemption.Am J Public Health. 2021 Nov;111(11):1986-1996. doi: 10.2105/AJPH.2021.306464. Epub 2021 Oct 22. Am J Public Health. 2021. PMID: 34678053 Free PMC article.
-
Addressing Social Needs in Health Care Settings: Evidence, Challenges, and Opportunities for Public Health.Annu Rev Public Health. 2021 Apr 1;42:329-344. doi: 10.1146/annurev-publhealth-090419-102204. Epub 2021 Dec 16. Annu Rev Public Health. 2021. PMID: 33326298 Free PMC article. Review.
References
-
- Agency for Healthcare Research and Quality 2014 National Healthcare Quality & Disparities Report. 2015. https://www.ahrq.gov/research/findings/nhqrdr/nhqdr14/index.html. Accessed January 6, 2017.
-
- Blumenthal D, Chernof B, Fulmer T, Lumpkin J, Selberg J. Caring for high-need, high-cost patients: an urgent priority. N Engl J Med. 2016;375(10):909-911. - PubMed
Publication types
MeSH terms
Grants and funding
LinkOut - more resources
Full Text Sources
Other Literature Sources
