. 2018 Jan 1;67(1):1-13.
doi: 10.1093/sysbio/syx064.

Genomic Signature of an Avian Lilliput Effect across the K-Pg Extinction

Affiliations

Genomic Signature of an Avian Lilliput Effect across the K-Pg Extinction

Jacob S Berv et al. Syst Biol. .

Abstract

Survivorship following major mass extinctions may be associated with a decrease in body size-a phenomenon called the Lilliput Effect. Body size is a strong predictor of many life history traits (LHTs), and is known to influence demography and intrinsic biological processes. Pronounced changes in organismal size throughout Earth history are therefore likely to be associated with concomitant genome-wide changes in evolutionary rates. Here, we report pronounced heterogeneity in rates of molecular evolution (varying up to $\sim$20-fold) across a large-scale avian phylogenomic data set and show that nucleotide substitution rates are strongly correlated with body size and metabolic rate. We also identify potential body size reductions associated with the Cretaceous-Paleogene (K-Pg) transition, consistent with a Lilliput Effect in the wake of that mass extinction event. We posit that selection for reduced body size across the K-Pg extinction horizon may have resulted in transient increases in substitution rate along the deepest branches of the extant avian tree of life. This "hidden" rate acceleration may result in both strict and relaxed molecular clocks over-estimating the age of the avian crown group through the relationship between life history and demographic parameters that scale with molecular substitution rate. If reductions in body size (and/or selection for related demographic parameters like short generation times) are a common property of lineages surviving mass extinctions, this phenomenon may help resolve persistent divergence time debates across the tree of life. Furthermore, our results suggest that selection for certain LHTs may be associated with deterministic molecular evolutionary outcomes.

Keywords: Birds; K-Pg; body size; divergence times; life history evolution; mass extinction; metabolic rate; molecular clocks.


Figures

Figure 1
Figure 1
Avian body size evolution in association with the K-Pg boundary. a): Ancestral state reconstructions of body size for the three most inclusive nodes within crown birds, compared to the body size distribution of a fossil avifauna from the latest Maastrichtian (LM assemblage; Longrich et al. 2011). For the LM assemblage, a sample of outliers are indicated from a simulated normal distribution, while large black dots indicate mass point estimates for fossil taxa (Supplemental Fig. S4 available on Dryad). Dashed horizontal lines (black) within boxplots to the right of the LM assemblage indicate median posterior estimates from reconstructions excluding fossil body size priors; these are slightly larger than those from analyses directly incorporating fossils (using 95% upper bound priors; posterior distributions summarized by colored boxplots), suggesting that including fossil information increases the magnitude of inferred changes between the center of the LM assemblage and the reconstructions for early neornithine nodes. Median size estimates using 95% lower bound priors indicated by diamonds. Crossed circles indicate median size estimates conditioned on the correlation between rates of molecular evolution and body size, as inferred in Coevol 1.4b (Lartillot and Poujol 2011). The red horizontal line that passes through panels a–c) indicates the median value of the LM assemblage (formula image1 kg), and the dark grey horizontal line that passes through panels a–c) indicates the median mass of extant taxa in this data set (formula image150 g, somewhat larger than the median mass of extant Neornithes, formula image37 g). The depicted progression of body size reduction represents an improvement of up to 36 AICM units relative to a model that constrains the three deepest nodes to the mean LM estimate (formula imageAICMformula image36). formula imageAICMformula image26: an alternative model that enforces the Neornithes constraint. Boxplot colors match curves in panel b). b): Reconstructed body size changes in close association with the K-Pg boundary (Cenozoic indicated in pale yellow). On the left, the red curve indicates a normal distribution fit to the body size distribution of the LM assemblage. Blue, orange, and purple curves trace the posterior distributions estimated for body size of the three most inclusive nodes in the crown avian phylogeny (matched to their respective nodes with colored circles). Right side of panel b): zoomed-in “phenogram” of body size evolution (to compare with the full range of phenotype evolution displayed in panel c)). Pale blue dots indicate Cenozoic nodes calibrated by body size priors in this study.
Figure 2
Figure 2
Model of the inferred correlation structure among life history traits and overall rate of nucleotide substitution (from Coevol 1.4b, Lartillot and Delsuc 2012). Body mass and metabolic rate remain statistically significant in partial correlations. Each link represents a test of a statistical association between a life history parameter and overall nuclear substitution rate (following Lanfear et al. 2013a). Solid arrows indicate that the relationships are statistically significant (posterior probability formula image [positive relationship] or formula image [negative relationship]) in pairwise comparisons, while dashed arrows indicate nonsignificance. Solid borders indicate a significant relationship in a partial correlation (controlling for all other covariates) while dashed borders indicate nonsignificance. The colors range from red to blue, and are scaled by the magnitude of the inferred partial correlation coefficient, formula image (red formula image negative, blue formula image positive). Correlation coefficients and associated posterior probability are reported in Supplementary Table S2 available on Dryad.
Figure 3
Figure 3
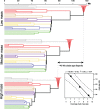
Simulations illustrating the influence of body size bias on molecular divergence time estimates. Strict molecular clock analyses of low mass, median mass, and high mass taxon samples for crown birds reveal that approximately formula image40 Ma of root age disparity can be explained by differences in substitution rate related to body mass alone (relaxed clock analyses described in the text generated similar results). These analyses imply that extinction of large-bodied taxa can contribute to error in estimates of divergence times by biasing the distribution of substitution rates represented by surviving lineages. The “low mass” taxon partition yields a median root age of 115.7 Ma, while “median” and “heavy” partitions yield estimates of 94.8 Ma and 78.3 Ma, respectively, with narrow, nonoverlapping HPD intervals. Regression analysis (inset) reveals that the relationship may be explained by a simple linear function (formula image, formula image, formula image). The fitted regression line through estimates of the clade MRCA uses the mean clade mass per simulation as a predictor. Also shown are 90% confidence and prediction (dashed lines) intervals. Shading reflects the major clades identified in Prum et al. 2015.

References

    1. Alroy J. 1999. The Fossil Record of North American Mammals: evidence for a Paleocene evolutionary radiation. Syst. Biol. 48:107–118. - PubMed
    1. Alvarez L.W.,, Alvarez W.,, Asaro F.,, Michel H.V. 1980. Extraterrestrial Cause for the Cretaceous-Tertiary Extinction. Science, 208:1095–1108. - PubMed
    1. Archibald J.D. 1996. Dinosaur extinction and the end of an era: what the fossils say. New York: Columbia University Press.
    1. Baker A.J.,, Pereira S.L.,, Paton T.A. 2007. Phylogenetic relationships and divergence times of Charadriiformes genera: multigene evidence for the Cretaceous origin of at least 14 clades of shorebirds. Biol. Lett. 3:205–210. - PMC - PubMed
    1. Barnosky A.D.,, Matzke N.,, Tomiya S.,, Wogan G.O.U.,, Swartz B.,, Quental T.B.,, Marshall C.,, McGuire J.L.,, Lindsey E.L.,, Maguire K.C.,, Mersey B.,, Ferrer E.A. 2011. Has the Earth’s sixth mass extinction already arrived? Nature 471:51–57. - PubMed

Publication types