. 2017 Sep 26;318(12):1136-1149.
doi: 10.1001/jama.2017.11747.

Trends and Patterns of Differences in Chronic Respiratory Disease Mortality Among US Counties, 1980-2014

Affiliations

Trends and Patterns of Differences in Chronic Respiratory Disease Mortality Among US Counties, 1980-2014

Laura Dwyer-Lindgren et al. JAMA. .

Abstract

Importance: Chronic respiratory diseases are an important cause of death and disability in the United States.

Objective: To estimate age-standardized mortality rates by county from chronic respiratory diseases.

Design, setting, and participants: Validated small area estimation models were applied to deidentified death records from the National Center for Health Statistics and population counts from the US Census Bureau, National Center for Health Statistics, and Human Mortality Database to estimate county-level mortality rates from 1980 to 2014 for chronic respiratory diseases.

Exposure: County of residence.

Main outcomes and measures: Age-standardized mortality rates by county, year, sex, and cause.

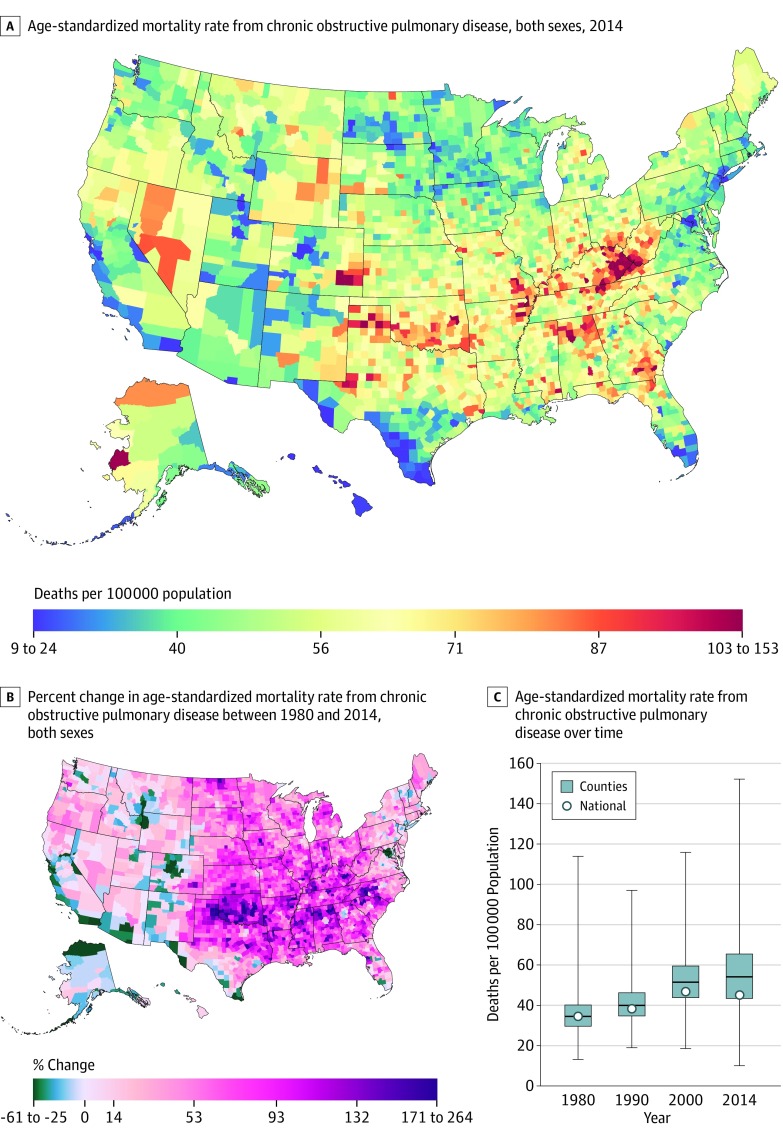
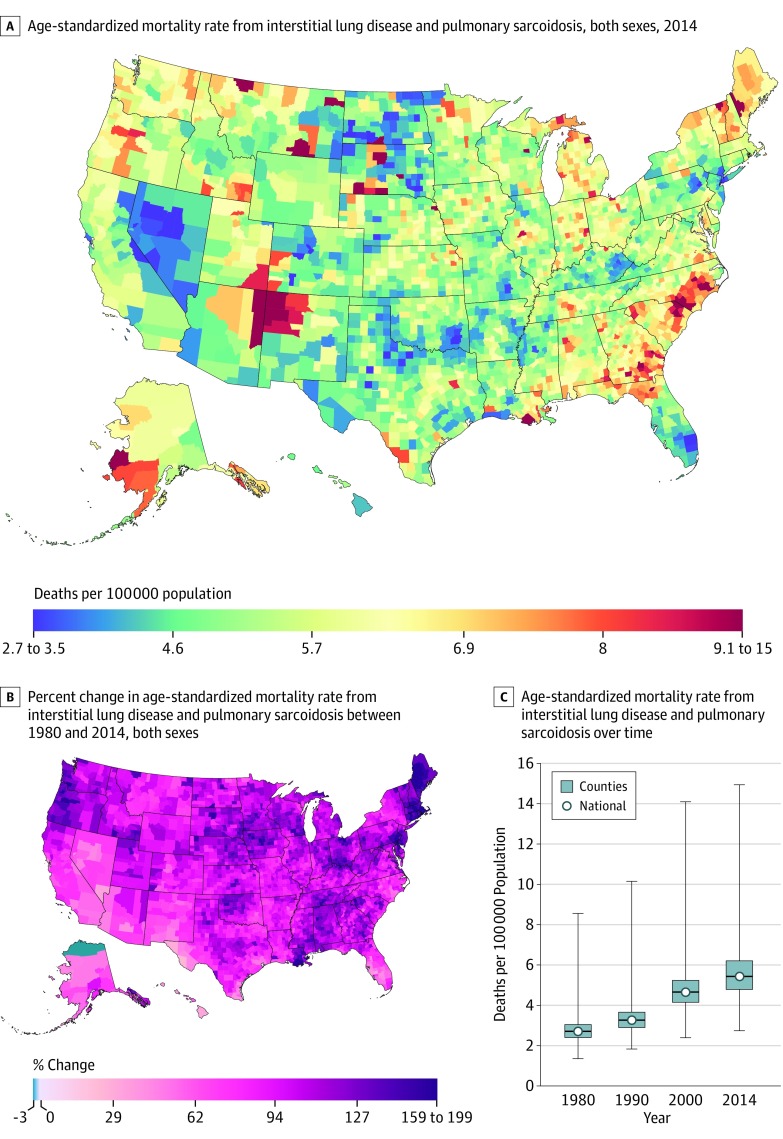
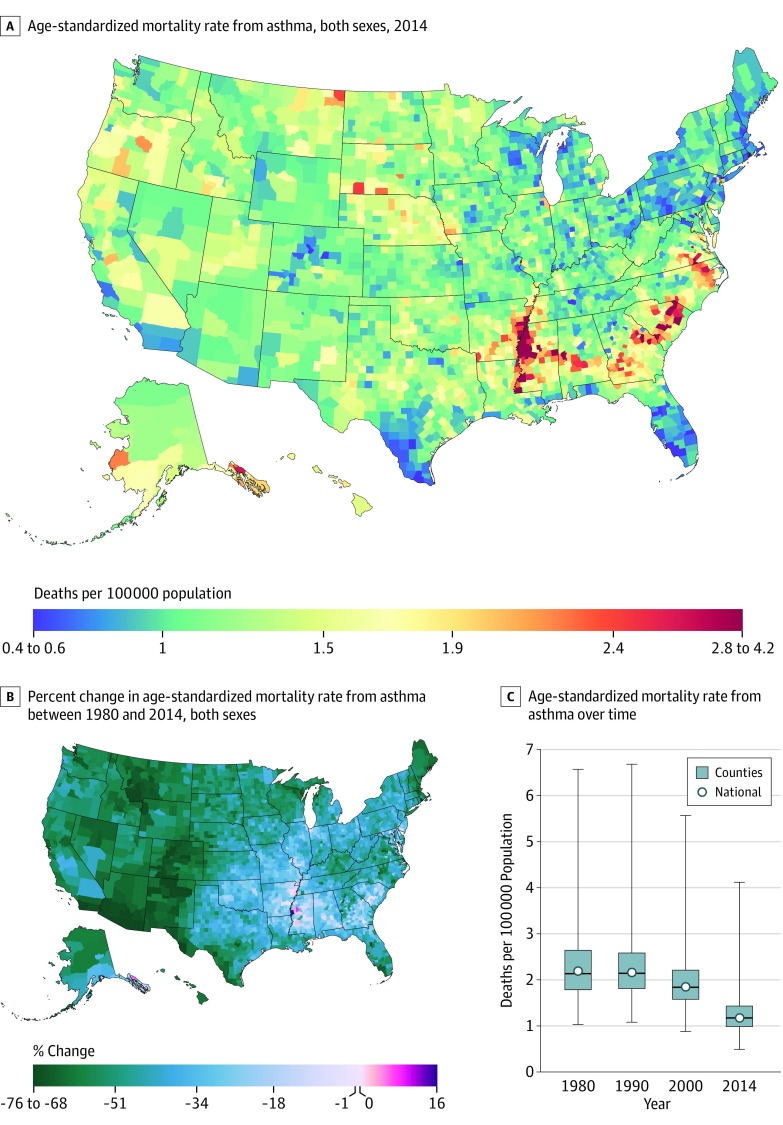
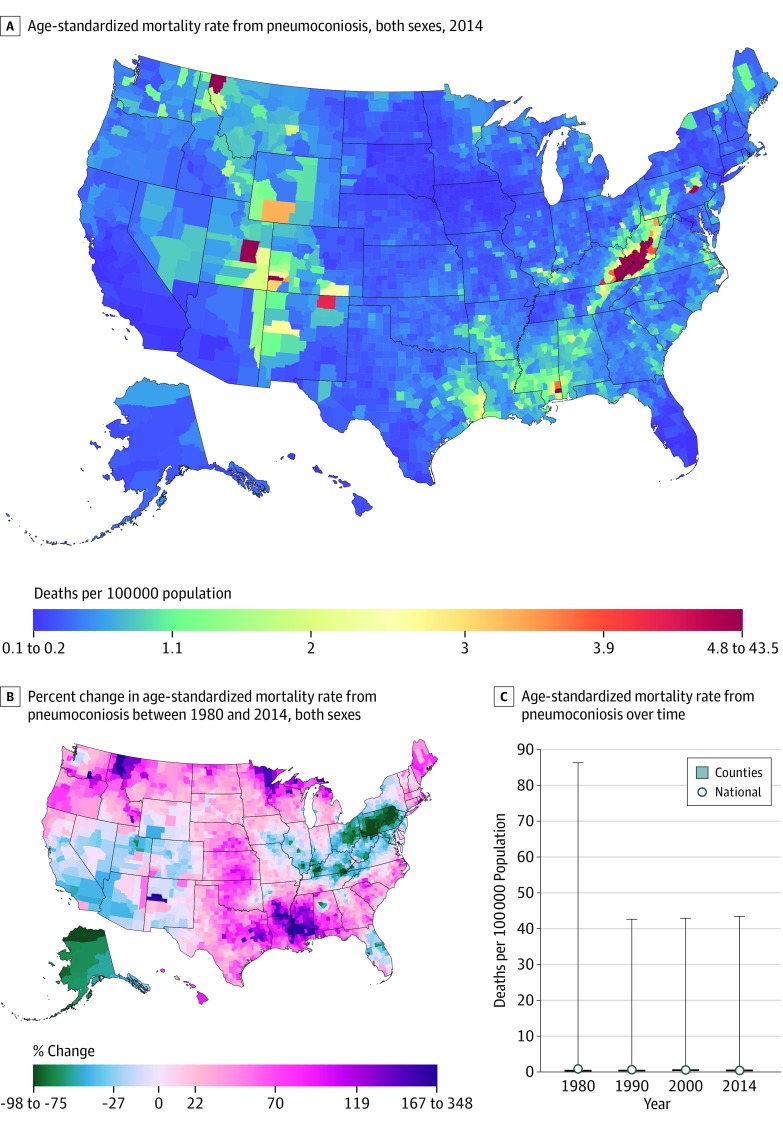
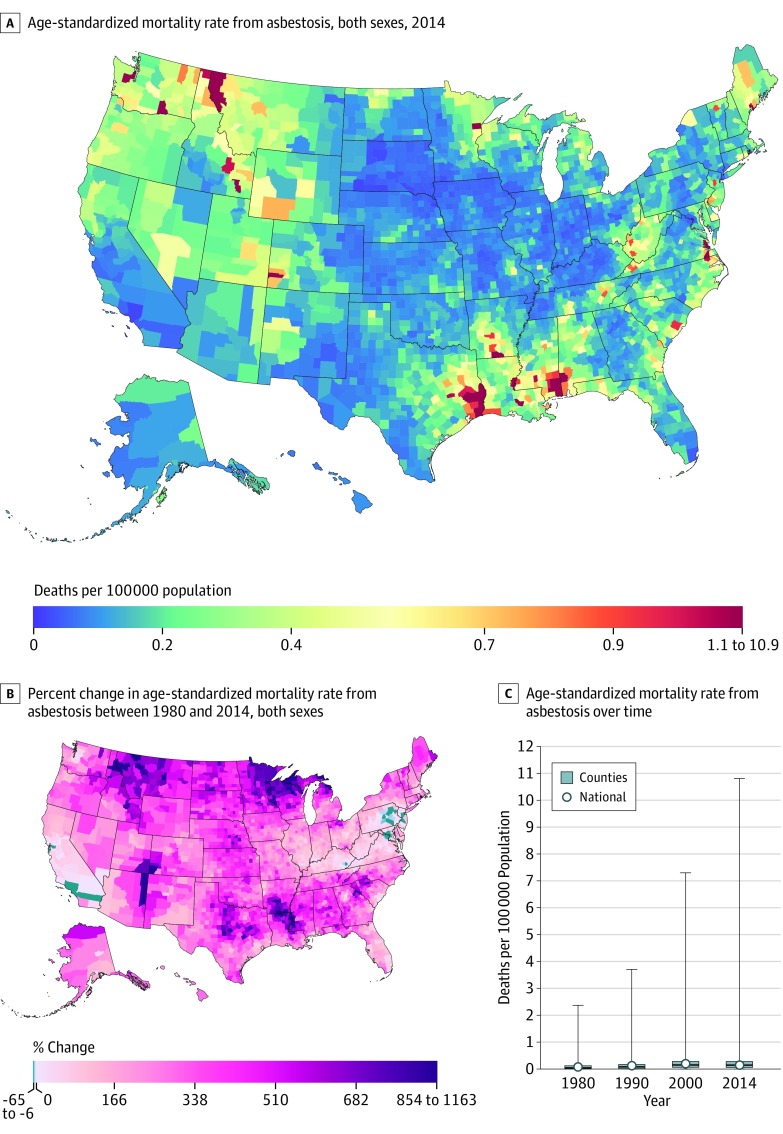
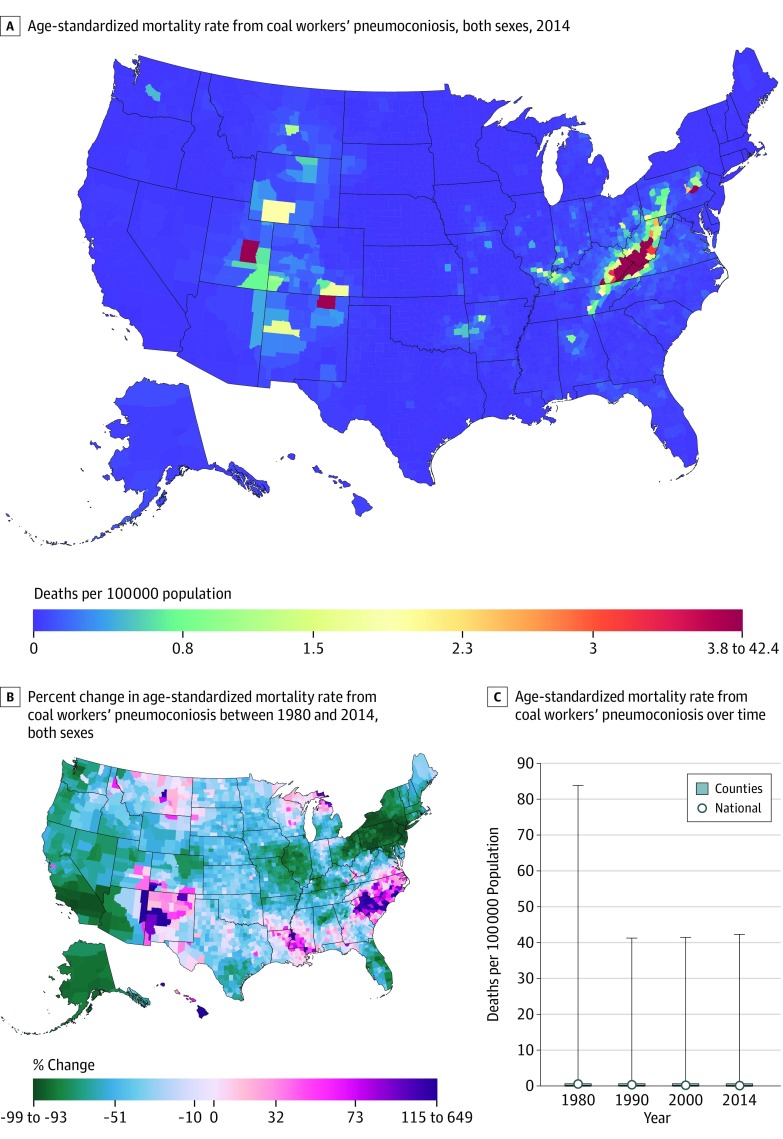
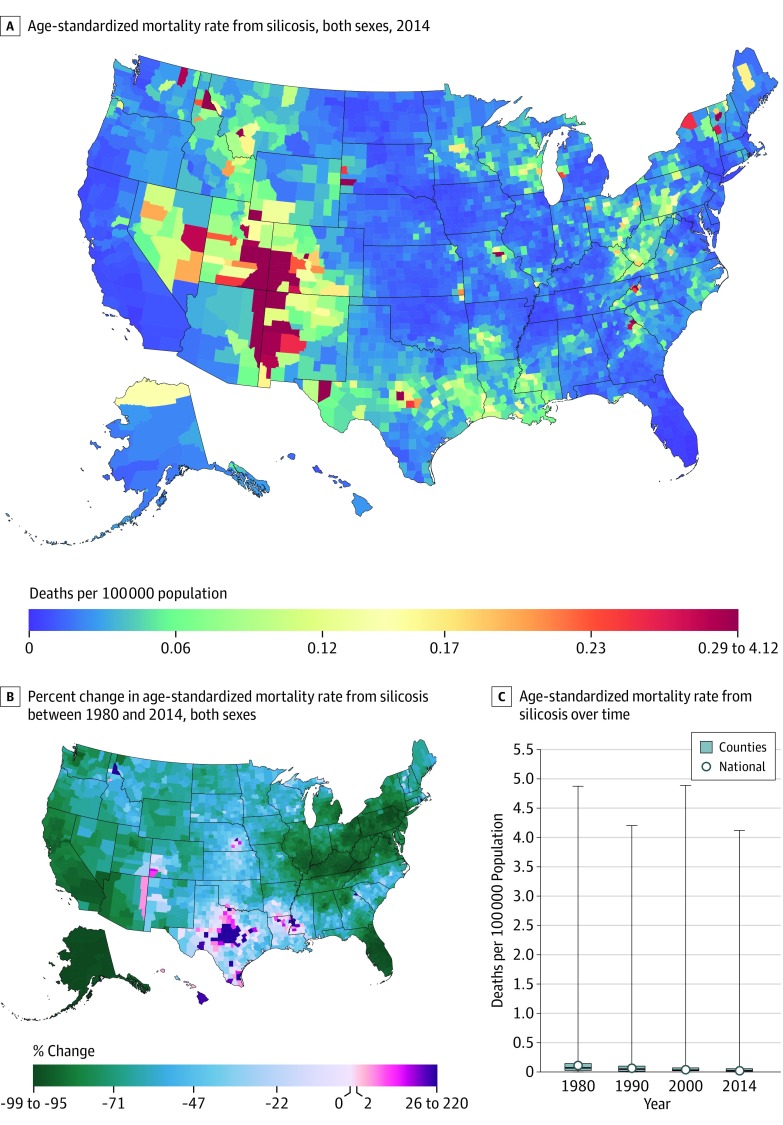
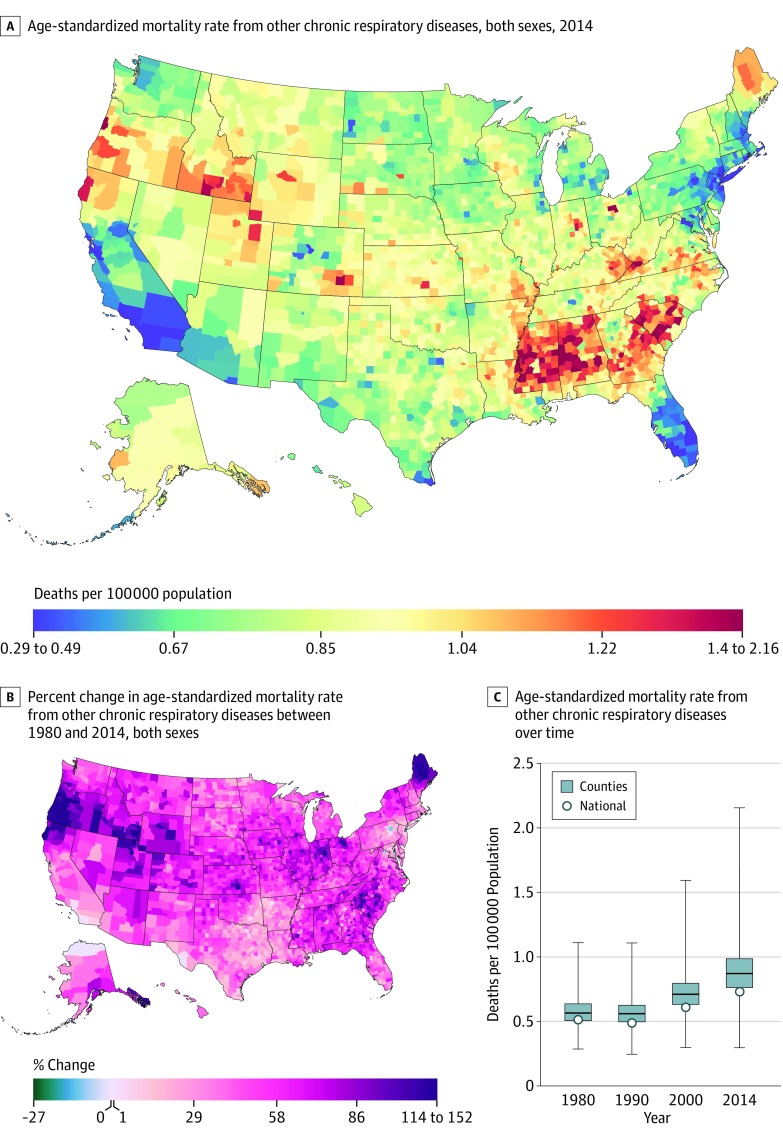
Results: A total of 4 616 711 deaths due to chronic respiratory diseases were recorded in the United States from January 1, 1980, through December 31, 2014. Nationally, the mortality rate from chronic respiratory diseases increased from 40.8 (95% uncertainty interval [UI], 39.8-41.8) deaths per 100 000 population in 1980 to a peak of 55.4 (95% UI, 54.1-56.5) deaths per 100 000 population in 2002 and then declined to 52.9 (95% UI, 51.6-54.4) deaths per 100 000 population in 2014. This overall 29.7% (95% UI, 25.5%-33.8%) increase in chronic respiratory disease mortality from 1980 to 2014 reflected increases in the mortality rate from chronic obstructive pulmonary disease (by 30.8% [95% UI, 25.2%-39.0%], from 34.5 [95% UI, 33.0-35.5] to 45.1 [95% UI, 43.7-46.9] deaths per 100 000 population), interstitial lung disease and pulmonary sarcoidosis (by 100.5% [95% UI, 5.8%-155.2%], from 2.7 [95% UI, 2.3-4.2] to 5.5 [95% UI, 3.5-6.1] deaths per 100 000 population), and all other chronic respiratory diseases (by 42.3% [95% UI, 32.4%-63.8%], from 0.51 [95% UI, 0.48-0.54] to 0.73 [95% UI, 0.69-0.78] deaths per 100 000 population). There were substantial differences in mortality rates and changes in mortality rates over time among counties, and geographic patterns differed by cause. Counties with the highest mortality rates were found primarily in central Appalachia for chronic obstructive pulmonary disease and pneumoconiosis; widely dispersed throughout the Southwest, northern Great Plains, New England, and South Atlantic for interstitial lung disease; along the southern half of the Mississippi River and in Georgia and South Carolina for asthma; and in southern states from Mississippi to South Carolina for other chronic respiratory diseases.

Conclusions and relevance: Despite recent declines in mortality from chronic respiratory diseases, mortality rates in 2014 remained significantly higher than in 1980. Between 1980 and 2014, there were important differences in mortality rates and changes in mortality by county, sex, and particular chronic respiratory disease type. These estimates may be helpful for informing efforts to improve prevention, diagnosis, and treatment.


Conflict of interest statement

Conflict of Interest Disclosures: All authors have completed and submitted the ICMJE Form for Disclosure of Potential Conflicts of Interest and none were reported.

Figures

Figure 1.
Figure 1.. County-Level Mortality From Chronic Obstructive Pulmonary Disease
A, Age-standardized mortality rate for both sexes combined in 2014. B, Relative change in the age-standardized mortality rate for both sexes combined between 1980 and 2014. A and B, The color scale is truncated at approximately the first and 99th percentiles as indicated by the range given in the color scale. C, Age-standardized mortality rate in 1980, 1990, 2000, and 2014. The bottom border, middle line, and top border of the boxes indicate the 25th, 50th, and 75th percentiles, respectively, across all counties; whiskers, the full range across counties; and circles, the national-level rate.
Figure 2.
Figure 2.. County-Level Mortality From Interstitial Lung Disease and Pulmonary Sarcoidosis
A, Age-standardized mortality rate for both sexes combined in 2014. The color scale is truncated at approximately the first and 99th percentiles as indicated by the range given in the color scale. B, Relative change in the age-standardized mortality rate for both sexes combined between 1980 and 2014. The color scale is truncated at approximately the 99th percentile but not at the first percentile, to avoid combining counties where the mortality rate increased with counties where the mortality rate decreased in the same group. C, Age-standardized mortality rate in 1980, 1990, 2000, and 2014. The bottom border, middle line, and top border of the boxes indicate the 25th, 50th, and 75th percentiles, respectively, across all counties; whiskers, the full range across counties; and circles, the national-level rate.
Figure 3.
Figure 3.. County-Level Mortality From Asthma
A, Age-standardized mortality rate for both sexes combined in 2014. The color scale is truncated at approximately the first and 99th percentiles as indicated by the range given in the color scale. B, Relative change in the age-standardized mortality rate for both sexes combined between 1980 and 2014. The color scale is truncated at approximately the first percentile but not at the 99th percentile, to avoid combining counties where the mortality rate increased with counties where the mortality rate decreased in the same group. C, Age-standardized mortality rate in 1980, 1990, 2000, and 2014. The bottom border, middle line, and top border of the boxes indicate the 25th, 50th, and 75th percentiles, respectively, across all counties; whiskers, the full range across counties; and circles, the national-level rate.
Figure 4.
Figure 4.. County-Level Mortality From Pneumoconiosis
A, Age-standardized mortality rate for both sexes combined in 2014. B, Relative change in the age-standardized mortality rate for both sexes combined between 1980 and 2014. A and B, The color scale is truncated at approximately the first and 99th percentiles as indicated by the range given in the color scale. C, Age-standardized mortality rate in 1980, 1990, 2000, and 2014. The bottom border, middle line, and top border of the boxes indicate the 25th, 50th, and 75th percentiles, respectively, across all counties; whiskers, the full range across counties; and circles, the national-level rate.
Figure 5.
Figure 5.. County-Level Mortality From Asbestosis
A, Age-standardized mortality rate for both sexes combined in 2014. B, Relative change in the age-standardized mortality rate for both sexes combined between 1980 and 2014. A and B, The color scale is truncated at approximately the first and 99th percentiles as indicated by the range given in the color scale. C, Age-standardized mortality rate in 1980, 1990, 2000, and 2014. The bottom border, middle line, and top border of the boxes indicate the 25th, 50th, and 75th percentiles, respectively, across all counties; whiskers, the full range across counties; and circles, the national-level rate.
Figure 6.
Figure 6.. County-Level Mortality From Coal Workers’ Pneumoconiosis
A, Age-standardized mortality rate for both sexes combined in 2014. B, Relative change in the age-standardized mortality rate for both sexes combined between 1980 and 2014. A and B, The color scale is truncated at approximately the first and 99th percentiles as indicated by the range given in the color scale. C, Age-standardized mortality rate in 1980, 1990, 2000, and 2014. The bottom border, middle line, and top border of the boxes indicate the 25th, 50th, and 75th percentiles, respectively, across all counties; whiskers, the full range across counties; and circles, the national-level rate.
Figure 7.
Figure 7.. County-Level Mortality From Silicosis
A, Age-standardized mortality rate for both sexes combined in 2014. B, Relative change in the age-standardized mortality rate for both sexes combined between 1980 and 2014. A and B, The color scale is truncated at approximately the first and 99th percentiles as indicated by the range given in the color scale. C, Age-standardized mortality rate in 1980, 1990, 2000, and 2014. The bottom border, middle line, and top border of the boxes indicate the 25th, 50th, and 75th percentiles, respectively, across all counties; whiskers, the full range across counties; and circles, the national-level rate.
Figure 8.
Figure 8.. County-Level Mortality From Other Chronic Respiratory Diseases
“Other chronic respiratory diseases” is defined as the combination of all chronic respiratory diseases except chronic obstructive pulmonary disease, interstitial lung disease and pulmonary sarcoidosis, asthma, asbestosis, coal workers’ pneumoconiosis, silicosis, and other pneumoconiosis. A, Age-standardized mortality rate for both sexes combined in 2014. The color scale is truncated at approximately the first and 99th percentiles as indicated by the range given in the color scale. B, Relative change in the age-standardized mortality rate for both sexes combined between 1980 and 2014. The color scale is truncated at approximately the 99th percentile but not at the first percentile, to avoid combining counties where the mortality rate increased with counties where the mortality rate decreased in the same group. C, Age-standardized mortality rate in 1980, 1990, 2000, and 2014. The bottom border, middle line, and top border of the boxes indicate the 25th, 50th, and 75th percentiles, respectively, across all counties; whiskers, the full range across counties; and circles, the national-level rate.

Comment in

References

    1. GBD 2015 Mortality and Causes of Death Collaborators Global, regional, and national life expectancy, all-cause mortality, and cause-specific mortality for 249 causes of death, 1980-2015: a systematic analysis for the Global Burden of Disease Study 2015. Lancet. 2016;388(10053):1459-1544. - PMC - PubMed
    1. GBD 2015 DALYs and HALE Collaborators Global, regional, and national disability-adjusted life-years (DALYs) for 315 diseases and injuries and healthy life expectancy (HALE), 1990-2015: a systematic analysis for the Global Burden of Disease Study 2015. Lancet. 2016;388(10053):1603-1658. - PMC - PubMed
    1. Dieleman JL, Baral R, Birger M, et al. . US spending on personal health care and public health, 1996-2013. JAMA. 2016;316(24):2627-2646. - PMC - PubMed
    1. Attfield M, Wood J, Antao V, Pinheiro G; Centers for Disease Control and Prevention . Changing patterns of pneumoconiosis mortality—United States, 1968-2000. MMWR Morb Mortal Wkly Rep. 2004;53(28):627-632. - PubMed
    1. National Asthma Control Program, Centers for Disease Control and Prevention Asthma state profiles. 2011. https://www.cdc.gov/asthma/stateprofiles.htm. Accessed December 15, 2016.

MeSH terms