. 2017 Oct 10;114(41):E8750-E8759.
doi: 10.1073/pnas.1707822114. Epub 2017 Sep 25.

Nucleus accumbens feedforward inhibition circuit promotes cocaine self-administration

Affiliations

Nucleus accumbens feedforward inhibition circuit promotes cocaine self-administration

Jun Yu et al. Proc Natl Acad Sci U S A. .

Abstract

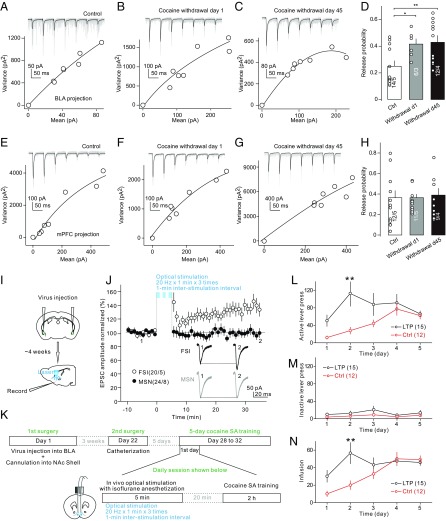
The basolateral amygdala (BLA) sends excitatory projections to the nucleus accumbens (NAc) and regulates motivated behaviors partially by activating NAc medium spiny neurons (MSNs). Here, we characterized a feedforward inhibition circuit, through which BLA-evoked activation of NAc shell (NAcSh) MSNs was fine-tuned by GABAergic monosynaptic innervation from adjacent fast-spiking interneurons (FSIs). Specifically, BLA-to-NAcSh projections predominantly innervated NAcSh FSIs compared with MSNs and triggered action potentials in FSIs preceding BLA-mediated activation of MSNs. Due to these anatomical and temporal properties, activation of the BLA-to-NAcSh projection resulted in a rapid FSI-mediated inhibition of MSNs, timing-contingently dictating BLA-evoked activation of MSNs. Cocaine self-administration selectively and persistently up-regulated the presynaptic release probability of BLA-to-FSI synapses, entailing enhanced FSI-mediated feedforward inhibition of MSNs upon BLA activation. Experimentally enhancing the BLA-to-FSI transmission in vivo expedited the acquisition of cocaine self-administration. These results reveal a previously unidentified role of an FSI-embedded circuit in regulating NAc-based drug seeking and taking.

Keywords: basolateral amygdala; cocaine addiction; fast-spiking interneuron; medium spiny neuron; synaptic plasticity.


Conflict of interest statement

The authors declare no conflict of interest.

Figures

Fig. 1.
Fig. 1.
NAcSh FSIs receive denser excitatory inputs than MSNs. (A and B) Example traces showing distinct membrane properties between NAcSh FSIs (A) and MSNs (B). n > 10 in each case. (CG) Example traces and summarized results showing that compared with NAcSh MSNs, FSIs exhibited higher mEPSC frequencies (in hertz: FSI, 39.8 ± 3.6, n = 8/3; MSN, 9.9 ± 1.0, n = 7/4; P = 0.00, t test), larger mEPSC amplitudes (FSI, 29.7 ± 2.4 pA, n = 8/3; MSN, 19.5 ± 1.0 pA, n = 7/4; P = 0.00, t test), and faster activation (FSI, 0.76 ± 0.02 ms, n = 8/3; MSN, 1.22 ± 0.08 ms, n = 7/4; P = 0.00, t test) and inactivation kinetics of mEPSCs (FSI, 1.20 ± 0.07 ms, n = 8/3; MSN, 2.05 ± 0.22 ms, n = 7/4; P = 0.00, t test). (H) Diagram and image showing pairwise recording of an NAcSh FSI and an MSN in response to optogenetic stimulation of projection-specific excitatory inputs. (Calibration bar, 20 μm.) (I) Example pairwise recording showing that EPSCs were evoked in an FSI and an MSN by the same optogenetic stimulation of the BLA-to-NAc projection. (J) Summarized results showing that EPSCs from BLA-to-FSI synapses exhibited faster rising (FSI, 1.8 ± 0.1 ms; MSN, 3.0 ± 0.2 ms; n = 24/14; P = 0.00, paired t test) and decay kinetics (FSI, 3.1 ± 0.2 ms; MSN, 6.2 ± 0.4 ms; n = 24/14; P = 0.00, paired t test) than BLA-to-MSN synapses. (K) Summarized results showing that the BLA-to-FSI transmission exhibited shorter synaptic delay than BLA-to-MSN transmission (FSI, 1.8 ± 0.1 ms; MSN, 2.1 ± 0.2 ms; n = 24/14; P = 0.03, paired t test). (L) Summarized results of FSI-MSN pairwise recordings showing that BLA-, mPFC-, PVT-, and vHpp-to-NAc projections all evoked EPSCs with larger amplitudes in FSIs than in MSNs. (M) Summarized results showing the ratios of the EPSC amplitudes in MSNs to the EPSC amplitudes in pairwise recorded FSIs (EPSCMSN/EPSCFSI) at synapses from different projections (BLA, 0.55 ± 0.12, n = 28/14; mPFC, 0.43 ± 0.10, n = 34/13; PVT, 0.29 ± 0.06, n = 33/6; vHpp, 0.12 ± 0.06, n = 26/4; F3,117 = 4.389, P = 0.006, one-way ANOVA). *P < 0.05, **P < 0.01.
Fig. 2.
Fig. 2.
FSI-mediated feedforward inhibition of NAcSh MSNs. (A) Diagram showing a pairwise recording of an FSI and an MSN in the NAcSh. (B and C) uIPSPs (B) and the “V-V” curve (C) showing an example paired recording in which stimulation of the FSI evoked monosynaptic uIPSPs in the MSN at different holding potentials, with a reversal potential of ∼−60 mV. (D and E) An example paired recording showing that an action potential in the FSI evoked an uIPSC in the MSN (D), with the time elapsed from the action potential peak to the initiation of uIPSC (t1) of 0.65 ms, and the time from the action potential peak to the uIPSC peak (t2) of 2.25 ms (E). (F) Diagram showing paired recording of an FSI and an MSN in response to optogenetic stimulation of BLA- and mPFC-to-NAc projections. (G) Upon a single optogenetic stimulation of BLA- and mPFC-to-NAc projections, an example pairwise recording showing that action potentials were sequentially evoked in the FSI and MSN with a 2.6-ms delay (t3). (H) Summarized results showing the mean t1, t2, and t3 in pairwise recordings in which FSIs innervated MSNs (t1, 0.6 ± 0.1 ms, n = 17/5; t2, 2.2 ± 0.1 ms, n = 17/5; t3, 2.4 ± 0.5 ms, n = 7/6). The FSI-generated uIPSC in MSNs is inverted to manifest its coincidence with the action potential. (I and J) Example traces (I) and summarized results (J) showing that application of Naspm preferentially inhibits EPSCs in FSIs, with minimal effects on EPSCs in MSNs in naïve mice (percent amplitude in Naspm: FSI, 39.4 ± 7.8, n = 9/7; MSN, 90.0 ± 7.4, n = 25/13; P = 0.00, t test). (K and L) Example traces (K) and summarized results (L) showing that preferentially inhibiting excitatory inputs to FSIs by Naspm decreased and increased the likelihood of optogenetically evoked action potential firing in FSIs and MSNs, respectively (number of action potentials: FSI-aCSF, 5.5 ± 0.3, FSI-Naspm, 1.6 ± 0.6, n = 13/5, P = 0.00, paired t test; MSN-aCSF, 1.4 ± 0.3, MSN-Naspm, 3.2 ± 0.5, n = 17/10, P = 0.00, paired t test). (M) An example pairwise recording using physiologically relevant internal solutions showing that an action potential firing in the FSI evoked a hyperpolarization of the membrane potential of the MSNs, indicating the FSI–MSN connectivity. Note that the amplitude of the hyperpolarization was small when evoked at the resting membrane potential. (N and O) Example recordings of the same pair verified in M showing that an optogenetic stimulation train (2 Hz × 6 with 1-ms stimulation duration) of the BLA- and mPFC-to-NAc projections evoked action potentials only in the FSI (N), but when the FSI was voltage-clamped at −85 mV to prevent action potential firing, the same optogenetic stimulation train evoked action potentials in the MSN (O). (P) Summarized results showing that preventing action potential firing of a single FSI that innervated the MSN effectively increased the likelihood of action potential firing evoked by optogenetic stimulation of BLA- and mPFC-to-NAc projections (number of action potentials: FSI on, 1.0 ± 0.4; FSI off, 3.0 ± 0.43; n = 9/8; P = 0.02, paired t test). *P < 0.05, **P < 0.01.
Fig. S1.
Fig. S1.
Additional information about optogenetically evoked EPSCs, pairwise recording, and sex-based difference. (A and B) EPSCs evoked in an example FSI (A) and MSN (B) by optogenetic stimulations of the mPFC-to-NAc projection with a stimulation duration of 1 ms or 0.2 ms. In our preparations, sharp and clearly defined synaptic responses could be optogenetically evoked using a laser pulse with a duration of up to 1 ms. When the stimulation durations were longer, synaptic responses became more volatile and unstable, often with atypical activation and inactivation kinetics. (C and D) In the FSI–MSN pairwise recordings, we first checked the connectivity of the FSI to MSN by triggering an action potential in the FSI and examined whether it elicited a timing-contingent uIPSC in the MSN. Typically, when the FSI and MSN were connected, a large, clearly defined uIPSC could be detected (C), with the mean amplitude of ∼800 pA (Fig. 3B). Unconnected FSI–MSN pairs were defined by the lack of uIPSCs upon FSI stimulation (D). (E) Summary showing that in our current study ∼50% of the sampled FSI–MSN pairs were functionally connected. (F) Summary showing that the CV of FSI-to-MSN synaptic transmission was not significantly different in male vs. female mice (CV: female, 0.21 ± 0.04, n = 8/3; male, 0.19 ± 0.01, n = 25/9; P = 0.397, t test). (G) Summary showing that in the pairwise recordings upon optogenetic stimulation of the BLA-to-NAc projection the ratio of the amplitudes of BLA-to-MSN EPSCs to the amplitudes of BLA-to-FSI EPSCs was similar between male vs. female mice (EPSCMSN/EPSCFSI: female, 0.59 ± 0.16, n = 13/5; male, 0.56 ± 0.19, n = 15/7; P = 0.95, t test).
Fig. S2.
Fig. S2.
Convergent activation of the BLA- and mPFC-to-NAc projection and the potential nonspecific effects of Naspm. (A and B) Example recordings (A) and summaries (B) showing that optogenetic activation of BLA-to-NAc projection or mPFC-to-NAc projection alone triggered few action potentials in MSNs, while simultaneous activation of both BLA/mPFC-to-NAc projections trigger more action potentials in MSNs. Note that optogenetic stimulations of one projection with stronger, long stimulation durations (e.g., a duration of 4 ms) could trigger more action potentials but these nonphysiological parameters were not adopted in this study. (C) Examples action potentials in the same FSI and MSN before and during perfusion of Naspm. (D) Summary showing that perfusion of Naspm decreased the peak amplitudes of action potentials in both FSIs (in millivolts: aCSF, 18.4 ± 2.4; Naspm, 5.2 ± 4.4, n = 6/3, P = 0.008, paired t test) and MSNs (in millivolts: aCSF, 30.7 ± 2.1; Naspm, 18.4 ± 2.8, n = 8/8, P = 0.00). The mean action potential amplitudes were higher in MSNs than FSIs under the current experimental conditions without (P = 0.00) or with Naspm perfusion (P = 0.01). (E and F) Summaries showing that the Q (in picoamperes: control, 72.0 ± 7.0, n = 17/5; withdrawal d 1, 82.8 ± 11.2, n = 13/6; withdrawal d 45, 66.9 ± 6.1, n = 17/5; E) and N (control, 19.1 ± 2.5, n = 17/5; withdrawal d1, 20.0 ± 3.2, n = 13/6; withdrawal d45, 21.6 ± 3.6, n = 17/5; F) of FSI-to-MSN synapses were not affected after 1 or 45 d withdrawal from self-administration. **P < 0.01.
Fig. 3.
Fig. 3.
Cocaine self-administration does not affect the FSI-to-MSN synaptic connectivity. (A) Diagram and example traces showing the pairwise recording in which uIPSCs were recorded from the MSN in response to the evoked action potential in the FSI. (B and C) Summarized results showing that neither the mean amplitudes (B) nor the CV of uIPSC at FSI-to-MSN synapses (C) were altered after 1 or 45 d withdrawal from cocaine self-administration. (D and E) Example uIPSCs (D) and the variance vs. mean plot of uIPSC amplitudes (E) at FSI-to-MSN synapses. (F) Summarized MPFA results showing that the Pr of FSI-to-MSN synapses was not affected 1 or 45 d after cocaine self-administration (control, 61.8 ± 4.3%, n = 17/5; withdrawal d 1, 59.7 ± 5.5%, n = 13/6; withdrawal d 45, 67.2 ± 4.0%, n = 20/6; F2,47 = 0.81, P = 0.45, one-way ANOVA). (G) Example FSI-to-MSN uIPSCs before, right after, and 2 min after a 5-s depolarization of the MSN. (HJ) Summarized results showing that DSI of FSI-to-MSN synaptic transmission, which was prevented by AM251 (H), was not affected 1 d (I) or 45 d (J) after cocaine self-administration (percent inhibition by depolarization: AM251, −3.1 ± 3.5, n = 8/3; control, 18.0 ± 4.0, n = 22/9; withdrawal d1, 14.5 ± 3.3, n = 29/8; withdrawal d45, 16.3 ± 5.3, n = 9/4, F2,57 = 0.26, P = 0.77, one-way ANOVA). (K) Summarized results showing that the magnitudes of FSI-to-MSN DSI were similar in mice with or without cocaine exposure (percent inhibition: AM251, −3.1 ± 3.5, n = 8/3; control, 18.0 ± 4.0, n = 22/9; withdrawal d1, 14.5 ± 3.3, n = 29/8; withdrawal d45, 16.3 ± 5.3, n = 9/4, F2,57 = 0.259, P = 0.773, one-way ANOVA).
Fig. S3.
Fig. S3.
Cocaine self-administration results of the mice used in electrophysiological experiments and additional summaries of electrophysiological results. (A) Summary showing the active vs. inactive lever pressing as well as cocaine infusions. These mice were used in the electrophysiology experiments in Figs. 3 and 4 AH. (B and C) Summaries showing the Q (in picoamperes: control, 14.6 ± 1.0, n = 14/5; withdrawal d 1, 17.0 ± 1.8, n = 6/3; withdrawal d 45, 11.8 ± 1.5, n = 12/4; B) and N (control, 86.3 ± 16.9; withdrawal d 1, 25.4 ± 10.8; withdrawal d 45, 60.3 ± 12.9; C) of BLA-to-FSI synapses in control mice and in mice after 1 d or 45 d withdrawal from cocaine self-administration. (D and E) Summaries showing the Q (in picoamperes: control, 12.9 ± 1.5, n = 12/5; withdrawal d 1, 17.0 ± 2.7, n = 11/5; withdrawal d 45, 12.3 ± 1.7; D) and N (control, 113.9 ± 45.3; withdraw d 1, 45.3 ± 12.1; withdrawal d 45, 83.6 ± 27.4; E) of mPFC-to-FSI synapses in control mice and in mice after 1 or 45 d withdrawal from cocaine self-administration. (FH) Summarized results showing three attempted LTD protocols, which reduced BLA-to-MSN and BLA-to-FSI synaptic transmissions with similar magnitudes.
Fig. 4.
Fig. 4.
The BLA-to-FSI projection in cocaine self-administration. (AC) Example MPFA recordings of BLA-to-FSI synaptic transmission in control mice (A) and mice 1 d (B) or 45 d (C) after cocaine self-administration. (D) Summarized results showing that the Pr of BLA-to-FSI synapses was increased after 1 or 45 d withdrawal from cocaine self-administration (control, 0.25 ± 0.04, n = 14/5; withdrawal d 1, 0.41 ± 0.04, n = 6/3; withdrawal d 45, 0.43 ± 0.05, n = 12/4; F2,30 = 7.72, P = 0.00, one-way ANOVA; control vs. withdrawal d 1, P = 0.03; control vs. withdrawal d 45, P = 0.00, Tukey’s posttest; one-sample Kolmogorov–Smirnov test: control P = 0.18, d 1 P = 0.17, d 45 P = 0.55). (EG) Example MPFA recordings of mPFC-to-FSI synaptic transmission in control mice (E) and mice 1 d (F) or 45 d (G) after cocaine self-administration. (H) Summarized results showing that the Pr of mPFC-to-FSI transmission was not affected by cocaine exposure (one-sample Kolmogorov–Smirnov test: control P = 0.90, d 1 P = 0.82, d 45 P = 0.93). (I) Diagrams showing the experimental setup, in which we expressed ChR2 in the BLA and recorded BLA-to-MSN or BLA-to-FSI synaptic transmission by optogenetically stimulating the BLA-to-NAc projection in the NAcSh. (J) Summarized results showing that the optogenetic LTP induction protocol (20 Hz × 1 min × three times, with 1-min interstimulation interval) persistently potentiated BLA-to-FSI synaptic transmission without affecting BLA-to-MSN synaptic transmission (percent of baseline 30 min after LTP: FSI, 133.4 ± 10.3, n = 20/5; MSN, 98.9 ± 6.8, n = 24/8; P = 0.006, t test). (K) Diagrams showing the workflow of behavioral experiments, in which mice first received intra-BLA injection of ChR2-experssing AAV and self-administration surgery and after recovery received bilateral intra-NAc optogenetic stimulations for BLA-to-FSI LTP induction before the 2-h self-administration training every day. (LN) Summarized results showing that prestrengthening of BLA-to-FSI transmission expedited the acquisition of cocaine self-administration by promoting active lever press (F4,100 = 3.1, P = 0.018, two-way ANOVA; second day, P = 0.00, Bonferroni posttest; L) without affecting inactive lever pressing (F4,100 = 0.2, P = 0.91; M), resulting in increased cocaine infusion (F4,100 = 5.4, P = 0.00, two-way ANOVA; second day, P = 0.00; N). *P < 0.05, **P < 0.01.

Similar articles

Cited by

References

    1. Pennartz CM, Groenewegen HJ, Lopes da Silva FH. The nucleus accumbens as a complex of functionally distinct neuronal ensembles: An integration of behavioural, electrophysiological and anatomical data. Prog Neurobiol. 1994;42:719–761. - PubMed
    1. Wheeler RA, Carelli RM. Dissecting motivational circuitry to understand substance abuse. Neuropharmacology. 2009;56:149–159. - PMC - PubMed
    1. O’Donnell P, Grace AA. Synaptic interactions among excitatory afferents to nucleus accumbens neurons: Hippocampal gating of prefrontal cortical input. J Neurosci. 1995;15:3622–3639. - PMC - PubMed
    1. Shiflett MW, Balleine BW. At the limbic-motor interface: Disconnection of basolateral amygdala from nucleus accumbens core and shell reveals dissociable components of incentive motivation. Eur J Neurosci. 2010;32:1735–1743. - PMC - PubMed
    1. Bossert JM, Marchant NJ, Calu DJ, Shaham Y. The reinstatement model of drug relapse: Recent neurobiological findings, emerging research topics, and translational research. Psychopharmacology (Berl) 2013;229:453–476. - PMC - PubMed

Publication types

LinkOut - more resources