. 2017 Oct 10;114(41):E8646-E8655.
doi: 10.1073/pnas.1702478114. Epub 2017 Sep 25.

Speed regulation of genetic cascades allows for evolvability in the body plan specification of insects

Affiliations

Speed regulation of genetic cascades allows for evolvability in the body plan specification of insects

Xin Zhu et al. Proc Natl Acad Sci U S A. .

Abstract

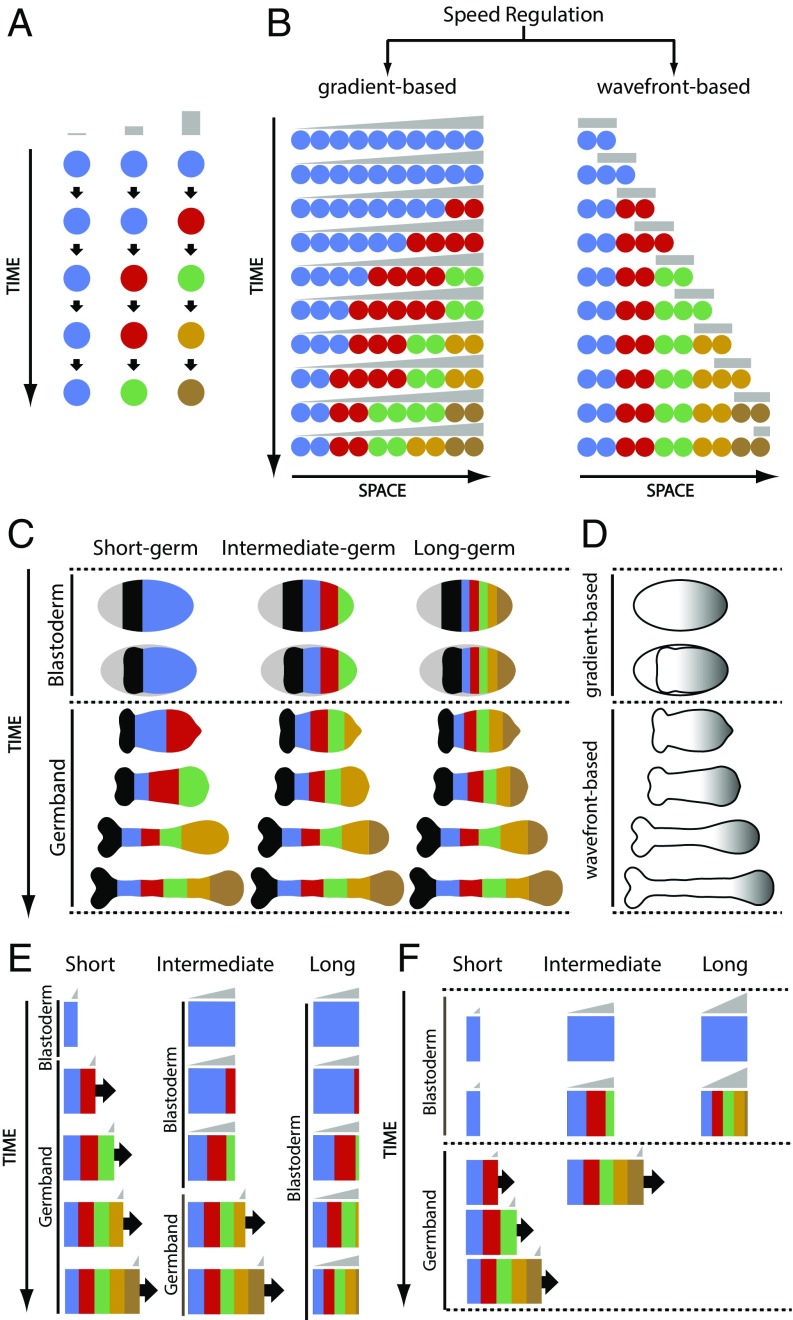
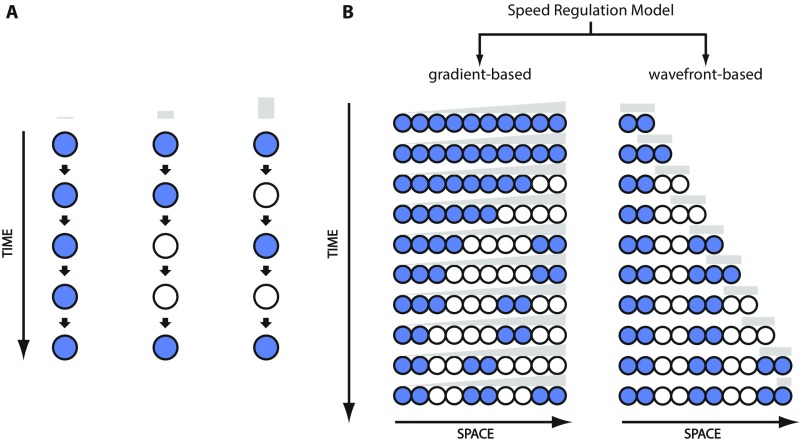
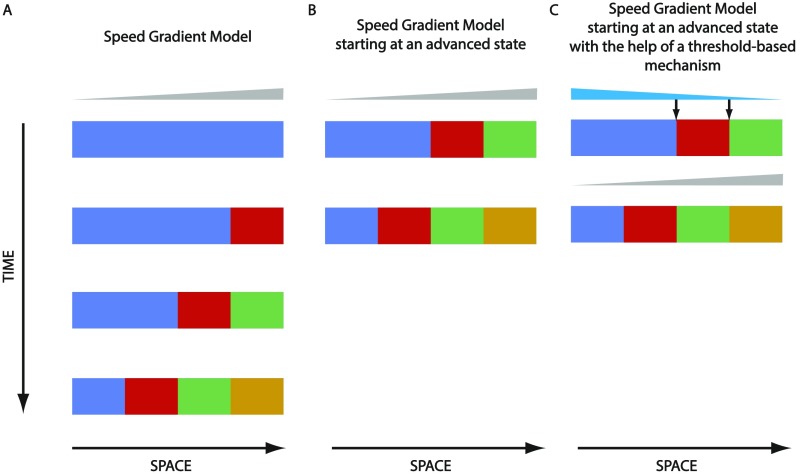
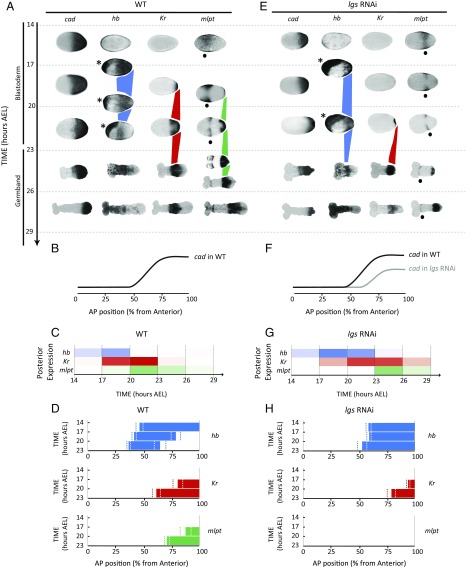
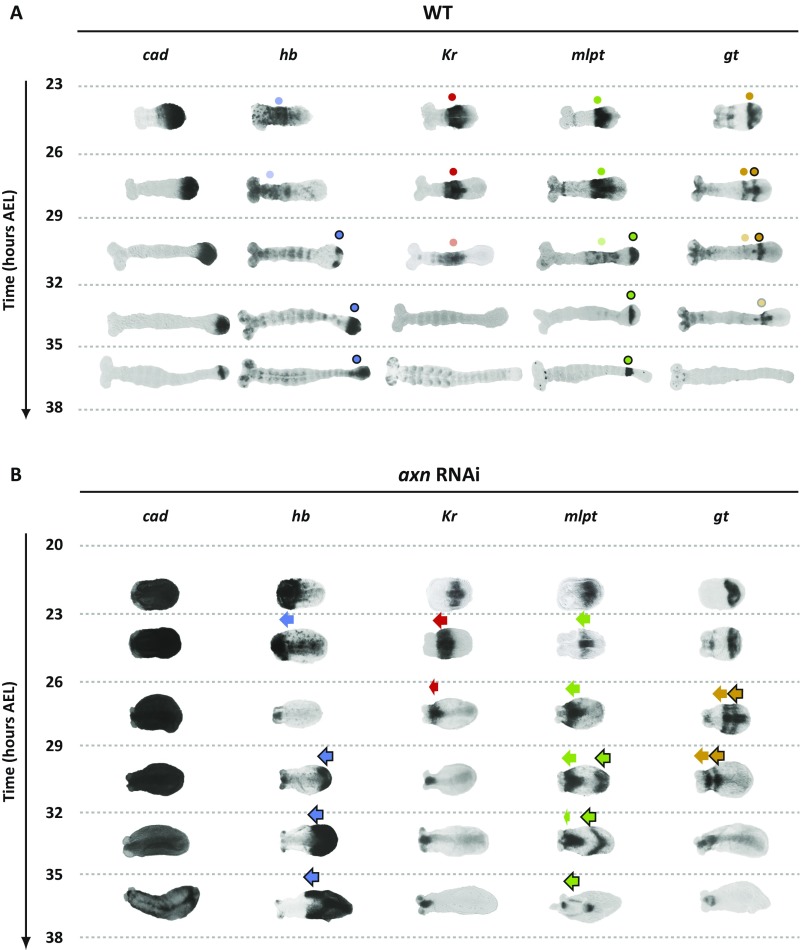
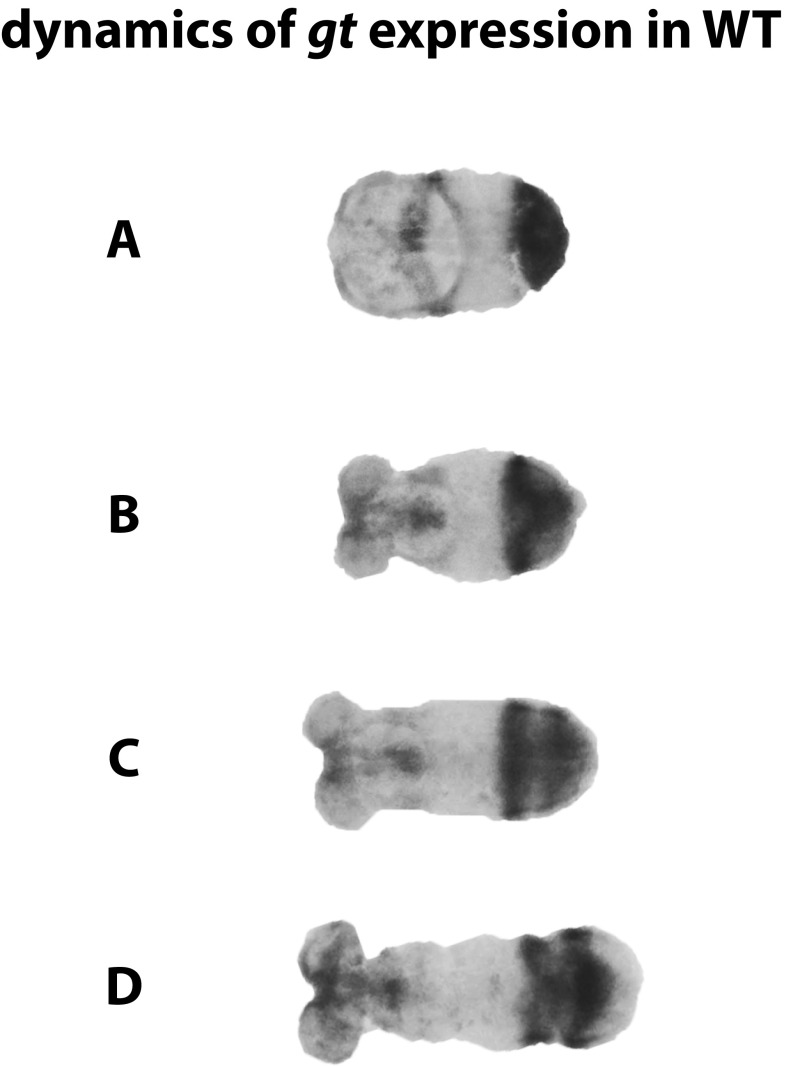
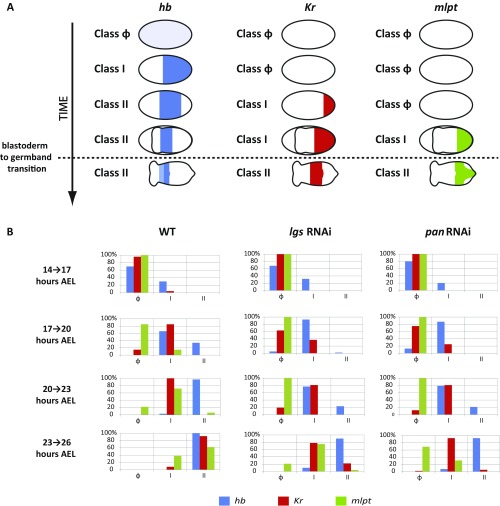
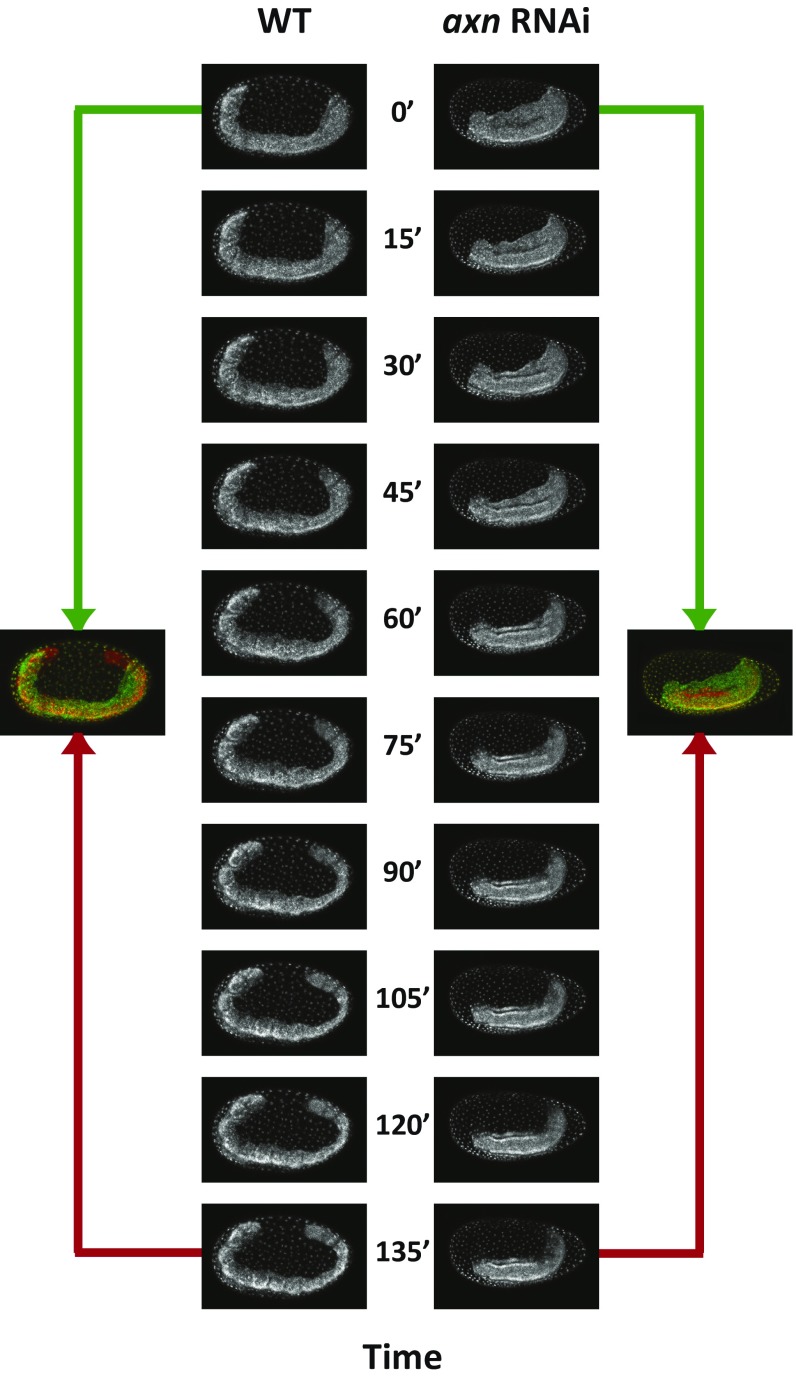
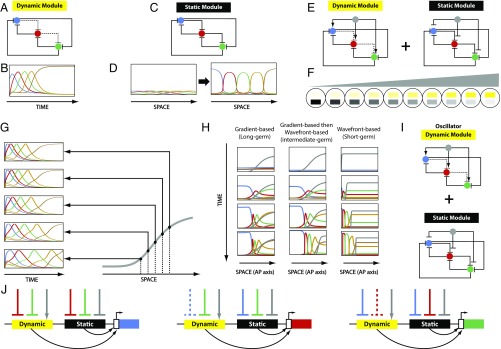
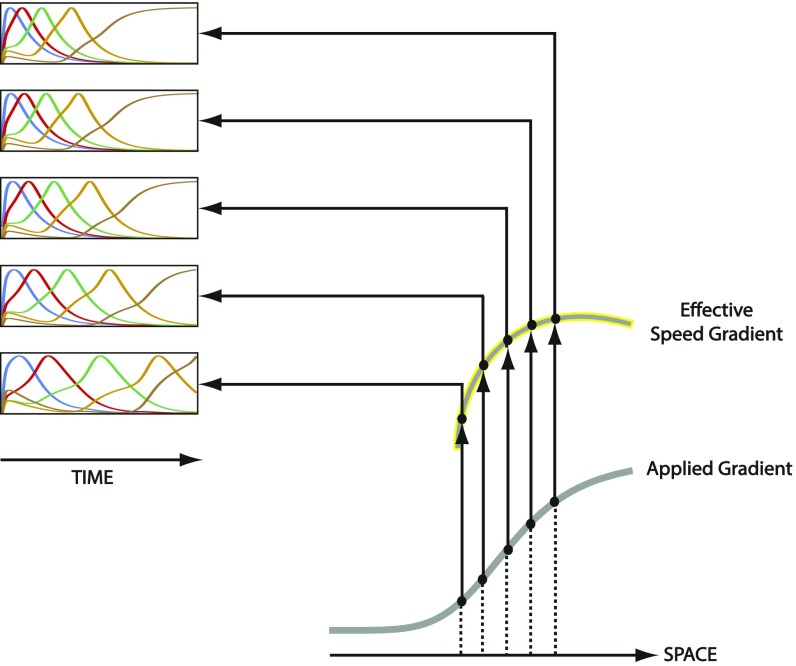
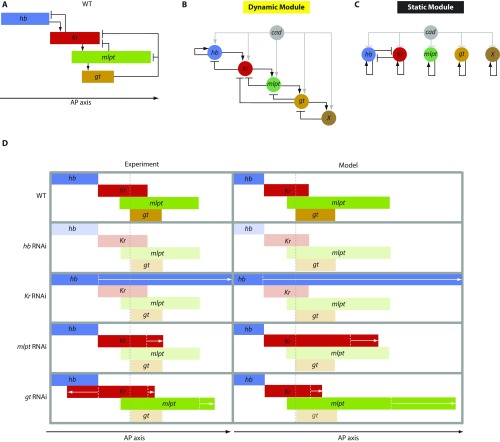
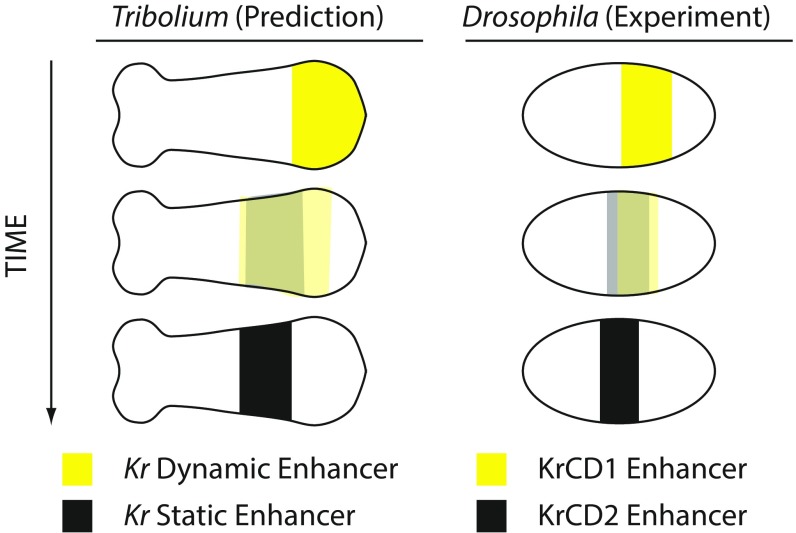
During the anterior-posterior fate specification of insects, anterior fates arise in a nonelongating tissue (called the "blastoderm"), and posterior fates arise in an elongating tissue (called the "germband"). However, insects differ widely in the extent to which anterior-posterior fates are specified in the blastoderm versus the germband. Here we present a model in which patterning in both the blastoderm and germband of the beetle Tribolium castaneum is based on the same flexible mechanism: a gradient that modulates the speed of a genetic cascade of gap genes, resulting in the induction of sequential kinematic waves of gap gene expression. The mechanism is flexible and capable of patterning both elongating and nonelongating tissues, and hence converting blastodermal to germband fates and vice versa. Using RNAi perturbations, we found that blastodermal fates could be shifted to the germband, and germband fates could be generated in a blastoderm-like morphology. We also suggest a molecular mechanism underlying our model, in which gradient levels regulate the switch between two enhancers: One enhancer is responsible for sequential gene activation, and the other is responsible for freezing temporal rhythms into spatial patterns. This model is consistent with findings in Drosophila melanogaster, where gap genes were found to be regulated by two nonredundant "shadow" enhancers.

Keywords: cascade; clock-and-wavefront; enhancer switching; evolution; kinematic waves.


Conflict of interest statement

The authors declare no conflict of interest.

Figures

Fig. 1.
Fig. 1.
The core mechanism of speed regulation model is flexible, can pattern elongating and nonelongating tissues, and can explain short-germ to long-germ evolution in insects. (A) Core mechanism of speed regulation model: The speed of sequential activation of states (or fates) is regulated by the concentration of a speed regulator. Different states are shown in different colors (in the order of sequential transitioning): blue, red, green, gold, and brown. The speed regulator is shown in gray. (B) Speed regulation model can operate in a gradient-based mode to pattern nonelongating tissues (Left) and in a wavefront-based mode to pattern elongating tissues (Right). (C) AP fates (shown in different colors) are specified during two different phases of insect early development: blastoderm and germband. Most AP fates are specified during the germband stage in short-germ insects (Left), and during the blastoderm stage in long-germ insects (Right). In intermediate-germ insects (Middle), anterior fates are specified in the blastoderm, whereas posterior fates are specified in the germband. (D) Presumed expression of speed regulator (gray) in insects. Blastoderm can be patterned with the gradient-based mode of speed regulation model, whereas germband can be patterned with the wavefront-based mode. (E and F) Computer simulation of two strategies for short- to intermediate- to long-germ evolution based on the speed regulation model. (E) A short-germ insect can evolve into an intermediate germ by delaying the blastoder-to-germband transition; similarly, an intermediate-germ insect can evolve into a long germ by introducing a further delay to blastoderm-to-germ transition (Movie S1). (F) A short-germ insect can evolve into an intermediate germ by boosting the speed regulator; similarly, an intermediate-germ insect can evolve into a long germ by further boosting the speed regulator (Movie S2).
Fig. S1.
Fig. S1.
Speed (here frequency) regulation model can segment elongating and nonelongating tissues. (A) Core mechanism of speed/frequency regulation model: The speed/frequency of a molecular clock is regulated by the concentration of a speed/frequency regulator. High phase of the oscillator is shown in blue, and low phase is shown in white. The speed/frequency regulator is shown in gray. (B) Speed/frequency regulation model can operate in a gradient-based mode to pattern nonelongating tissues (Left) and in a wavefront-based mode to pattern elongating tissues (Right).
Fig. S2.
Fig. S2.
Speeding up gradient-based patterning by initialization with an advanced state. (A) Shown is the gradient-based mode of speed regulation model. (B) Instead of initializing all cells with the first state (here blue), patterning could be sped up by prepatterning the cells along space with an advanced state (here blue, red, and green, from left to right). In this way, it takes a shorter time to reach the final state (here blue, red, green, and gold, from left to right). (C) Initializing the spatial axis with a prepattern could be achieved using a threshold-based mechanism (via another gradient, here in cyan), assuming that a threshold-based mechanism is faster than the speed regulation mechanism. Speed regulator is shown in gray.
Fig. 2.
Fig. 2.
Dynamics and regulation of gap genes in Tribolium blastoderm. (AD) Gap genes are expressed as sequential waves in WT Tribolium embryos within cad expression domain; cad is expressed as a posterior-to-anterior gradient in the blastoderm (cad in A; quantification of the gradient is shown in B) and retracts to the posterior end (growth zone) of the embryo in the germband stage (23 h AEL onward). The hb, Kr, and mlpt waves are traced in blue, red, and green, respectively, in A. Extraembryonic expression of hb is marked with an asterisk. Head expression of mlpt (not considered in our analysis) is marked with a black dot. (C) Temporal profile of gap genes expression at the posterior end of WT embryo demonstrates their sequential (yet overlapping) expression. Color intensity of a bar within a time window reflects the percentage of embryos having a high level of gene expression of the corresponding gene in that time window (Materials and Methods). (D) Spatial distribution of gap genes along the AP axis of WT Tribolium blastoderm over time (Materials and Methods) demonstrates their posterior-to-anterior shifts over time. Dashed lines show expression domain borders ± SE. For detailed description of gap gene expression in WT, see SI Detailed Description of Gap Gene Expression in WT and axn RNAi Embryos. (EH) The cad gradient is reduced and shifted toward posterior in lgs RNAi embryos. Correspondingly, gap gene waves are slower and shifted toward posterior. B and F are reproduced with permission from ref. . In all embryos shown, anterior is to the left.
Fig. S3.
Fig. S3.
Dynamics and regulation of gap genes in Tribolium germband (full dataset). (A) Gap genes continue to be expressed sequentially in the posterior end of WT Tribolium germband (the so-called growth zone); cad is expressed in the growth zone and retracts as the germband elongates. More to the anterior, early expressed gap gene domains stabilize and eventually fade. Expression patterns are tracked by dots. Faint dots represent decaying expression. Dots outlined in black signify the second domain of genes that have two expression domains in the germband (hb, mlpt, and gt). (B) In axn RNAi embryos, germband experiences very limited axial elongation, and cad expression does not retract. Nevertheless, gap genes continue to emanate from the posterior and propagate toward anterior until they reach the (much reduced in size) head lobes. Expression patterns are tracked by arrows. Arrows outlined in black signify the second domain of genes that have two expression domains in the germband (hb, mlpt, and gt). For a detailed description of gap gene expression in WT and axn RNAi embryos, see SI Detailed Description of Gap Gene Expression. In all embryos shown, anterior is to the left.
Fig. S4.
Fig. S4.
Dynamics of gt expression in WT embryos. (A) The gt expression turns on in the posterior end of early Tribolium germband, (B) then turns off, (C) turns on again, and (D) then finally turns off, creating two stripes of expression more anteriorly. Anterior is to the left.
Fig. S5.
Fig. S5.
Distribution of temporal classes of gap gene expression patterns in timed egg collections. (A) Early gap gene (hb, Kr, and mlpt) expression patterns are each classified into three temporally consecutive classes: class Φ for early weak maternal expression (hb) or no expression (Kr and mlpt), class I for high expression at the posterior, and class II for an expression turning off at posterior. (B) Percentages of embryos belonging to each class are calculated for consecutive 3-h developmental windows covering the blastoderm and early germband stages of Tribolium: 14 h to 17 h, 17 h to 20 h, 20 h to 23 h, and 23 h to 26 h AEL.
Fig. S6.
Fig. S6.
The hb and Kr expression domain borders undergo dynamic shifts within 17 h to 20 h AEL in Tribolium blastoderm. To examine if the shifting of hb and Kr expression domain borders is smooth, we analyzed their dynamics with higher temporal resolution. The last cycle of synchronous mitoses in the Tribolium blastoderm stops before 14 h AEL (5). Midway during the 17- to 20-h window, the blastoderm starts a phase of asynchronous mitoses that lasts until 23 h AEL. We compared border positions of hb and Kr expression domains in early versus later times within the 17- to 20-h window, marked by the lack and possession of mitoses, respectively. We found that the anterior borders of both hb and Kr indeed shift smoothly from posterior to anterior. (A) Positions of anterior and posterior borders of hb expression domain along the AP axis of Tribolium blastoderm during the no mitosis phase (early within 17 h to 20 h AEL) and the mitosis phase (late within 17 h to 20 h AEL). (B) Position of anterior border of Kr expression domain along the AP axis of Tribolium blastoderm during the no mitosis phase and the mitosis phase.
Fig. S7.
Fig. S7.
Characterization of gap gene wave dynamics upon the retraction of cad gradient. Here we carefully examine if the retraction of cad gradient correlates with the arrest of gap gene expression waves. The cad retracts to posterior at the onset of the germband stage. Since the AP axis of the germband undergoes continuous elongation, we need stable nonshifting positional markers to which we can compare gap gene borders. It was previously shown that the pair-rule gene even-skipped (eve) is expressed in waves that slow down while propagating from posterior to anterior until they finally stabilize and split into two secondary domains (5). This is clear from comparing eve transcripts to Eve proteins in the same embryos in A (5). As eve emanates from the posterior, there is a clear shift between eve transcripts and proteins. These shifts become progressively smaller as eve stripes propagate away from the posterior. Finally, eve transcripts and proteins completely overlap at the time when their expressions split into two secondary domains (in A). This indicates that eve secondary domains are stable and undergo no further shifts. Due to the stability of the splitting Eve stripes, we will use them as positional markers along the AP axis. Late within 20 h to 23 h AEL, the anterior border of hb coincides with the anterior border of the first stripe of Eve (white arrow in C). At that time, the first Eve stripe has not split yet, but its expression is already stable, judging from the complete overlap between eve mRNA and Eve proteins (A, 20 h to 23 h AEL). By that time, cad gradient has retracted to abut the posterior border of the second Eve stripe (white arrow in B), away from the anterior border of hb. Early within 23 h to 26 h AEL, the anterior border of hb was found to be still coinciding with the anterior border of first Eve stripe (now fully split, cyan arrow in C). At later times, the anterior half of hb expression decays, precluding further analysis (late 23 h to 26 h AEL, C). On the other hand, mlpt expression is more to the posterior of hb and is within the spatial limit of cad expression during both 20 h to 23 h AEL and 23 h to 26 h AEL (compare D to B). Correspondingly, the anterior border of mlpt continues to propagate toward anterior until it reaches the posterior border of the second (splitting) Eve stripe and remains there (compare the relative positions of red and green dashed lines in D with time). This suggests that gap gene waves are dynamic in the presence of cad and are stabilized upon the retraction of cad gradient.
Fig. 3.
Fig. 3.
Speed regulation model recapitulates gap gene expression in Tribolium WT, lgs RNAi, pan RNAi, and axn RNAi embryos. (A) In a computer simulation, where the speed of Tribolium gap gene sequence is regulated by cad gradient (black/gray; darker corresponds to higher concentration), gap gene (hb, blue; Kr, red; mlpt, green; gt, gold) spatiotemporal dynamics were recapitulated during blastoderm and germband stages of WT Tribolium embryos (compare with Fig. 2A and Fig. S3A). (B) To simulate lgs RNAi background, cad gradient was reduced and shifted toward posterior. Accordingly, gap gene waves were slower and shifted toward posterior (compare with Fig. 2E). (C) To simulate pan RNAi background, cad gradient was reduced, stretched, and shifted toward anterior. Accordingly, gap gene waves were slower, stretched, and shifted toward anterior (compare with Fig. S8I). (D) To simulate axn RNAi background, germband elongation and cad gradient retraction were halted. Accordingly, gap gene waves continued to propagate and shrink in the germband and never stabilized (compare with Fig. S3B). See Movie S3.
Fig. S8.
Fig. S8.
Dynamics and regulation of gap genes in the Tribolium blastoderm (full dataset). (AD) Gap genes are expressed as sequential waves in WT Tribolium embryos within cad expression domain; cad is expressed as a posterior-to-anterior gradient in the blastoderm (cad in A; quantification of the gradient is shown in B) and retracts to the posterior end (growth zone) of the embryo in the germband stage (23 h AEL onward). The hb, Kr, and mlpt waves are traced in blue, red, and green, respectively, in A. Extraembryonic expression of hb is marked with an asterisk. Head expression of mlpt (not considered in our analysis) is marked with a black dot. (C) Temporal profile of gap genes expression at the posterior end of WT embryo demonstrates their sequential (yet overlapping) expression. Color intensity of a bar within a time window reflects the percentage of embryos having high level of gene expression of the corresponding gene in that time window (Materials and Methods). (D) Spatial distribution of gap genes along the AP axis of WT Tribolium blastoderm over time (Materials and Methods) demonstrates their posterior-to-anterior shifts over time. Dashed lines show expression domain borders ± SE. For detailed description of gap gene expression in WT, see SI Detailed Description of Gap Gene Expression. (EH) The cad gradient is reduced and shifted toward posterior in lgs RNAi embryos. Correspondingly, gap gene waves are slower and shifted toward posterior. (IL) The cad gradient is reduced, stretched, and shifted toward anterior in pan RNAi embryos. Correspondingly, gap gene waves are slower, stretched, and shifted toward anterior. B, F, and J are reproduced with permission from ref. . Anterior is to the left.
Fig. 4.
Fig. 4.
Dynamics and regulation of gap genes in Tribolium germband. (A) Gap genes continue to be expressed sequentially in the posterior end of WT Tribolium germband (the so-called growth zone); cad is expressed in the growth zone and retracts as the germband elongates. More to the anterior, early expressed gap gene domains stabilize and eventually fade. Expression patterns are tracked by dots. Faint dots represent decaying expression. Dots outlined in black signify the second expression domains of mlpt and gt. (B) In axn RNAi embryos, germband experiences very limited axial elongation, and cad expression does not retract. Nevertheless, gap genes continue to emanate from the posterior and propagate toward anterior until they reach the (much reduced in size) head lobes. Expression patterns are tracked by arrows. Arrows outlined in black signify the second domain of mlpt and gt. For detailed description of axn RNAi phenotype, see SI Detailed Description of Gap Gene Expression in WT and axn RNAi Embryos. For the full dataset of all gap gene expression dynamics during germband stage, see Fig. S3. In all embryos shown, anterior is to the left.
Fig. S9.
Fig. S9.
Germbands of axn RNAi embryos undergo limited AP axis elongation compared with WT. Shown are snapshots of live imaging of WT and axn RNAi Tribolium embryos during germband stage (Movie S4). As clear from the overlay of early (green) and late (red) time points, WT germband experiences substantial growth along the AP axis. On the other hand, axn RNAi germbands experience little or no growth in the AP direction. Note that, in the axn RNAi embryo shown, the embryo slides dorsally (upward) inside the egg. In all embryos shown, anterior is to the left, and dorsal is up.
Fig. 5.
Fig. 5.
Gradual enhancer switching model. (A) A three-gene cascade (dynamic module). Solid line, strong repression; dashed line, weak repression. (B) Computer simulation of a five-gene cascade (same structure as the three-gene cascade: Every gene is strongly repressing all other genes, except only weakly repressing its immediate successor in the cascade). Shown are expression profiles of the cascade constituent genes over time. (C) A three-gene mutual exclusion gene network (static module). (D) Shown is an array of cells along a spatial axis. Active in each cell is a five-gene mutual exclusion gene network (same structure as the three-gene mutual exclusion network: Every gene is strongly repressing all others). Cells along the spatial axis are initialized with a broad and diffuse domains of the expression of five genes (Left). Over time, the diffuse domains get stronger and sharper (Right). (E) The gradual enhancer switching gene network: A speed regulator (gray) is activating all of the genes in the dynamic module, while repressing all of the genes in the static module. (F) Shown is an array of cells in which the gradual enhancer switching gene network is active. Applied to the array is a gradient of the speed regulator (gray). This results in the gradual switching from the dynamic module (yellow) to the static module (black) as we go from high to low values of the gradient. (G) Computer simulations of the gradual enhancer switching model at different positions along the spatial axis (i.e., different values of the gradient, shown in gray): The higher the concentration of the gradient, the higher the speed of sequential activation of genes. (H) Computer simulations of the gradual enhancer switching model under different conditions: nonretracting speed regulator (gradient-based, long-germ insects; Left), retracting speed regulator (wavefront-based, short-germ insects; Right), and nonretracting then retracting speed regulator (gradient-based then wavefront-based, intermediate-germ insects; Middle). See Movie S5. (I) The gradual enhancer switching model with an oscillator as a dynamic module. The model induces oscillatory kinematic waves of gene expression, observed in vertebrates and insects (Movie S7). (J) Encoding dynamic and static modules by separate enhancers ensures modularity, since each module requires different regulatory logic. Shown is the regulatory wiring required for each gene in the combined dynamic+static gene network in E. Solid lines, strong interactions; dashed lines, weak interactions.
Fig. S10.
Fig. S10.
The gradual enhancer switching model results in a more downwardly concave effective speed gradient than the applied gradient. Shown are computer simulations of the gradual enhancer switching model at different positions along the spatial axis (i.e., different values of the applied gradient, gray). Equal changes in applied gradient values result in unequal changes in speeds of sequential activation. Specifically, changes around lower values of the gradient induce bigger changes in speed, resulting in a downwardly concave effective speed gradient (gray outlined in yellow).
Fig. S11.
Fig. S11.
Tribolium enhancer switching model vs. experiment (see also SI Tribolium-Specific Enhancer Switching Model). (A) A simplified schematic diagram showing final gap gene expression patterns along the AP axis, and genetic interactions between gap genes as deduced from genetic manipulations. (B and C) A two-enhancer model for gap gene regulation. An unknown factor (gene X) is assumed to repress gt from posterior. (D) Gap gene expression patterns in WT and different gap gene RNAi knockdowns as observed experimentally (Left) and as predicted by the two enhancers model (Right). For simplicity, the striped expression of gt and the posterior expression of hb are considered neither in experiment nor in model schematic diagrams. See Movie S8 and SI Tribolium-Specific Enhancer Switching Model.
Fig. 6.
Fig. 6.
Predictions of the enhancer switching model in Tribolium and recapitulation in Drosophila. (Left) The predicted expression of the dynamic (yellow) and static (black) enhancers of Kr in Tribolium according to the enhancer switching model (see also Movie S10). The dynamic enhancer turns on early and progressively decays with time while shifting toward anterior; meanwhile, the static enhancer is building up and forms a stable expression at a more anterior location. (Right) The expression dynamics of the two enhancers driving Kr expression in Drosophila: KrCD1 (yellow) and KrCD2 (black). KrCD1 is active first and progressively decays; meanwhile, KrCD2 turns on and stays active slightly more to the anterior. Faint colors signify weaker expression.

Similar articles

Cited by

References

    1. Palmeirim I, Henrique D, Ish-Horowicz D, Pourquié O. Avian hairy gene expression identifies a molecular clock linked to vertebrate segmentation and somitogenesis. Cell. 1997;91:639–648. - PubMed
    1. Dequéant ML, et al. A complex oscillating network of signaling genes underlies the mouse segmentation clock. Science. 2006;314:1595–1598. - PubMed
    1. Li Y, Fenger U, Niehrs C, Pollet N. Cyclic expression of esr9 gene in Xenopus presomitic mesoderm. Differentiation. 2003;71:83–89. - PubMed
    1. Sarrazin AF, Peel AD, Averof M. A segmentation clock with two-segment periodicity in insects. Science. 2012;336:338–341. - PubMed
    1. El-Sherif E, Averof M, Brown SJ. A segmentation clock operating in blastoderm and germband stages of Tribolium development. Development. 2012;139:4341–4346. - PMC - PubMed

Substances

LinkOut - more resources