. 2017 Oct 17;114(42):11034-11039.
doi: 10.1073/pnas.1707675114. Epub 2017 Oct 2.

Universal poroelastic mechanism for hydraulic signals in biomimetic and natural branches

Affiliations

Universal poroelastic mechanism for hydraulic signals in biomimetic and natural branches

J-F Louf et al. Proc Natl Acad Sci U S A. .

Erratum in

Abstract

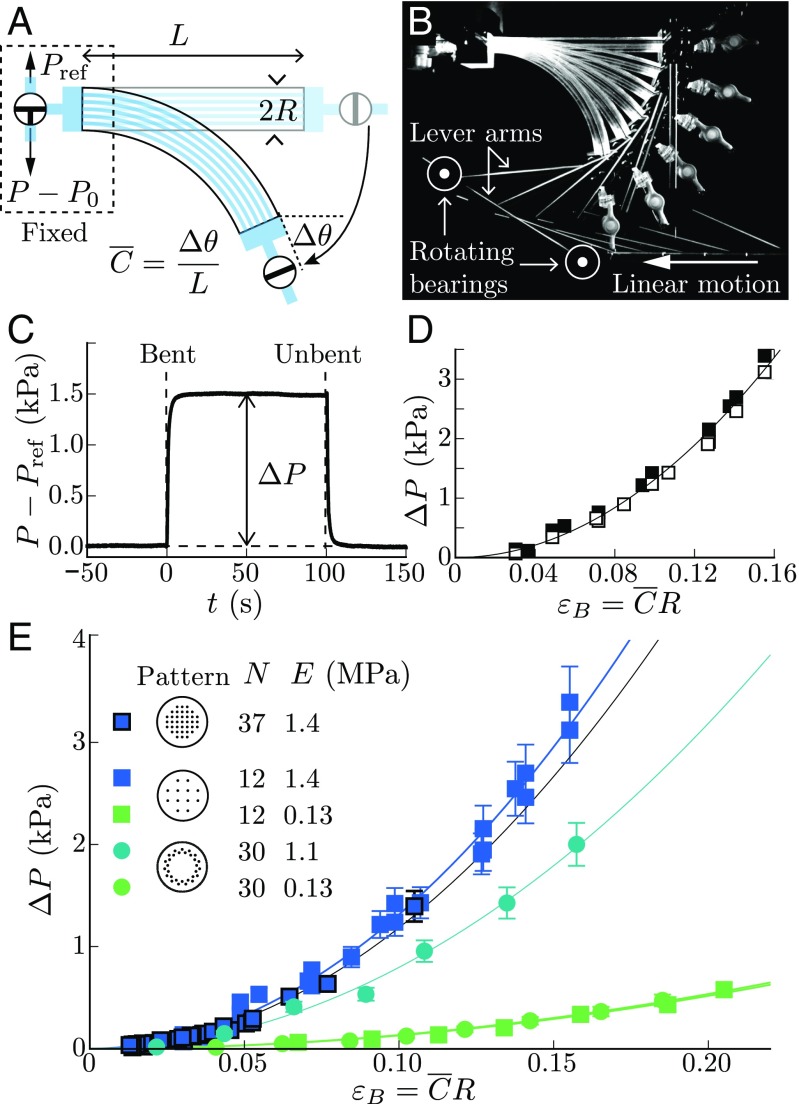
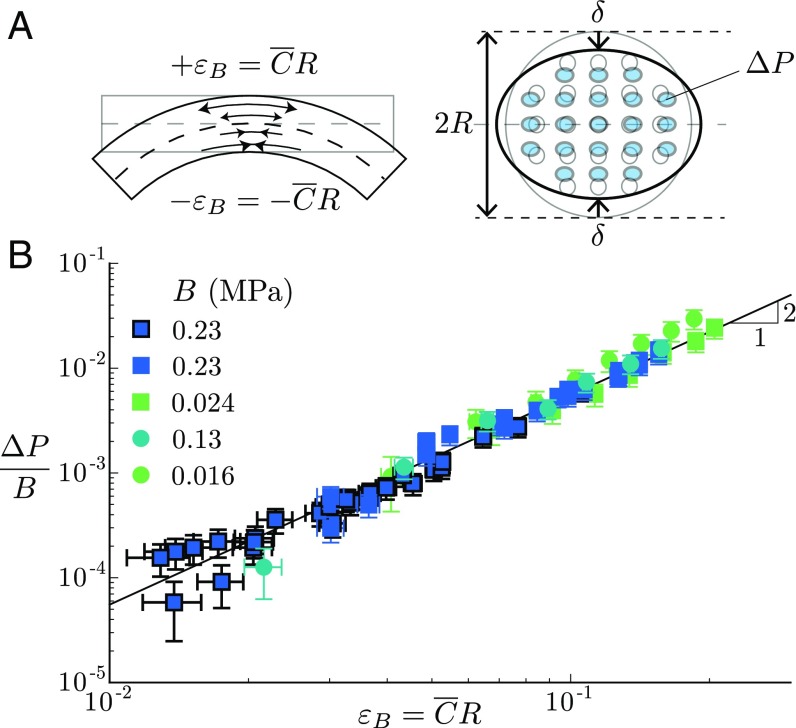
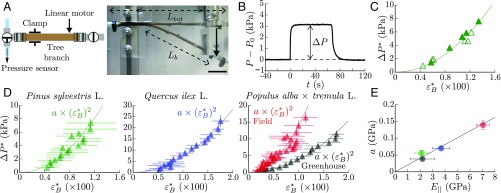
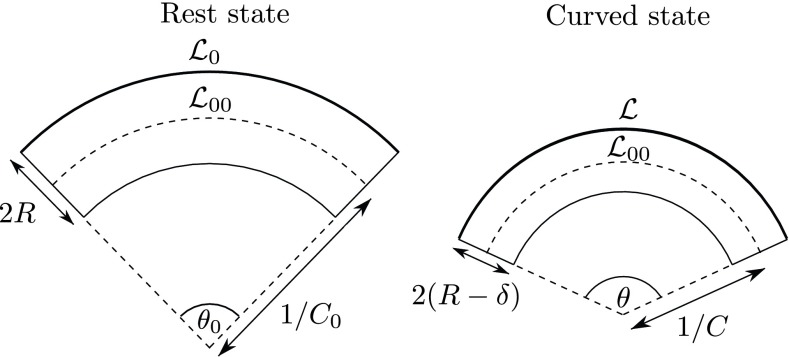
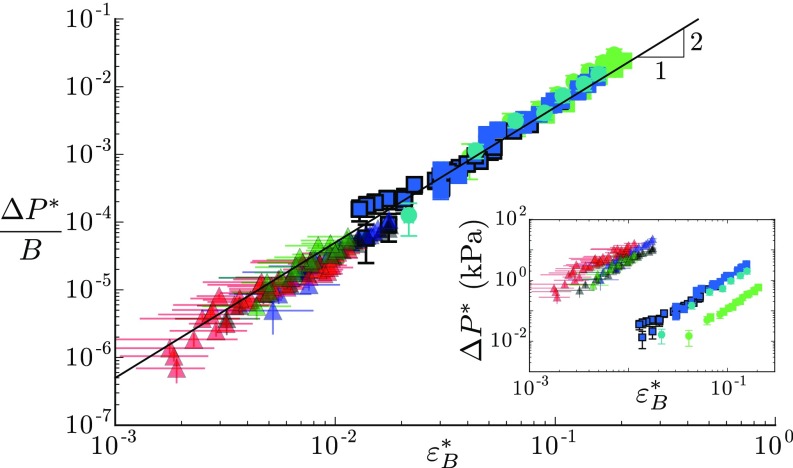
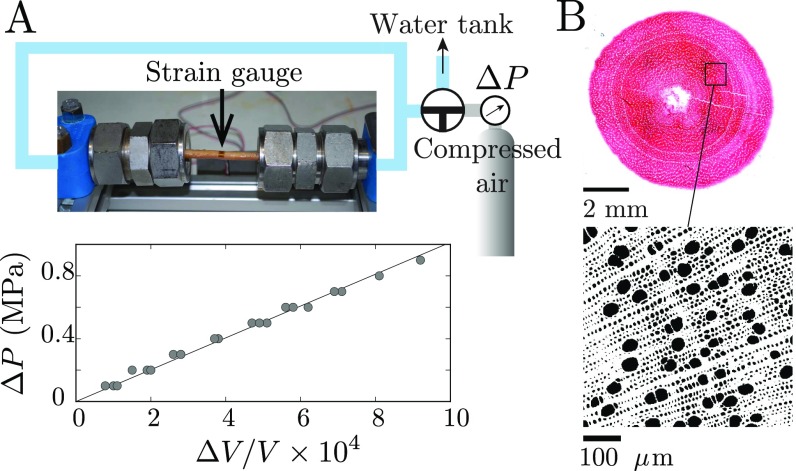
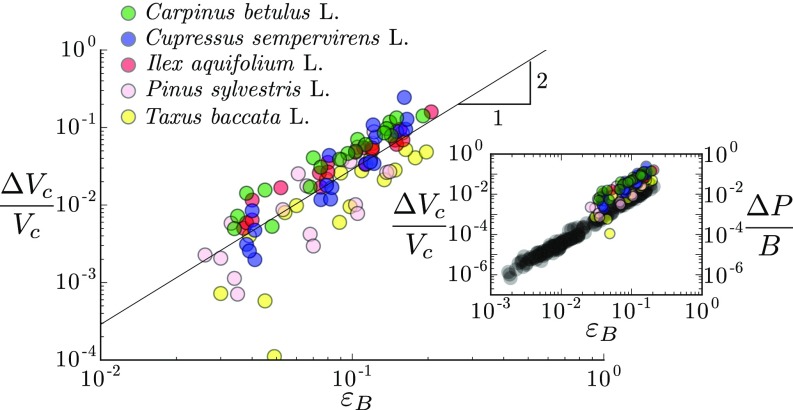
Plants constantly undergo external mechanical loads such as wind or touch and respond to these stimuli by acclimating their growth processes. A fascinating feature of this mechanical-induced growth response is that it can occur rapidly and at long distance from the initial site of stimulation, suggesting the existence of a fast signal that propagates across the whole plant. The nature and origin of the signal is still not understood, but it has been recently suggested that it could be purely mechanical and originate from the coupling between the local deformation of the tissues (bending) and the water pressure in the plant vascular system. Here, we address the physical origin of this hydromechanical coupling using a biomimetic strategy. We designed soft artificial branches perforated with longitudinal liquid-filled channels that mimic the basic features of natural stems and branches. In response to bending, a strong overpressure is generated in the channels that varies quadratically with the bending curvature. A model based on a mechanism analogous to the ovalization of hollow tubes enables us to predict quantitatively this nonlinear poroelastic response and identify the key physical parameters that control the generation of the pressure pulse. Further experiments conducted on natural tree branches reveal the same phenomenology. Once rescaled by the model prediction, both the biomimetic and natural branches fall on the same master curve, enlightening the universality of our poroelastic mechanism for the generation of hydraulic signals in plants.

Keywords: biomimetism; long-distance signaling; nonlinear beams; plant biomechanics; poroelasticity.


Conflict of interest statement

The authors declare no conflict of interest.

Figures

Fig. 1.
Fig. 1.
Natural vs. biomimetic tree branches. (A) X-ray microtomography of a Vitis vinifera branch (grape vine), showing the network of longitudinal conducting vessels (dark gray). (B) Sketch of the mold used to design the synthetic branch with the different channel patterns investigated (Top, square array, N=37; Middle, square array, N=12; Bottom, circular array, N=30): i, piano strings; ii, POM plate; iii, Plexiglas tube; iv, Plexiglas block. (C) Picture of the synthetic branch made of PDMS elastomer after removal from the mold (Materials and Methods).
Fig. 2.
Fig. 2.
Hydraulic pulse induced by bending in PDMS biomimetic branches. (A and B) Sketch (A) and picture (B) of the bending setup and pressure measurements, where Δθ is the variation of angle between the free extremity and the clamped extremity of the beam, C¯ the mean curvature of the beam, R the beam radius, Pref is the initial fluid-pressure in the channels, and PP0 is the fluid-pressure in the channels relative to the atmospheric pressure. (C) Pressure response to bending/unbending sequence in a closed system (square channel pattern, N=12, E=1.4 MPa, εB=C¯R0.1). (D) Steady overpressure ΔP vs. bending strain εB=C¯R. Filled square, bent/unbent cycles with return to the straight state; open square, positive ramp of strain. (E) Overpressure ΔP vs. bending strain εB for various channel patterns, number of channels N, and PDMS Young moduli E. The solid lines in D and E are quadratic fits of the data.
Fig. S1.
Fig. S1.
(A) Top view of the bending setup, including a linear motor, lever arms, and rotating bearings. (B) Force balance on the bent beam. Once the displacement is imposed, the beam is subject to a force F which creates a bending moment M=NLB, a compression force N, and a tangential force T. (C) Beam’s profiles extracted by image analysis from top views during a sequence of motor displacements. Each profile is fitted by a law such that C(x)=Cbending+Cshear(1(x/L)), where Cbending and Cshear are fitting parameters and x is the coordinate along the beam. (D) Curvatures measured from the beam profiles as function of the displacement of the motor where C¯=Cbending+(Cshear/2).
Fig. 3.
Fig. 3.
Mechanism of hydraulic pulse generation and poroelastic modeling. (A) The nonlinear coupling between bending and transverse modes of deformation induces a transversal squeezing of the branch’s channels δ/RεB2 and thus an overpressure in the channels varying as ΔPBεB2, where B is the elastic bulk modulus of the branch. (B) Overpressure ΔP normalized by the measured elastic bulk modulus B as a function of the bending deformation εB for all biomimetic branches studied (same symbols as in Fig. 2E). The solid line gives the best quadratic fit of the data in log–log scale: ΔP/B=(0.55±0.02)×εB2 (R2=0.972).
Fig. S2.
Fig. S2.
Pressure response to bending normalized by the elastic bulk modulus of the biomimetic branches as function of the bending deformation εB=C¯R for a uniform curvature (blue symbols, quadratic fit y=0.62x2) and a linear variation of curvature (red symbols, quadratic fit y=0.97x2) (synthetic beams).
Fig. 4.
Fig. 4.
Hydraulic pulse induced by bending in natural tree branches. (A) Sketch of the experimental setup, where Ltot is the total branch length and Lb the bent length. (Scale bar, 5 cm.) (B) Xylem water pressure measured at the fixed extremity of a pine branch (Pinus sylvestris L.) in response to a bent/unbent sequence. (C) Relationship between the overpressure and the bending strain for the same branch using two different bending protocols: incremental step displacement (filled symbols) and step displacement with return to the initial position after each bending (open symbols). Here, ΔP=ΔP×(Ltot/Lb) and εB=εB(1+εB0/εB)1/2, where εB=R(C¯C¯0) and εB0=RC¯0, with C¯0 the mean curvature of the branch at rest (Extension of the Model to Beams with a Rest Curvature). The solid line is a quadratic fit of the data. (D) Overpressure ΔP vs. bending strain εB averaged over n branches for different tree species and growing conditions (symbols) with quadratic fit a×εB2 (solid lines). Green: P. sylvestris L., n=6, a=0.056±0.008 GPa, R2=0.91; blue: Q. ilex L., n=5, a=0.070±0.005 GPa, R2=0.94; red: Populus alba × tremula L. grown in field condition, n=7, a=0.139±0.013 GPa, R2=0.88; black: P. alba × tremula L. grown in greenhouse conditions, n=4, a=0.038±0.003 GPa, R2=0.98). Each symbol corresponds to a running average over five data (seven data for poplar in field conditions) with an overlap of 50%; error bars give the SD. (E) Coefficient of the quadratic fit a as function of the longitudinal Young’s modulus E (same color as in D). The coefficient a is found proportional to E (solid line: linear fit, R2=0.96).
Fig. S3.
Fig. S3.
Illustration of flattening of an initially curved beam induced by bending.
Fig. 5.
Fig. 5.
Comparison between biomimetic (squares; same symbols as in Fig. 3) and natural tree branches (triangles; same symbols as in Fig. 4). The overpressure ΔP normalized by the elastic bulk modulus B of each branch shows a common behavior with the amplitude of the bending strain εB. The solid line represents the best quadratic fit of all data in log–log scale: ΔP/B=(0.50±0.01)×εB2 (R2=0.98). (Inset) Overpressure vs. bending strain for all data.
Fig. S4.
Fig. S4.
Measurement of the channel bulk modulus in poplar branches (P. alba × tremula L.). (A) Experimental setup used to determine the macroscopic bulk modulus Bmacro from the relationship between the pressure increments ΔP and the relative change of the branch’s volume ΔV/V (see plot, here Bmacro=1±0.02 GPa). (B) Cytological cross-section for measurement of the channel’s fraction ψ (in black) and estimation of B via the relation B=ψBmacro.
Fig. S5.
Fig. S5.
Normalized expelled volume of water as function of the bending deformation (the maximal deformation at the center of the branch in a four-point bending setup) on five tree species [computed from the raw data of Lopez et al., 2014 (23)]. The best quadratic fit of the data gives ΔVc/Vc=(2.90±0.25)×εB2 (R2=0.68).

References

    1. Darwin C, Darwin F. The Power of Movement in Plants. Murray; London: 1880.
    1. Knight TA. Account of some experiments on the descent of the sap in trees. Phil Trans Roy Soc Lond. 1803;93:277–289.
    1. Jaffe MJ, Leopold AC, Staples RC. Thigmo responses in plants and fungi. Am J Bot. 2002;89:375–382. - PubMed
    1. Braam J. In touch: Plant responses to mechanical stimuli. New Phytol. 2005;165:373–389. - PubMed
    1. Telewski FW. A unified hypothesis of mechanoperception in plants. Am J Bot. 2006;93:1466–1476. - PubMed

Publication types

LinkOut - more resources