. 2017 Oct 17;114(42):11075-11080.
doi: 10.1073/pnas.1704512114. Epub 2017 Oct 2.

Asynchronous warming and δ18O evolution of deep Atlantic water masses during the last deglaciation

Affiliations

Asynchronous warming and δ18O evolution of deep Atlantic water masses during the last deglaciation

Jiaxu Zhang et al. Proc Natl Acad Sci U S A. .

Abstract

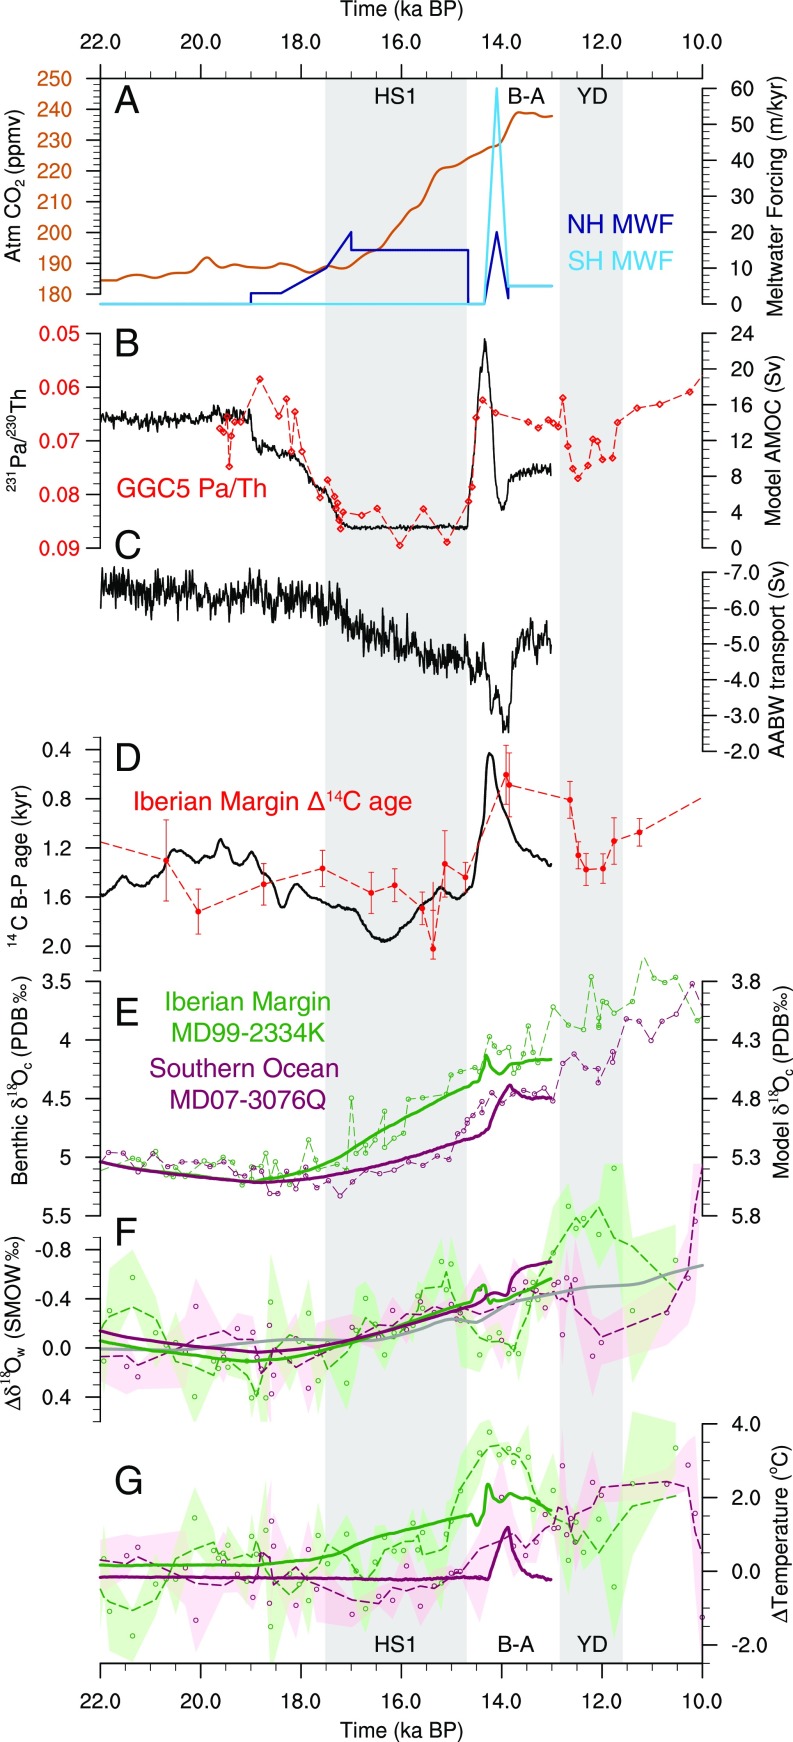
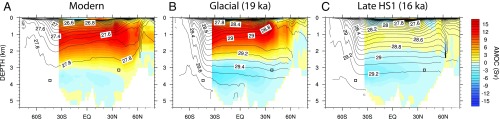
The large-scale reorganization of deep ocean circulation in the Atlantic involving changes in North Atlantic Deep Water (NADW) and Antarctic Bottom Water (AABW) played a critical role in regulating hemispheric and global climate during the last deglaciation. However, changes in the relative contributions of NADW and AABW and their properties are poorly constrained by marine records, including δ18O of benthic foraminiferal calcite (δ18Oc). Here, we use an isotope-enabled ocean general circulation model with realistic geometry and forcing conditions to simulate the deglacial water mass and δ18O evolution. Model results suggest that, in response to North Atlantic freshwater forcing during the early phase of the last deglaciation, NADW nearly collapses, while AABW mildly weakens. Rather than reflecting changes in NADW or AABW properties caused by freshwater input as suggested previously, the observed phasing difference of deep δ18Oc likely reflects early warming of the deep northern North Atlantic by ∼1.4 °C, while deep Southern Ocean temperature remains largely unchanged. We propose a thermodynamic mechanism to explain the early warming in the North Atlantic, featuring a strong middepth warming and enhanced downward heat flux via vertical mixing. Our results emphasize that the way that ocean circulation affects heat, a dynamic tracer, is considerably different from how it affects passive tracers, like δ18O, and call for caution when inferring water mass changes from δ18Oc records while assuming uniform changes in deep temperatures.

Keywords: Atlantic water masses; deep ocean warming; last deglaciation; oxygen isotopes.


Conflict of interest statement

The authors declare no conflict of interest.

Figures

Fig. 1.
Fig. 1.
Model deglacial signals compared with proxies. (A) Atmospheric CO2 concentration (orange) and meltwater fluxes of the Northern (navy) Hemisphere (NH) and Southern (blue) Hemisphere (SH) (SI Appendix, Table S1) applied in TRACE21 (13). (B) Pa/Th ratio at Bermuda [GGC5 (3)] as a proxy for the strength of AMOC and model maximum AMOC transport (below 500 m). (C) Model AABW transport in the Atlantic basin (the minimum AMOC transport below 2,000 m). The negative values indicate counterclockwise circulation. (D) 14C benthic–planktonic (B-P) age offset at Iberian Margin [MD99-2334K (27)] and model abiotic 14C B-P age (44) at this site. (E) Benthic δ18Oc at Iberian Margin [MD99-2334K (6, 31); green] and SO [MD07-3076Q (5, 8); pink] and the corresponding model δ18Oc. (F) Reconstructed deep water δ18Ow anomalies (respective LGM mean was subtracted) at MD99-2334K (6) and MD07-3076Q (32) compared with the corresponding model δ18Ow anomalies. Open circles represent the raw data, shaded areas represent the estimated uncertainty based on average deviation of adjacent measurements, and dashed lines represent three-point smoothing (6). Global mean δ18Ow anomaly (gray) is converted from ice-volume equivalent sea level (45) by 1.05‰/145 m. (G) Same as F but for deep water temperature anomalies based on Mg/Ca measurements (6, 32). All dashed lines indicate proxies, and solid lines indicate model results. B-A, Bølling–Allerød; PDB, Pee Dee Belemnite standard; SMOW, standard mean ocean water; YD, Younger Dryas.
Fig. 2.
Fig. 2.
Atlantic total meridional overturning circulation at modern (A), glacial at 19 ka (B), and late HS1 at 16 ka (C). Total circulation, also known as residual circulation, is the sum of the Eulerian mean circulation and the circulation caused by mesoscale eddies (submesoscale eddies are ignored, since they are small and concentrated at surface layers) and is directly related to tracer transport. The Atlantic zonal mean potential densities (σθ) of each period are overlaid in black contours, with intervals of 0.1 kg m−3. Squares indicate the two cores sites of Fig. 1E.
Fig. 3.
Fig. 3.
Deglacial benthic δ18Oc changes in the Atlantic. Contours are zonally averaged Atlantic δ18Oc changes between late HS1 (16.3–14.8 ka mean) and glacial (20.5–19.0 ka mean) periods in the model. Circles and squares are reconstructed benthic δ18Oc changes at 31 independently dated core cites (SI Appendix, Table S2) between these two periods. Squares indicate the two cores sites of Fig. 1E.
Fig. 4.
Fig. 4.
(A–F) Atlantic zonally averaged δ18Ow (A, C, and E) and potential temperature (B, D, and F). Panels are variables at 19 ka (A and B), 16 ka (C and D), and their differences (E and F). Squares indicate the two core sites of Fig. 1E. Note that the color bar for B and D is nonlinear. The deep NA core site experiences reversed δ18Ow vertical gradient and enlarged temperature vertical gradient from 19 to 16 ka. (G and H) The δ18Ow differences between 16 and 19 ka of the two sensitivity experiments iPOP2-19ka and iPOP2-0ka (sharing the same color bar with E).
Fig. 5.
Fig. 5.
Hovmöller diagrams of tracer vertical profiles (A, C, E, and G) and tracer budget analysis (B, D, F, and H) for the 22- to 15-ka time interval. (A) Hovmöller diagram of area-averaged δ18Ow vertical profiles in the northern NA (>30° N). Black triangle indicates the depth at which the δ18Ow budget analysis is performed. (B) Time series of area-averaged δ18Ow budget terms (in 10−11 ‰ second−1) in this region at 3,133 m (corresponding to the MD99-2334K core depth), with positive values indicating δ18Ow gain. The zonal (green), meridional (purple), and vertical (blue) mean advective fluxes as well as the vertical (brown) and horizontal (red) mixing are plotted. (C and D) Same as A and B but for the 36° S to 46° S South Atlantic, and the budget analysis is performed at 3,628 m (corresponding to the MD07-3076Q core depth). (E–H) Same as A–D but for temperature profiles and heat budget terms (in 10−10 degrees Celsius second−1). Note that the color bars for E and G are nonlinear. NNA; Northern NA.

References

    1. Broecker WS. Paleocean circulation during the last deglaciation: A bipolar seesaw? Paleoceanography. 1998;13:119–121.
    1. Roberts NL, Piotrowski AM, McManus JF, Keigwin LD. Synchronous deglacial overturning and water mass source changes. Science. 2010;327:75–78. - PubMed
    1. McManus JF, Francois R, Gherardi J-M, Keigwin LD, Brown-Leger S. Collapse and rapid resumption of Atlantic meridional circulation linked to deglacial climate changes. Nature. 2004;428:834–837. - PubMed
    1. Shakun JD, et al. Global warming preceded by increasing carbon dioxide concentrations during the last deglaciation. Nature. 2012;484:49–54. - PubMed
    1. Skinner LC, Fallon S, Waelbroeck C, Michel E, Barker S. Ventilation of the deep Southern Ocean and deglacial CO2 rise. Science. 2010;328:1147–1151. - PubMed

Publication types

LinkOut - more resources