

3D Spatially Resolved Models of the Intracellular Dynamics of the Hepatitis C Genome Replication Cycle
- PMID: 28973992
- PMCID: PMC5691296
- DOI: 10.3390/v9100282
3D Spatially Resolved Models of the Intracellular Dynamics of the Hepatitis C Genome Replication Cycle
Abstract
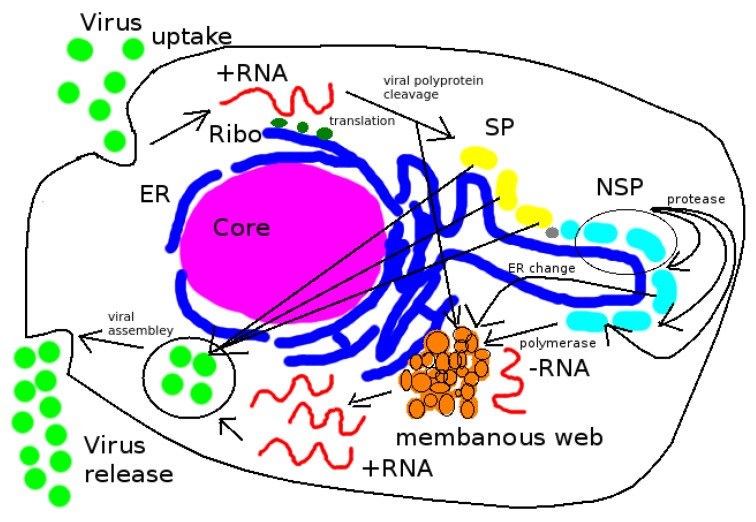
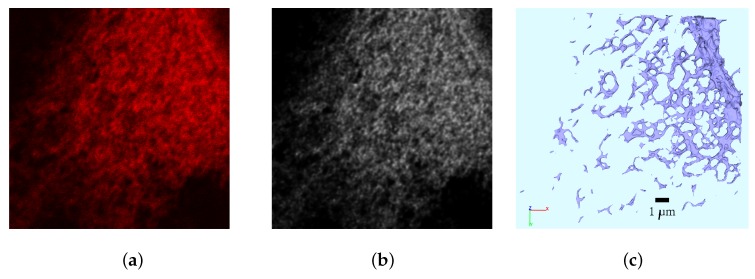
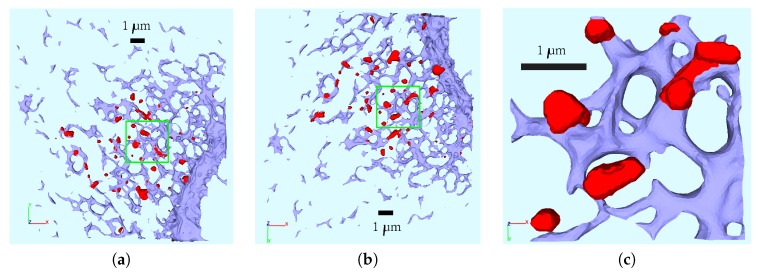
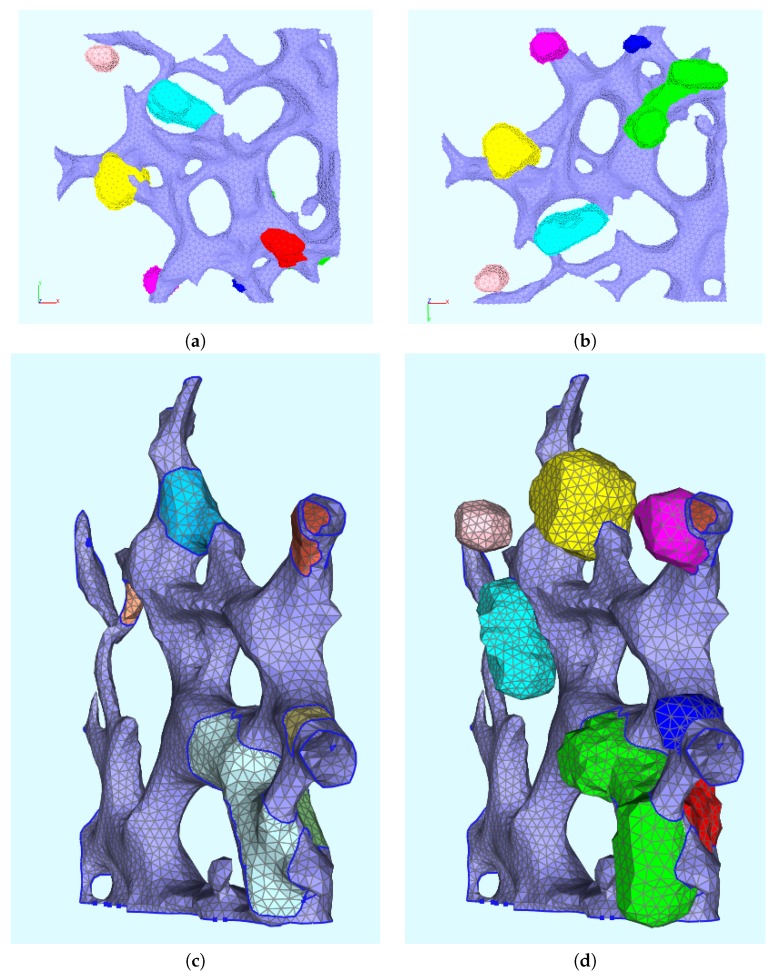
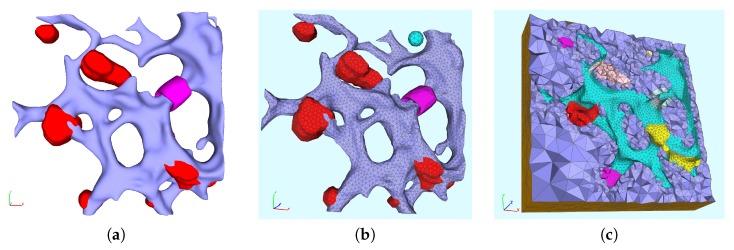
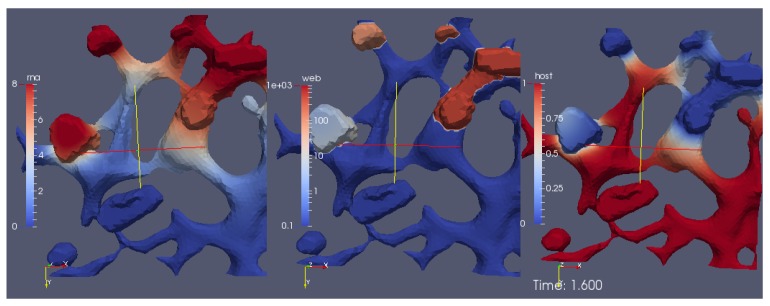
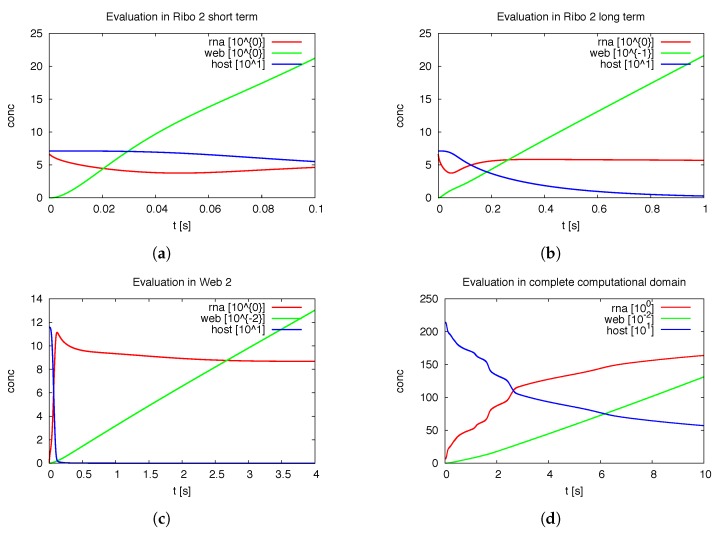
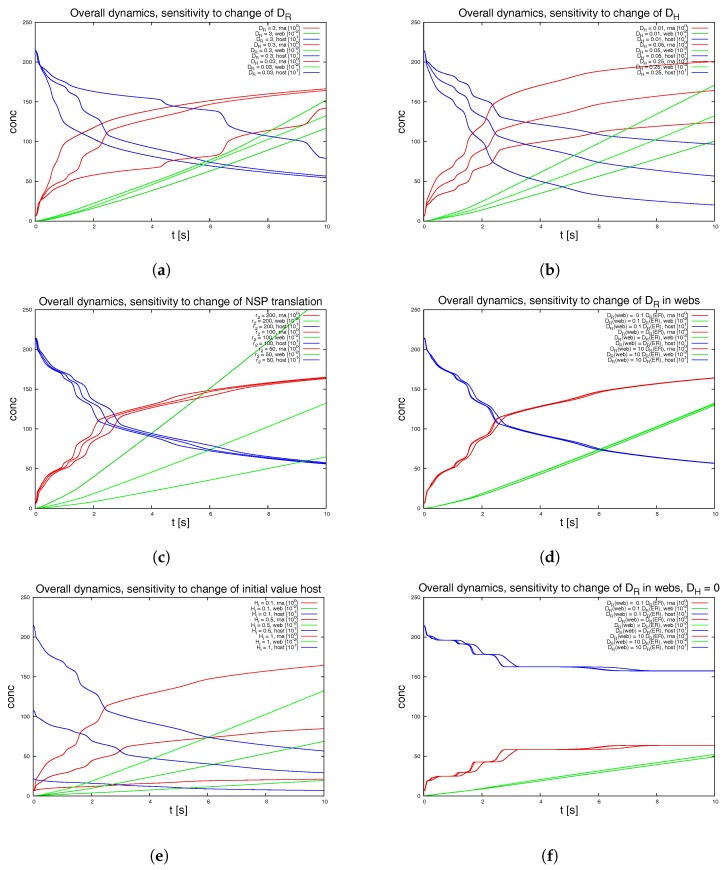
Mathematical models of virus dynamics have not previously acknowledged spatial resolution at the intracellular level despite substantial arguments that favor the consideration of intracellular spatial dependence. The replication of the hepatitis C virus (HCV) viral RNA (vRNA) occurs within special replication complexes formed from membranes derived from endoplasmatic reticulum (ER). These regions, termed membranous webs, are generated primarily through specific interactions between nonstructural virus-encoded proteins (NSPs) and host cellular factors. The NSPs are responsible for the replication of the vRNA and their movement is restricted to the ER surface. Therefore, in this study we developed fully spatio-temporal resolved models of the vRNA replication cycle of HCV. Our simulations are performed upon realistic reconstructed cell structures-namely the ER surface and the membranous webs-based on data derived from immunostained cells replicating HCV vRNA. We visualized 3D simulations that reproduced dynamics resulting from interplay of the different components of our models (vRNA, NSPs, and a host factor), and we present an evaluation of the concentrations for the components within different regions of the cell. Thus far, our model is restricted to an internal portion of a hepatocyte and is qualitative more than quantitative. For a quantitative adaption to complete cells, various additional parameters will have to be determined through further in vitro cell biology experiments, which can be stimulated by the results deccribed in the present study.
Keywords: (surface) partial differential equations; 3D spatio-temporal resolved mathematical models; Finite Volumes; computational virology; hepatitis C virus (HCV); massively parallel multigrid solvers; mathematical models of viral RNA cycle; realistic geometries; viral dynamics; within-host viral modelling.
Conflict of interest statement
The authors declare no conflict of interest. The founding sponsors had no role in the design of the study; in the collection, analyses, or interpretation of data; in the writing of the manuscript, and in the decision to publish the results.
Figures
Similar articles
-
Intracellular "In Silico Microscopes"-Comprehensive 3D Spatio-Temporal Virus Replication Model Simulations.Viruses. 2024 May 24;16(6):840. doi: 10.3390/v16060840. Viruses. 2024. PMID: 38932132 Free PMC article.
-
Quantitative Analysis of Hepatitis C NS5A Viral Protein Dynamics on the ER Surface.Viruses. 2018 Jan 8;10(1):28. doi: 10.3390/v10010028. Viruses. 2018. PMID: 29316722 Free PMC article.
-
Advanced Hepatitis C Virus Replication PDE Models within a Realistic Intracellular Geometric Environment.Int J Environ Res Public Health. 2019 Feb 12;16(3):513. doi: 10.3390/ijerph16030513. Int J Environ Res Public Health. 2019. PMID: 30759770 Free PMC article.
-
Cellular and molecular biology of HCV infection and hepatitis.Clin Sci (Lond). 2009 Jun 15;117(2):49-65. doi: 10.1042/CS20080631. Clin Sci (Lond). 2009. PMID: 19515018 Review.
-
In vitro replication models for the hepatitis C virus.J Viral Hepat. 2007 Jan;14(1):2-10. doi: 10.1111/j.1365-2893.2006.00807.x. J Viral Hepat. 2007. PMID: 17212638 Review.
Cited by
-
Intracellular "In Silico Microscopes"-Comprehensive 3D Spatio-Temporal Virus Replication Model Simulations.Viruses. 2024 May 24;16(6):840. doi: 10.3390/v16060840. Viruses. 2024. PMID: 38932132 Free PMC article.
-
Quantitative Analysis of Hepatitis C NS5A Viral Protein Dynamics on the ER Surface.Viruses. 2018 Jan 8;10(1):28. doi: 10.3390/v10010028. Viruses. 2018. PMID: 29316722 Free PMC article.
-
Efficient Estimates of Surface Diffusion Parameters for Spatio-Temporally Resolved Virus Replication Dynamics.Int J Mol Sci. 2024 Mar 5;25(5):2993. doi: 10.3390/ijms25052993. Int J Mol Sci. 2024. PMID: 38474240 Free PMC article.
-
Advanced Hepatitis C Virus Replication PDE Models within a Realistic Intracellular Geometric Environment.Int J Environ Res Public Health. 2019 Feb 12;16(3):513. doi: 10.3390/ijerph16030513. Int J Environ Res Public Health. 2019. PMID: 30759770 Free PMC article.
-
Lyapunov function and global asymptotic stability for a new multiscale viral dynamics model incorporating the immune system response: Implemented upon HCV.PLoS One. 2021 Oct 12;16(10):e0257975. doi: 10.1371/journal.pone.0257975. eCollection 2021. PLoS One. 2021. PMID: 34637445 Free PMC article.
References
-
- Romero-Brey I., Merz A., Chiramel A., Lee J., Chlanda P., Haselman U., Santarella-Mellwig R., Habermann A., Hoppe S., Kallis S., et al. Three-dimensional architecture and biogenesis of membrane structures associated with hepatitis C virus replication. PLoS Pathog. 2012;8:e1003056. doi: 10.1371/journal.ppat.1003056. - DOI - PMC - PubMed
MeSH terms
Substances
LinkOut - more resources
Full Text Sources
Other Literature Sources
