

Weekday snacking prevalence, frequency, and energy contribution have increased while foods consumed during snacking have shifted among Australian children and adolescents: 1995, 2007 and 2011-12 National Nutrition Surveys
- PMID: 28974206
- PMCID: PMC5627470
- DOI: 10.1186/s12937-017-0288-8
Weekday snacking prevalence, frequency, and energy contribution have increased while foods consumed during snacking have shifted among Australian children and adolescents: 1995, 2007 and 2011-12 National Nutrition Surveys
Abstract
Background: There are limited data on the evolution of eating habits, including snacking, in Australia. This study aimed to understand snacking trends among Australian children over three previous National Nutrition Surveys.
Methods: Data were analysed from a single weekday 24-h recall in the National Nutrition Surveys 1995, 2007, 2011-12 among children 2-16y (n = 8258). A snacking occasion was defined as an eating occasion that occurred between meals based on time of day.
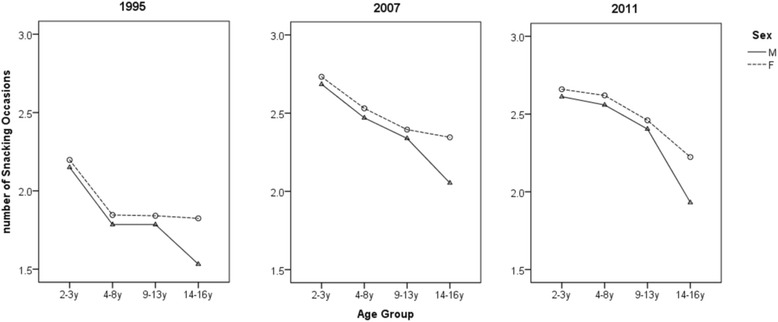
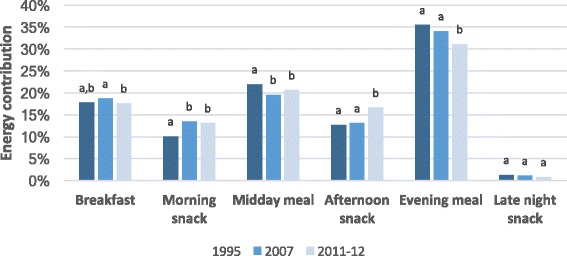
Results: The percentage of children snacking increased over time (92.5 ± 0.5(SE) % in 1995, 98.1 ± 0.3% in 2007, and 95.8 ± 0.4% in 2011-12) (P < 0.001), particularly among those having four or more snacking occasions (7.1 ± 0.5% in 1995, 17.9 ± 0.6% in 2007, and 18.5 ± 0.8% in 2011-2) (P < 0.001). The mean number of snacking occasions increased from 2.0 ± 0.0 in 1995, to 2.5 ± 0.0 in 2007 and 2011-12 (P < 0.001). The energy contribution from snacking increased from 24.1 ± 0.3% in 1995 to 27.7 ± 0.3% in 2007 and 30.5 ± 0.4% in 2011-12 (P < 0.001), while the energy from discretionary food during snacking decreased from 56.5 ± 0.7% in 1995 to 47.3 ± 0.5% in 2007 and 47.9 ± 0.7% in 2011-12 (P < 0.001). There were differences in the top foods consumed during snacking: non-alcoholic beverages were prominent contributors in 1995 but not in 2007 or 2011, and pome fruit was the second top energy contributor during snacking in 2007 and 2011 but only fourth in 1995.
Conclusions: Snacking is a prominent dietary pattern that has increased over time in frequency and energy contribution. Foods and beverages consumed during snacking occasions include a mix of core foods and discretionary foods, and while the contribution of discretionary foods has decreased, there is still an opportunity to encourage consumption of more nutrient dense foods during snacking.
Keywords: Dietary pattern; Nutrition survey; Snack; Snacking; Trends.
Conflict of interest statement
Ethics approval and consent to participate
The interview components of the 1995 and 2011–12 were conducted under the Census and Statistics Act 1905. Ethics approval was not necessary for those surveys. In 2007, ethics approval was obtained from the National Health and Medical Research Council registered Ethics Committees of the Commonwealth Scientific and Industrial Research Organisation and the University of South Australia.
Consent for publication
Not applicable.
Competing interests
FFM, AM, and PP declare that they have no competing interests. VP and ALE are employed by the funding body.
Publisher’s Note
Springer Nature remains neutral with regard to jurisdictional claims in published maps and institutional affiliations.
Figures
References
-
- World Health Organisation . Interim Report of the Commission on Ending Childhood Obesity. Geneva: WHO; 2015.
-
- Australian Bureau of Statistics. Australian Health Survey: First results, 2014–15. ABS, Canberra, 2015.
-
- Australian Bureau of Statistics. Profiles of Health, Australia, 2011–13: Children's risk factors. ABS, Canberra, 2013.
MeSH terms
LinkOut - more resources
Full Text Sources
Other Literature Sources
