. 2017 Oct 4;15(1):175.
doi: 10.1186/s12916-017-0937-y.

The risk of type 2 oral polio vaccine use in post-cessation outbreak response

Affiliations

The risk of type 2 oral polio vaccine use in post-cessation outbreak response

Kevin A McCarthy et al. BMC Med. .

Abstract

Background: Wild type 2 poliovirus was last observed in 1999. The Sabin-strain oral polio vaccine type 2 (OPV2) was critical to eradication, but it is known to revert to a neurovirulent phenotype, causing vaccine-associated paralytic poliomyelitis. OPV2 is also transmissible and can establish circulating lineages, called circulating vaccine-derived polioviruses (cVDPVs), which can also cause paralytic outbreaks. Thus, in April 2016, OPV2 was removed from immunization activities worldwide. Interrupting transmission of cVDPV2 lineages that survive cessation will require OPV2 in outbreak response, which risks seeding new cVDPVs. This potential cascade of outbreak responses seeding VDPVs, necessitating further outbreak responses, presents a critical risk to the OPV2 cessation effort.

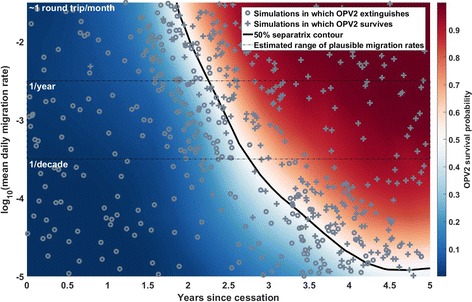
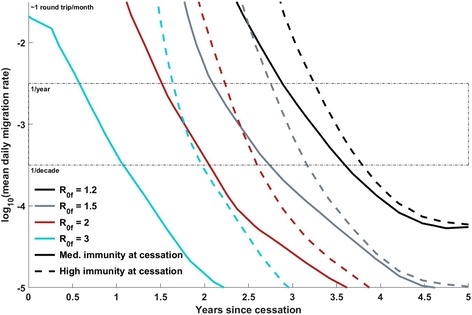
Methods: The EMOD individual-based disease transmission model was used to investigate OPV2 use in outbreak response post-cessation in West African populations. A hypothetical outbreak response in northwest Nigeria is modeled, and a cVDPV2 lineage is considered established if the Sabin strain escapes the response region and continues circulating 9 months post-response. The probability of this event was investigated in a variety of possible scenarios.

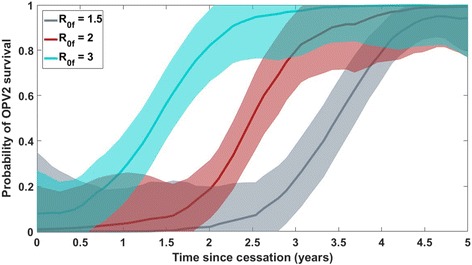
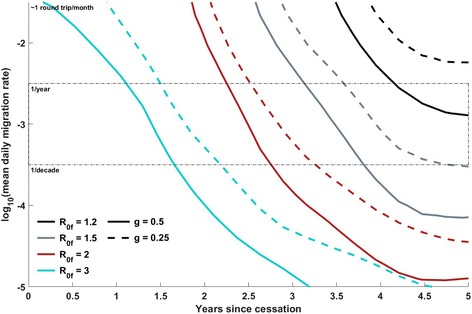
Results: Under a broad range of scenarios, the probability that widespread OPV2 use in outbreak response (~2 million doses) establishes new cVDPV2 lineages in this model may exceed 50% as soon as 18 months or as late as 4 years post-cessation.

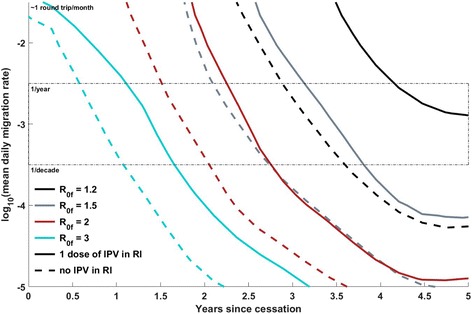
Conclusions: The risk of a cycle in which outbreak responses seed new cVDPV2 lineages suggests that OPV2 use should be managed carefully as time from cessation increases. It is unclear whether this risk can be mitigated in the long term, as mucosal immunity against type 2 poliovirus declines globally. Therefore, current programmatic strategies should aim to minimize the possibility that continued OPV2 use will be necessary in future years: conducting rapid and aggressive outbreak responses where cVDPV2 lineages are discovered, maintaining high-quality surveillance in all high-risk settings, strengthening the use of the inactivated polio vaccine as a booster in the OPV2-exposed and in routine immunization, and gaining access to currently inaccessible areas of the world to conduct surveillance.

Keywords: Cessation; Eradication; Oral polio vaccine; Poliovirus; Vaccine-derived poliovirus.


Conflict of interest statement

Ethics approval and consent to participate

Permission for access to the POLIS case and campaign databases and the use of WHO shapefiles was granted to the Institute for Disease Modeling researchers through the World Health Organization.

Consent for publication

Not applicable.

Competing interests

The authors declare that they have no competing interests.

Publisher’s Note

Springer Nature remains neutral with regard to jurisdictional claims in published maps and institutional affiliations.

Figures

Fig. 1
Fig. 1
Example output from a single separatrix scenario, with R 0f = 2.0, g = 0.5, λ = 60 days, N IPV = 1, c = 1. The colored surface represents the inferred probability that the OPV2 used in outbreak response continues to circulate, outside of the response region, 9 months after the final response campaign; in blue regions, the OPV2 deployed in outbreak response is likely to fail to establish long-term circulation, and in the red regions, the OPV is more likely to successfully export from the response region and survive for 9 months in simulation. The black solid line represents the parameter contour along which this survival probability is 50%. Gray crosses represent individual simulations in which this exportation and survival outcome occurs, and gray circles represent those in which it does not. The thin black dashed box indicates migration rates that are preferred by a calibration to a single traveling WPV1 outbreak in the region, in 2008. The y-axis, mean daily migration rate, is the average rate at which any simulated individual leaves their home province to visit another province; all migration is round trip with a mean trip duration of 1 day. The distribution of simulated points illustrates the behavior of the algorithm; the first round of the Separatrix algorithm broadly explores the space, and the second concentrates simulations around the contour of interest
Fig. 2
Fig. 2
Estimated probability with uncertainty of OPV2 survival for R 0f = 1.5 (gray), 2.0 (red), and 3.0 (cyan), vs. the time since cessation, at a fixed value of 0.001 for the mean per-person, per-day migration rate (or y = –3 on the log-space y-axes in Figs. 1, 3, 4, and 5). The red line and corresponding uncertainty band correspond to the estimated probability of OPV2 survival along a slice at y = –3 through the colored separatrix surface presented in Fig. 1; the cyan and gray areas represent the same quantity for simulated scenarios run with different values of the final VDPV infectivity. The other scenario parameters are set to g = 0.5, λ = 60 days, N IPV = 1, c = 1. The uncertainty bands represent uncertainty on the estimated probability of the OPV2 survival outcome at a given point in parameter space and do not incorporate uncertainty in the simulation input parameters themselves or other extrinsic sources of uncertainty
Fig. 3
Fig. 3
Position of the 50% separatrix line as the R 0 profile of OPV2 varies, at constant λ = 60 days, N IPV = 1, c = 1. Each separatrix line, for a given scenario, divides the region of parameter space in which OPV2 survival is estimated to be < 50% probable from the region in which OPV2 survival is estimated to be > 50% probable. The “less probable” region is always the region left and below the separatrix line (that is, less connectivity or less time since cessation reduces the probability of survival), and the “more probable” region for a given scenario is above and to the right of the corresponding separatrix line. The solid and dashed lines, respectively, indicate g = 0.5 and g = 0.25, while the cyan, red, gray, and black lines, respectively, indicate R 0f values of 3, 2, 1.5, and 1.2. The thin black dashed box indicates migration rates that are preferred by a calibration to a single traveling WPV1 outbreak in the region, in 2008. The final R 0 is observed to have the dominant effect, with the risk at a given time point and migration rate decreasing with R 0f as expected. The initial R 0 multiplier has a comparatively small effect, but a lower initial R 0 does also mitigate the survival risk
Fig. 4
Fig. 4
Position of the 50% separatrix line as number of IPV doses in routine immunization varies, at constant λ = 60 days, g = 0.5, c = 1. The dashed and solid lines, respectively, indicate N IPV = 0 or 1, and the cyan, red, gray, and black lines, respectively, indicate R 0f values of 3, 2, 1.5, and 1.2. The thin black dashed box indicates migration rates that are preferred by a calibration to a single traveling WPV1 outbreak in the region, in 2008. Under the assumptions made in this model regarding the population-level effects of IPV dosing, an additional dose of IPV in routine immunization in the cohort born after cessation provides a strong mitigating effect on the risk of OPV2 survival and circulation at low R 0; the mitigating effect declines as the R 0 of the reverted virus increases
Fig. 5
Fig. 5
Dependence of the position of the 50% separatrix line on immunity levels in the cohort of children born before cessation: 100% immunity (dashed lines) vs. immunity induced by three rounds of OPV at 80% coverage, 50% take (solid lines). All lines at constant g = 0.5, N IPV = 1, c = 1, λ = 60 days. The cyan, red, gray, and black lines, respectively, indicate R 0f values of 3, 2, 1.5, and 1.2. The final R 0 is observed to have the dominant effect. The thin black dashed box indicates migration rates that are preferred by a calibration to a single traveling WPV1 outbreak in the region, in 2008. The effect of increasing immunity in the older cohort is largest at higher R 0, as higher R 0 facilitates more transmission through partially immune older children. However, the additional protection is somewhat modest (considering the extreme assumption of perfect immunity in all children born pre-cessation), indicating that the cohort of children born post-cessation rapidly becomes a dominant contributor to OPV2 transmission in this model

Comment in

References

    1. Garon J, Seib K, Orenstein WA, Gonzalez AR, Blanc DC, Zaffran M, Patel M. Polio endgame: the global switch from tOPV to bOPV. Expert Review of Vaccines. 2016;15(6):693–708. - PubMed
    1. World Health Organization. Global eradication of wild poliovirus type 2 declared. 2015. https://web.archive.org/web/20160802182045/http://www.polioeradication.org/mediaroom/newsstories/Global-eradication.... Accessed 2 Aug 2016.
    1. Jenkins HE, Aylward RB, Gasasira A, Donnelly CA, Mwanza M, Corander J, et al. Implications of a circulating vaccine-derived poliovirus in Nigeria. N Engl J Med. 2010;362:2360–9. doi: 10.1056/NEJMoa0910074. - DOI - PubMed
    1. Rakoto-Andrianarivelo M, Gumede N, Jegouic S, Balanant J, Andriamamonjy SN, Rabemanantsoa S, et al. Reemergence of recombinant vaccine-derived poliovirus outbreak in Madagascar. J Infect Dis. 2008;197:1427–35. doi: 10.1086/587694. - DOI - PubMed
    1. Yang C-F, Naguib T, Yang S-J, Nasr E, Jorba J, Ahmed N, et al. Circulation of endemic type 2 vaccine-derived poliovirus in Egypt from 1983 to 1993. J Virol. 2003;77:8366–77. doi: 10.1128/JVI.77.15.8366-8377.2003. - DOI - PMC - PubMed

MeSH terms

Substances