. 2017 Oct 4;5(1):129.
doi: 10.1186/s40168-017-0345-8.

Preparing for the crewed Mars journey: microbiota dynamics in the confined Mars500 habitat during simulated Mars flight and landing

Affiliations

Preparing for the crewed Mars journey: microbiota dynamics in the confined Mars500 habitat during simulated Mars flight and landing

Petra Schwendner et al. Microbiome. .

Abstract

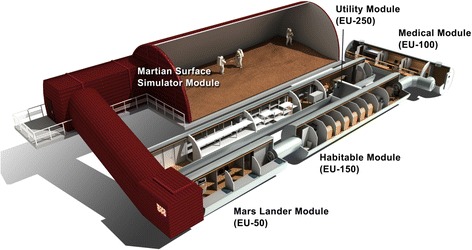
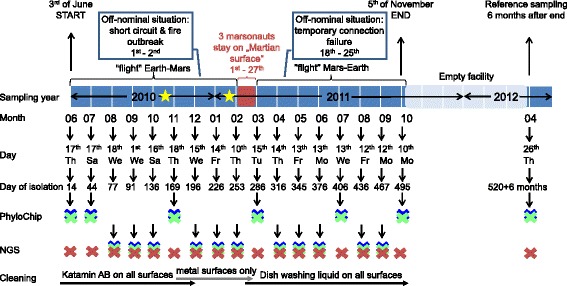
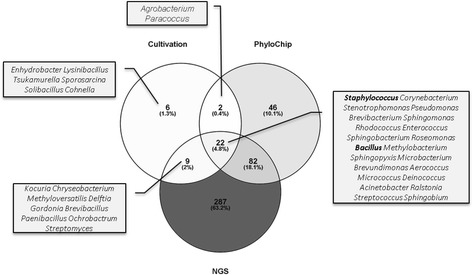
Background: The Mars500 project was conceived as the first full duration simulation of a crewed return flight to Mars. For 520 days, six crew members lived confined in a specifically designed spacecraft mock-up. The herein described "MIcrobial ecology of Confined Habitats and humAn health" (MICHA) experiment was implemented to acquire comprehensive microbiota data from this unique, confined manned habitat, to retrieve important information on the occurring microbiota dynamics, the microbial load and diversity in the air and on various surfaces. In total, 360 samples from 20 (9 air, 11 surface) locations were taken at 18 time-points and processed by extensive cultivation, PhyloChip and next generation sequencing (NGS) of 16S rRNA gene amplicons.

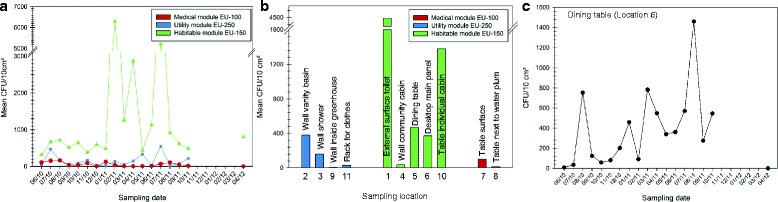
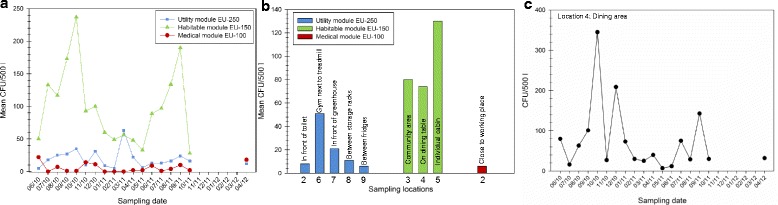
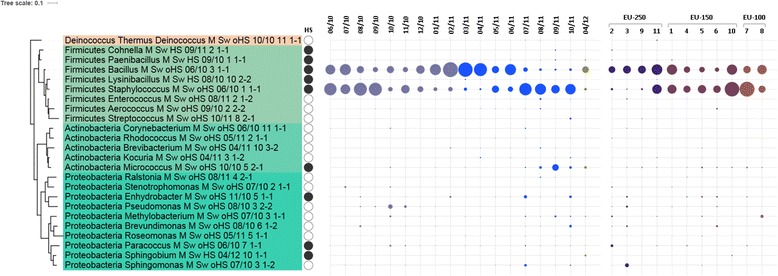
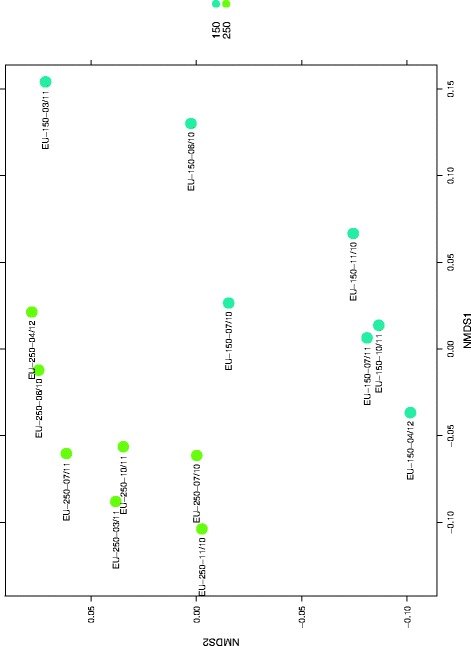
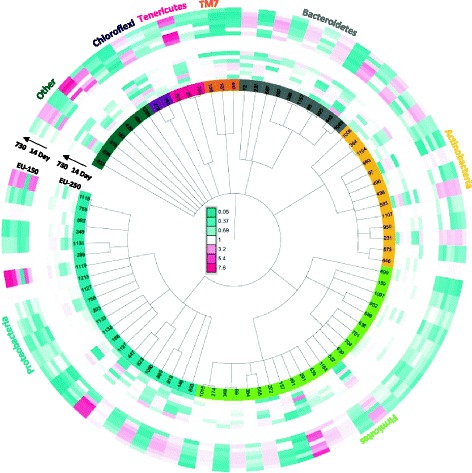
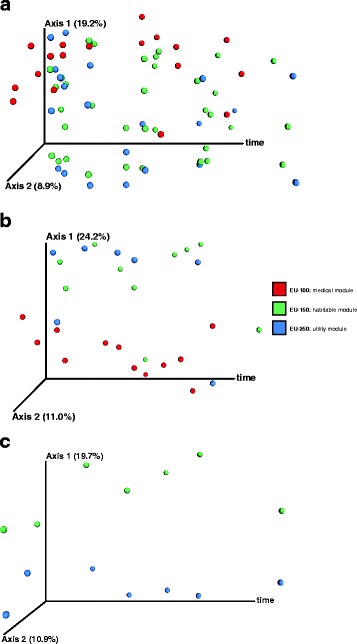
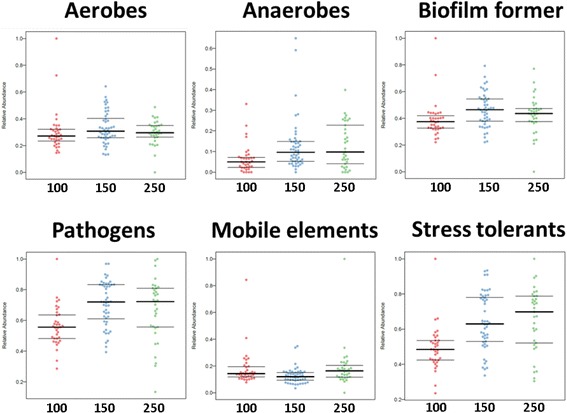
Results: Cultivation assays revealed a Staphylococcus and Bacillus-dominated microbial community on various surfaces, with an average microbial load that did not exceed the allowed limits for ISS in-flight requirements indicating adequate maintenance of the facility. Areas with high human activity were identified as hotspots for microbial accumulation. Despite substantial fluctuation with respect to microbial diversity and abundance throughout the experiment, the location within the facility and the confinement duration were identified as factors significantly shaping the microbial diversity and composition, with the crew representing the main source for microbial dispersal. Opportunistic pathogens, stress-tolerant or potentially mobile element-bearing microorganisms were predicted to be prevalent throughout the confinement, while the overall microbial diversity dropped significantly over time.

Conclusions: Our findings clearly indicate that under confined conditions, the community structure remains a highly dynamic system which adapts to the prevailing habitat and micro-conditions. Since a sterile environment is not achievable, these dynamics need to be monitored to avoid spreading of highly resistant or potentially pathogenic microorganisms and a potentially harmful decrease of microbial diversity. If necessary, countermeasures are required, to maintain a healthy, diverse balance of beneficial, neutral and opportunistic pathogenic microorganisms. Our results serve as an important data collection for (i) future risk estimations of crewed space flight, (ii) an optimized design and planning of a spacecraft mission and (iii) for the selection of appropriate microbial monitoring approaches and potential countermeasures, to ensure a microbiologically safe space-flight environment.

Keywords: Built environment; Mars flight simulation; Mars500; Microbiota.


Conflict of interest statement

Ethics approval and consent to participate

Not applicable.

Consent for publication

Not applicable.

Competing interests

The authors declare that they have no competing interests.

Publisher’s Note

Springer Nature remains neutral with regard to jurisdictional claims in published maps and institutional affiliations.

Figures

Fig. 1
Fig. 1
Illustration of the medical-technical facility (Mars500 Habitat) at the Institute for Biomedical Problems in Russia, Moscow, with its four experimental unit modules and the simulated Martian surface (SMS) module. © Adrian Mann/bisbos.com (approved)
Fig. 2
Fig. 2
Timeline of the Mars500 experiment from the beginning (3rd of June, 2010) until the end (5th of November, 2011). The schematic drawing also indicates important steps and events during the confinement (above timeline) including the two off-nominal situations (critical situation simulations) and sampling dates from 18 sampling events. Red area/font denotes the stay of three marsonauts in the simulated Martian surface complex, whereas light blue area represents the timeframe where the facility was untenanted. One reference sampling was performed 6 months after confinement. Crosses represent samples that were used for PhyloChip analyses or NGS, respectively. Samples from each sampling were subjected to cultivation experiments. Red: medical module EU-100; green: habitable module EU-150; blue: utility module EU-250. Yellow stars indicate changing of NANO-filters and cleaning events of the primary filters on day 162 (11th of November, 2010) and 243 (2nd of February, 2011) of isolation
Fig. 3
Fig. 3
CFUs per 10 cm2 surface, appearing on R2A after 72 h incubation at 32 °C. a Mean CFU values (y-axis), whereas different sampling locations within one module were grouped for each sampling event (x-axis). b The mean CFU values (y-axis) of all sampling events for each sampling location (x-axis). c The CFU values (y-axis) from a representative sample location (dining table, location 6) for each sampling event (x-axis)
Fig. 4
Fig. 4
CFUs retrieved from 500 l air, appearing on R2A after 72 h incubation at 32 °C. a Mean CFU values (y-axis), whereas different sampling locations within one module were grouped for each sampling event (x-axis). b The mean CFU values (y-axis) of all sampling events for each sampling location (x-axis). c The CFU values (y-axis) from a representative sample location (dining area, location 4) for each sampling event (x-axis)
Fig. 5
Fig. 5
Isolates from surfaces, only those that appeared at least with three CFUs; filled circles next to the isolate names indicate survival of heat shock (representatives of this genus were found to survive this treatment). The number of isolates retrieved is visualized by the size of the dots; respective appearance was ordered according to time point of sampling (different colours reflect time before landing and after; reference sampling in 04/12) and location. Figure was prepared via iTol [126]
Fig. 6
Fig. 6
NMDS based on Bray-Curtis distance between samples based on the abundance of 1125 eOTUs present in at least one sample, stress = 0.1417
Fig. 7
Fig. 7
Interactive Tree Of Life (iTOL) based on 16S rRNA genes of 82 eOTUs that are significantly different (p values < 0.05) when comparing module EU-250 samples (inner rings) and module EU-150 samples (outer rings) [126]. The colour saturation indicates the degree of difference from the mean EU-250 value. Each layer of the two rings indicates a sampling time-point, with the earliest samplings closer to the centre of the tree
Fig. 8
Fig. 8
PCoA plot based on Bray-Curtis distances per module over time. X-axis refers to day of isolation. Medical module EU-100 is displayed in red, habitable module EU-150 is shown in green and the utility module EU-250 is highlighted in blue. a NGS dataset showing all samples. b NGS dataset showing only samples pooled per module and sampling event. c PhyloChip dataset of pooled samples per module EU-150 and EU-250 at different sampling events than NGS
Fig. 9
Fig. 9
VENN diagram of all detected bacterial genera. For the diagram, all detected genera with a complete taxonomic classification were included (400 for NGS, 152 for PhyloChip and 39 for cultivation). The Venn diagram was prepared using Venny [127]
Fig. 10
Fig. 10
BugBase analyses, based on the NGS dataset. Outcome is grouped according the modules (x-axis). The relative abundance is given on the y-axis. “Mobile elements” refers to bacteria, most probably carrying mobile elements. Outcome is grouped according the modules EU-100 (“100”), EU-150 (“150”) and EU-250 (“250”; x-axis)

Similar articles

Cited by

References

    1. Gagarin YA, Lebedev VI. Survival in space. New York: F.A. Praeger; 1969.
    1. Heppener M. Spaceward ho! The future of humans in space. EMBO reports. 2008;doi:10.1038/embor.2008.98. - PMC - PubMed
    1. Manned Exploration Requirements and Considerations . Advanced Studies Office, Engineering and Development Directorate. Houston, Texas: NASA Manned Spacecraft Center; 1971. pp. 1–8.
    1. Sender R, Fuchs S, Milo R. Revised estimates for the number of human and bacteria cells in the body. PLoS Biol. 2016;14:e1002533. doi: 10.1371/journal.pbio.1002533. - DOI - PMC - PubMed
    1. Meadow JF, Altrichter AE, Bateman AC, Stenson J, Brown G, Green JL, Bohannan BJM. Humans differ in their personal microbial cloud. PeerJ. 2015;3:e1258. doi: 10.7717/peerj.1258. - DOI - PMC - PubMed

Publication types

Substances

LinkOut - more resources