. 2017 Nov 21;136(21):2037-2050.
doi: 10.1161/CIRCULATIONAHA.117.028202. Epub 2017 Oct 3.

Delayed Repolarization Underlies Ventricular Arrhythmias in Rats With Heart Failure and Preserved Ejection Fraction

Affiliations

Delayed Repolarization Underlies Ventricular Arrhythmias in Rats With Heart Failure and Preserved Ejection Fraction

Jae Hyung Cho et al. Circulation. .

Abstract

Background: Heart failure with preserved ejection fraction (HFpEF) represents approximately half of heart failure, and its incidence continues to increase. The leading cause of mortality in HFpEF is sudden death, but little is known about the underlying mechanisms.

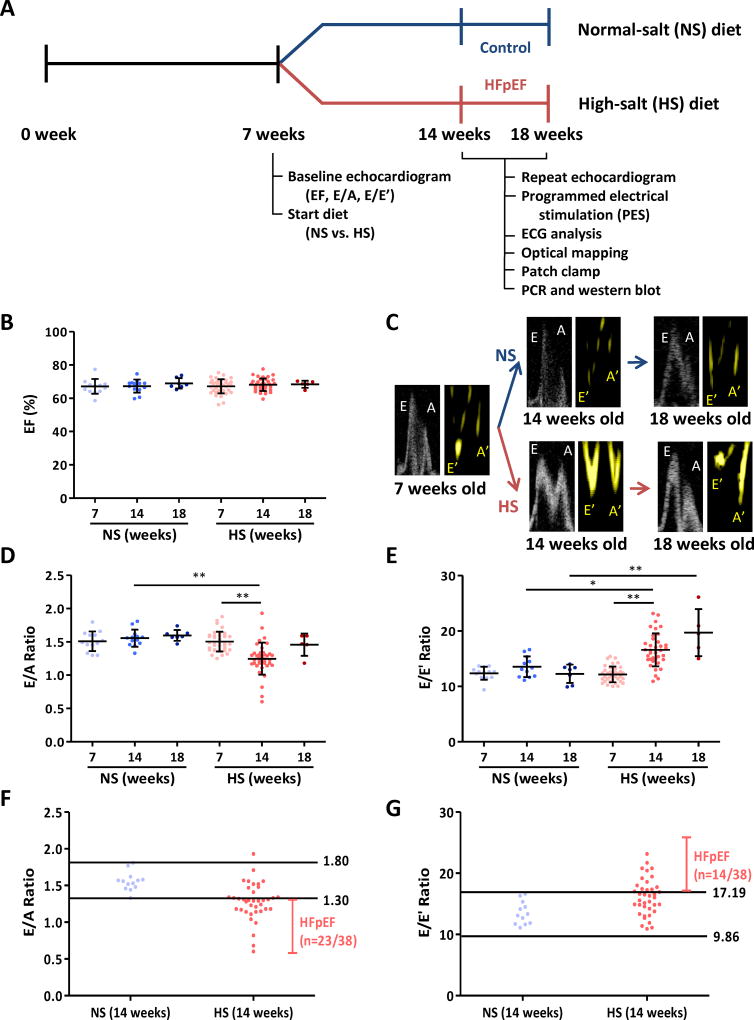
Methods: Dahl salt-sensitive rats were fed a high-salt diet (8% NaCl) from 7 weeks of age to induce HFpEF (n=38). Rats fed a normal-salt diet (0.3% NaCl) served as controls (n=13). Echocardiograms were performed to assess systolic and diastolic function from 14 weeks of age. HFpEF-verified and control rats underwent programmed electrical stimulation. Corrected QT interval was measured by surface ECG. The mechanisms of ventricular arrhythmias (VA) were probed by optical mapping, whole-cell patch clamp to measure action potential duration and ionic currents, and quantitative polymerase chain reaction and Western blotting to investigate changes in ion channel expression.

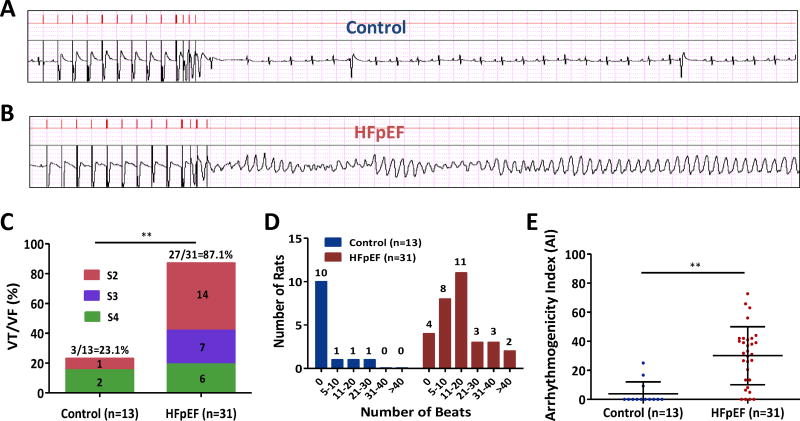
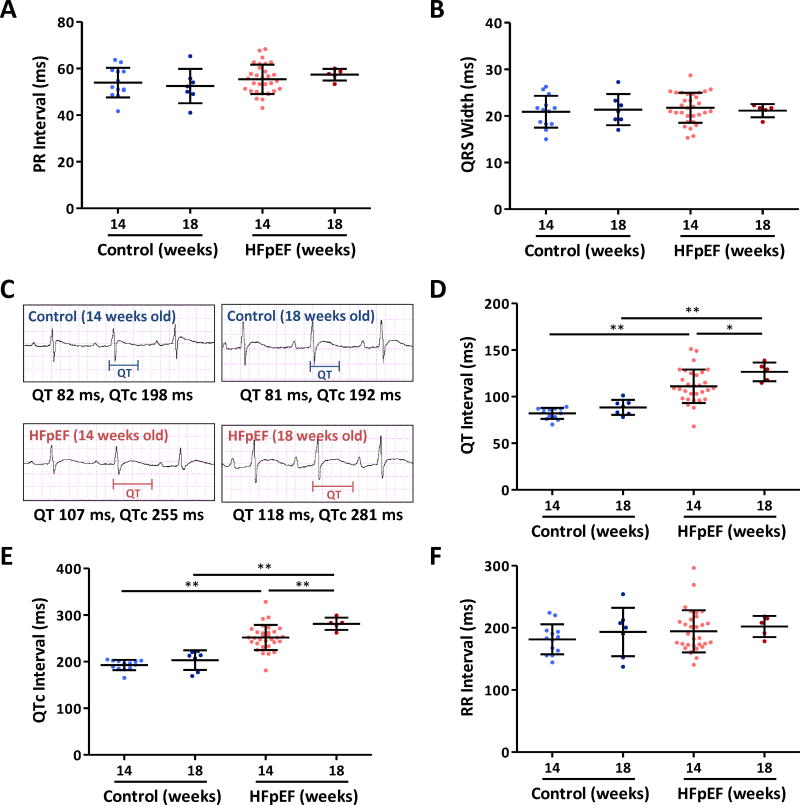
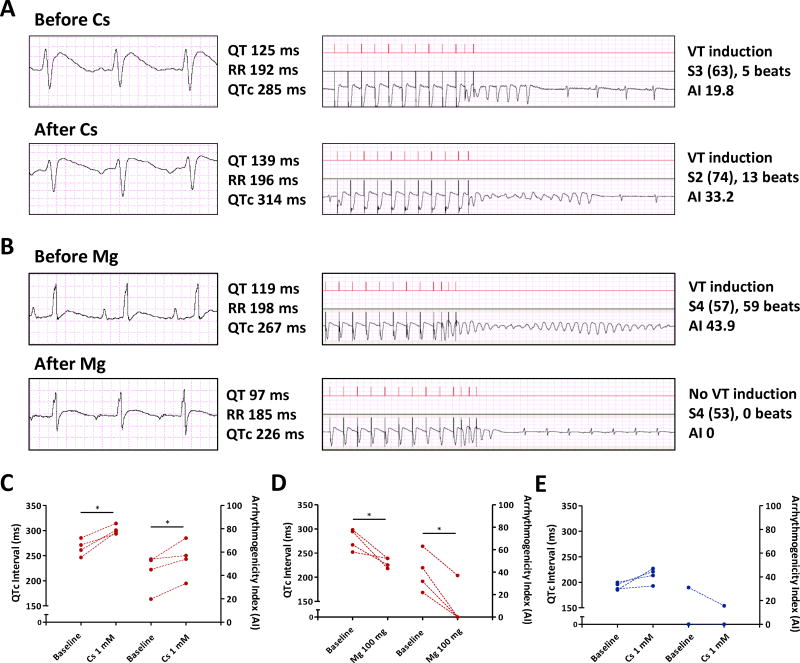
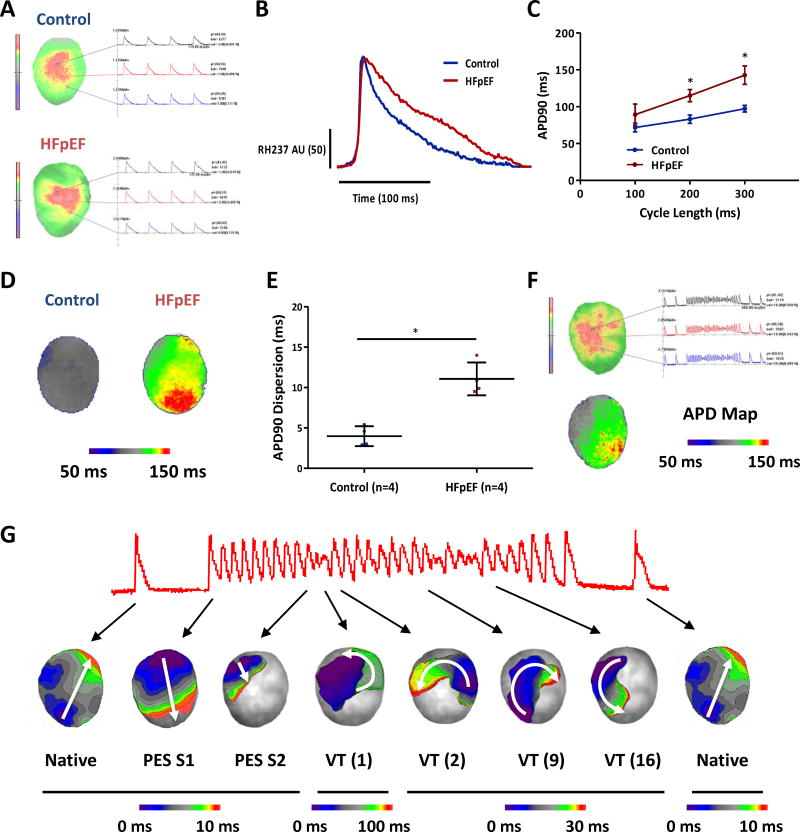
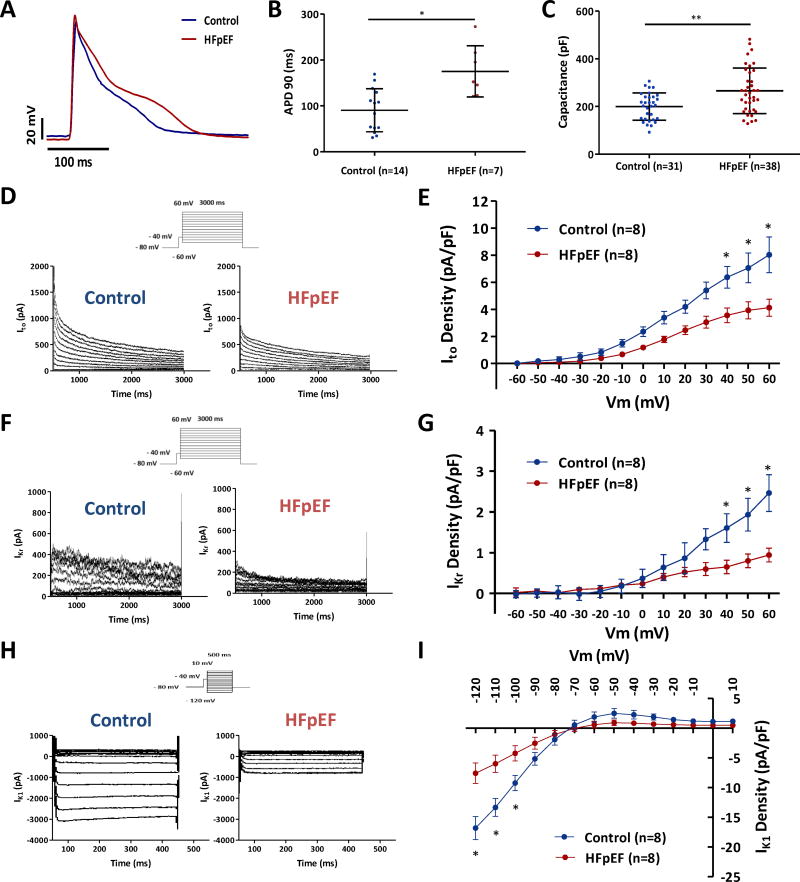
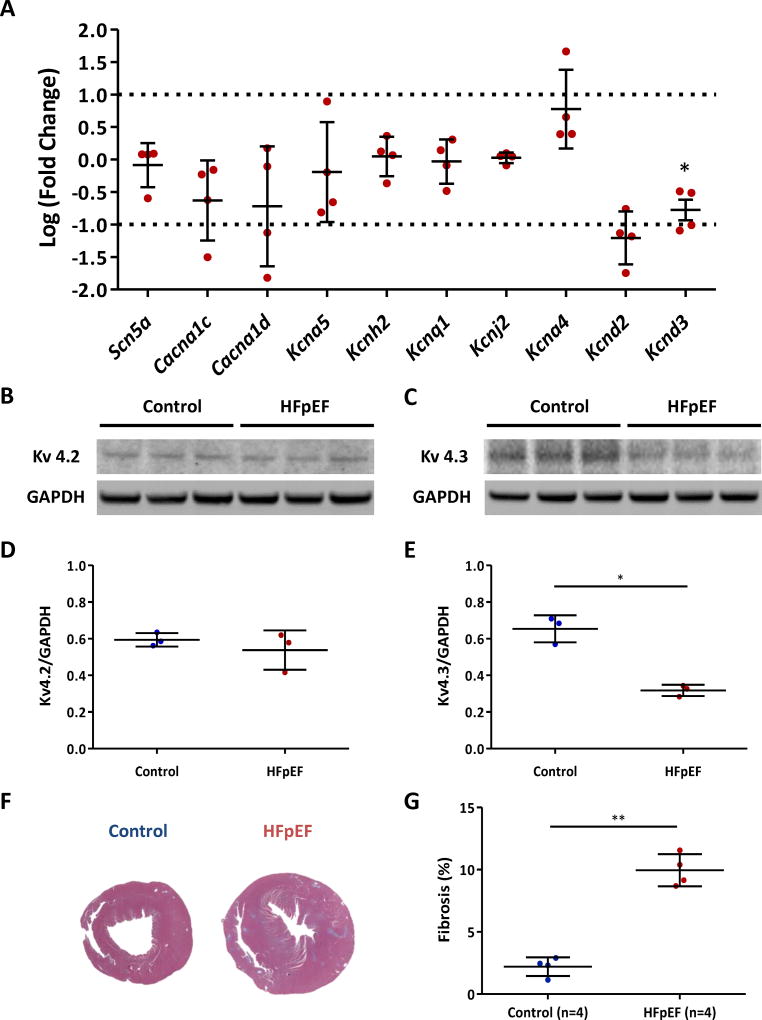
Results: After 7 weeks of a high-salt diet, 31 of 38 rats showed diastolic dysfunction and preserved ejection fraction along with signs of heart failure and hence were diagnosed with HFpEF. Programmed electric stimulation demonstrated increased susceptibility to VA in HFpEF rats (P<0.001 versus controls). The arrhythmogenicity index was increased (P<0.001) and the corrected QT interval on ECG was prolonged (P<0.001) in HFpEF rats. Optical mapping of HFpEF hearts demonstrated prolonged action potentials (P<0.05) and multiple reentry circuits during induced VA. Single-cell recordings of cardiomyocytes isolated from HFpEF rats confirmed a delay of repolarization (P=0.001) and revealed downregulation of transient outward potassium current (Ito; P<0.05). The rapid components of the delayed rectifier potassium current (IKr) and the inward rectifier potassium current (IK1) were also downregulated (P<0.05), but the current densities were much lower than for Ito. In accordance with the reduction of Ito, both Kcnd3 transcript and Kv4.3 protein levels were decreased in HFpEF rat hearts.

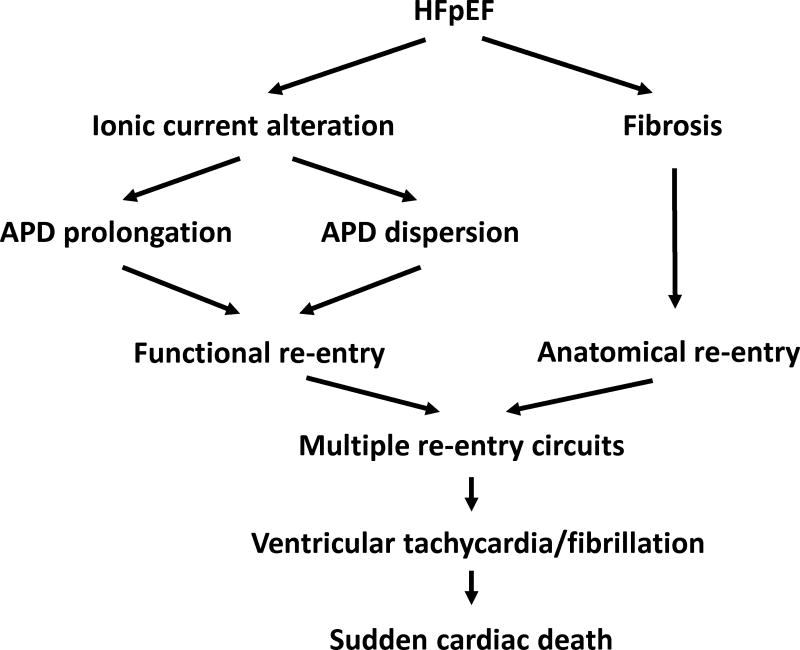
Conclusions: Susceptibility to VA was markedly increased in rats with HFpEF. Underlying abnormalities include QT prolongation, delayed repolarization from downregulation of potassium currents, and multiple reentry circuits during VA. Our findings are consistent with the hypothesis that potassium current downregulation leads to abnormal repolarization in HFpEF, which in turn predisposes to VA and sudden cardiac death.

Keywords: action potentials; arrhythmias, cardiac; death, sudden; fibrosis; heart failure; patch-clamp techniques; potassium channels.


Figures

Figure 1
Figure 1. Timeline of experiments and echocardiographic parameters of systolic and diastolic function
A. Dahl salt-sensitive (DSS) rats were fed high-salt (HS, n=38) and normal-salt (NS, n=13) diet at 7 weeks of age after baseline echocardiography for ejection fraction (EF) as a systolic parameter and E/A and E/E’ ratios as diastolic markers. Repeat echocardiogram was performed at 14 weeks of age. For control and HFpEF rats 14–18 weeks of age, we performed programmed electrical stimulation (PES), ECG analysis, optical mapping, patch clamp, RT-PCR and western blot. B. EF was equivalent at baseline (7 weeks) in NS and HS rats (n=13 and 38 respectively), nor did it differ in follow up in the various groups (n=13 and 38 respectively at 14 weeks, n=7 and 5 respectively at 18 weeks). C. Representative pulse wave Doppler showing E (early filling) and A (atrial filling) wave changes and tissue Doppler describing E’ and A’ wave changes in NS and HS rats at 14 and 18 weeks of age. D. Baseline E/A ratios did not differ between NS and HS rats; however, by 14 weeks E/A ratio in HS rats decreased. At 18 weeks, E/A ratio in HS rats pseudo-normalized. E. E/E’ ratio increased in HS fed rats at 14 weeks and continued to increase at 18 weeks. F. Normal value of E/A ratio was obtained from NS rats at 14 weeks old (1.30–1.80). 23 of 38 HS fed rats showed E/A ratio < 1.30, i.e. diastolic dysfunction. G. Normal value of E/E’ ratio was set (9.86–17.19) from 14-week-old NS rats. E/E’ ratio > 17.19 was shown in 14/38 HS fed rats and taken as evidence of diastolic dysfunction. NS fed rats n=13 at 7 weeks, n=13 at 14 weeks and n=7 at 18 weeks. HS fed rats n=38 at 7 weeks, n=38 at 14 weeks and n=5 at 18 weeks. Error line indicates mean and standard deviation. * denotes p < 0.05 and ** denotes p < 0.001. Mixed model regression with post-hoc testing (Tukey adjustment) was used for 1B, D and E.
Figure 2
Figure 2. Programmed electrical stimulation (PES) in control and HFpEF rats
A. Representative surface electrograms (upper panel: stimuli, lower panel: ECG) show no inducible arrhythmia in a control rat with S1, S2, S3 and S4 stimuli. B. Polymorphic ventricular tachycardia in a HFpEF rat induced by S1, S2, S3 and S4 stimuli. C. PES in 13 control and 31 HFpEF rats showed increased susceptibility to VA in HFpEF rats. D. HFpEF rats exhibited more prolonged VA compared to control rats. E. Arrhythmogenicity index (AI) was increased in HFpEF rats compared to control rats. Control rats n=13 and HFpEF rats n=31. Pooled data lines show mean and standard deviation. ** denotes p < 0.001. Fisher’s exact test was used in 2C and Wilcoxon rank sum test was used in 2E.
Figure 3
Figure 3. ECG analyses in control and HFpEF rats
PR interval (A) and QRS width (B) in the two groups at 14 and 18 weeks show no differences between control and HFpEF rats. C. Representative ECGs showing QTc prolongation in HFpEF rat compared to control rat at 14 weeks. QTc prolongation in HFpEF rats is more pronounced at 18 weeks of age. D. QT interval was prolonged at 14 weeks of age with progression at 18 weeks of age. E. QTc was prolonged in HFpEF rats at 14 weeks compared to control rats and the prolongation is more pronounced at 18 weeks old. F. RR interval did not differ between the two groups. Control rats n=13 at 14 weeks and n=7 at 18 weeks. HFpEF rats n=31 at 14 weeks and n=5 at 18 weeks. Error line indicates mean and standard deviation. * denotes p < 0.05 and ** denotes p < 0.001. Mixed model regression with post-hoc testing (Tukey adjustment) was used for 3A-B and 3D-F.
Figure 4
Figure 4. Reduced repolarization reserve in HFpEF rats
A. 10 ml of 1 mM cesium chloride delivered through tail vein in a HFpEF rat prolonged QTc from 285 ms to 314 ms and worsened arrhythmia (AI from 19.8 to 33.2). B. 100 mg of magnesium sulfate delivered intravenously in a HFpEF rat decreased QTc interval from 267 ms to 226 ms and abolished the arrhythmia (AI 43.9 to 0). C. Cesium chloride prolonged QTc in HFpEF rats (left Y axis) and worsened VA (AI in right Y axis). HFpEF rats n=4. D. Magnesium sulfate shortened QTc interval in HFpEF rats (left Y axis) and decreased AI (right Y axis). HFpEF rats n=4. E. Cesium chloride in control rats prolonged QTc interval (left Y axis) but failed to induce VA (AI in right Y axis). Control rats n=4. * denotes p < 0.05. Paired t-test was used for 4C-E.
Figure 5
Figure 5. Optical mapping shows prolonged action potentials and polymorphic VT in HFpEF hearts
A. Optical mapping of control and HFpEF hearts ex vivo showed action potential changes. B. Action potential prolongation in HFpEF is evident in representative recordings. C. Action potential duration 90% (APD90) is prolonged in HFpEF hearts compared to control hearts. Control rats n=4 and HFpEF rats n=4. D. Representative APD map of control and HFpEF hearts. E. APD dispersion was increased in HFpEF rats compared to controls. F. PES in a HFpEF rat elicited polymorphic VT. APD map of the rat heart showed heterogenous and dispersed APD G. Activation map analyses of the polymorphic VT showed multiple re-entry circuits. First 10 beats are caused by 10 S1 stimuli and next beat by single S2. There were approximately 22 VT beats and with variable clockwise or counter-clockwise rotation indicating multiple re-entry circuits. Of note, the site of block was found to be located at the region where the APD dispersion was high and this created the first re-entry circuit for the arrhythmia. Error line indicates mean and standard deviation. * denotes p < 0.05. AU: Arbitrary Unit. Mixed model regression with post-hoc testing (Tukey adjustment) was used for 5C and unpaired t-test was used for 5E.
Figure 6
Figure 6. Prolonged action potential duration in HFpEF cardiomyocytes and down-regulation of potassium currents
A. Representative action potentials in control and HFpEF cardiomyocytes. B. APD90 was prolonged in HFpEF cardiomyocytes compared to controls (n=14 cells from 4 control rats, and n=7 cells from 4 HFpEF rats). C. Cell capacitance was increased in HFpEF compared to control cardiomyocytes (n=31 cardiomyocytes from control rats, and n=38 cardiomyocytes from HFpEF rats). D, F, H. Representative Ito, IKr and IK1 recordings in control and HFpEF rats. E, G, I. Down-regulation of Ito, IKr and IK1 density in HFpEF rats compared to control rats (n=8 cardiomyocytes from n=4 rats each group). Error line indicates mean and standard deviation (6B-C) and standard error of mean (6E, G, I). * denotes p < 0.05 and ** denotes p < 0.001. Unpaired t-test was used for 6B, Wilcoxon rank sum test was used for 6C, and mixed model regression with post-hoc testing (Tukey adjustment) was used for 6E, G, I.
Figure 7
Figure 7. Transcript and protein levels of ion channel genes and fibrosis in control and HFpEF rats
A. Quantitative reverse transcriptase PCR showed decreased expression of Kcnd2 and Kcnd3 mRNAs in HFpEF hearts compared to control hearts. Y axis indicates log (fold change). HFpEF rats n=4. B. Western blot of Kv4.2 showed no expression differences in the two groups. C. Kv4.3 expression was decreased in HFpEF rats compared to control rats. D. Kv4.2/GAPDH ratio did not differ between the two groups. n=3 rats each group. E. Kv4.3/GAPDH ratio was markedly decreased in HFpEF rats compared to control rats. n=3 rats each group. F. Representative Masson’s trichrome-stained sections of control and HFpEF hearts. G. Increased fibrosis in HFpEF hearts compared to controls. Error line indicates mean and standard deviation. * denotes p < 0.05 and ** denotes p < 0.001. Multiple t-tests were performed using step-down bootstrap sampling to control the familywise error rate at 0.05 for 7A, D and E, and unpaired t-test was used for 7G.
Figure 8
Figure 8. Schematic representation of our working hypothesis
Increased susceptibility to VA in HFpEF is proposed to be due to action potential prolongation/dispersion and fibrosis, favoring prolonged and heterogeneous repolarization and multiple re-entry circuits. The proposed link to sudden cardiac death is plausible but has not been demonstrated by our data.

References

    1. Kochanek KD, Murphy SL, Xu J, Tejada-Vera B. Deaths: Final Data for 2014. Natl Vital Stat Rep. 2016;65:1–122. - PubMed
    1. Writing Committee M; Yancy CW, Jessup M, Bozkurt B, Butler J, Casey DE, Jr, Drazner MH, Fonarow GC, Geraci SA, Horwich T, Januzzi JL, Johnson MR, Kasper EK, Levy WC, Masoudi FA, McBride PE, McMurray JJ, Mitchell JE, Peterson PN, Riegel B, Sam F, Stevenson LW, Tang WH, Tsai EJ, Wilkoff BL American College of Cardiology Foundation/American Heart Association Task Force on Practice G. 2013 ACCF/AHA guideline for the management of heart failure: a report of the American College of Cardiology Foundation/American Heart Association Task Force on practice guidelines. Circulation. 2013;128:e240–327. - PubMed
    1. Jessup M, Brozena S. Heart failure. N Engl J Med. 2003;348:2007–2018. - PubMed
    1. Braunwald E. Heart failure. JACC Heart Fail. 2013;1:1–20. - PubMed
    1. Owan TE, Hodge DO, Herges RM, Jacobsen SJ, Roger VL, Redfield MM. Trends in prevalence and outcome of heart failure with preserved ejection fraction. N Engl J Med. 2006;355:251–259. - PubMed

Publication types

MeSH terms