. 2017 Dec 15;23(24):7558-7568.
doi: 10.1158/1078-0432.CCR-17-1231. Epub 2017 Oct 3.

Modulation of Navitoclax Sensitivity by Dihydroartemisinin-Mediated MCL-1 Repression in BCR-ABL+ B-Lineage Acute Lymphoblastic Leukemia

Affiliations

Modulation of Navitoclax Sensitivity by Dihydroartemisinin-Mediated MCL-1 Repression in BCR-ABL+ B-Lineage Acute Lymphoblastic Leukemia

Amit Budhraja et al. Clin Cancer Res. .

Abstract

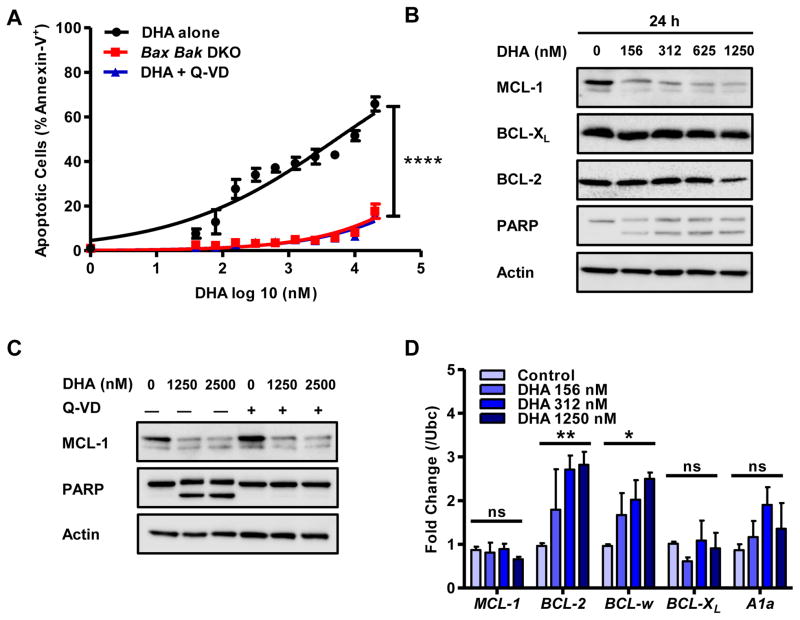
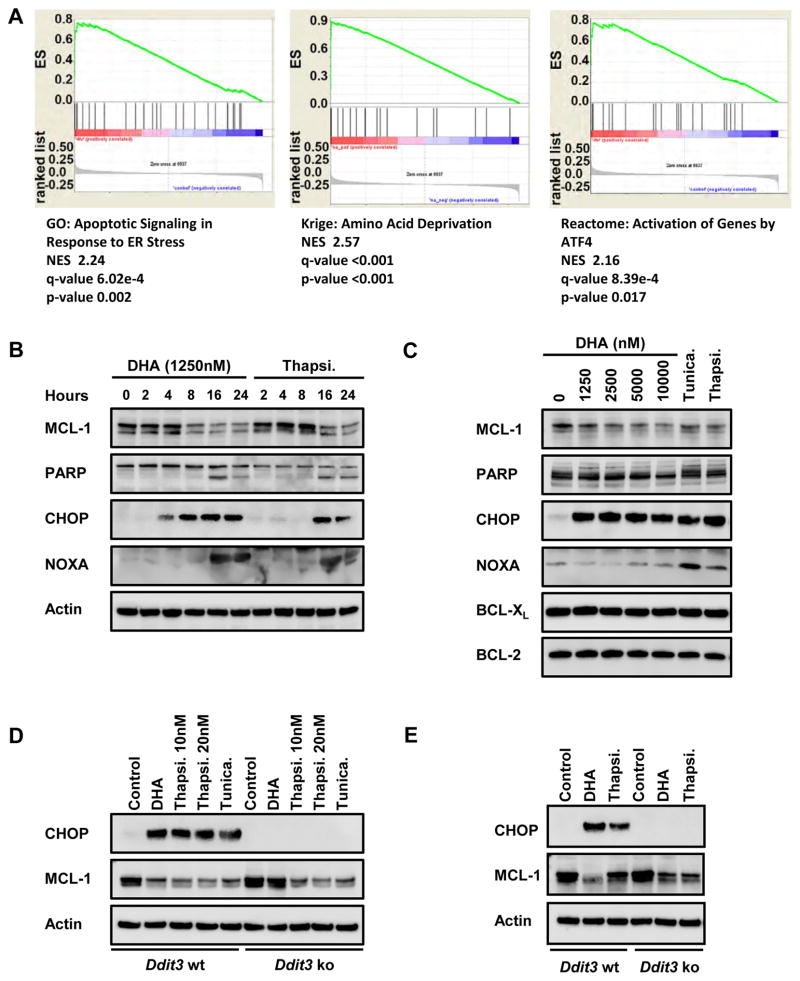
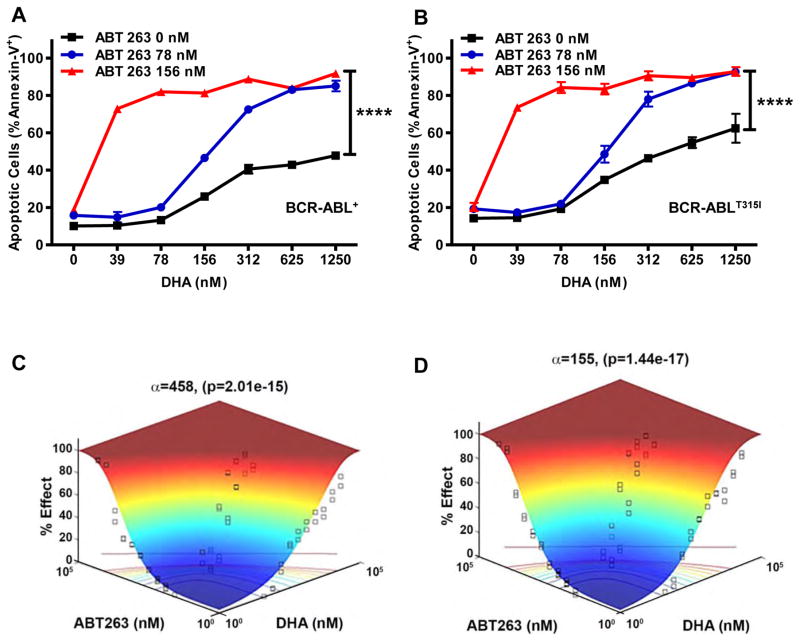
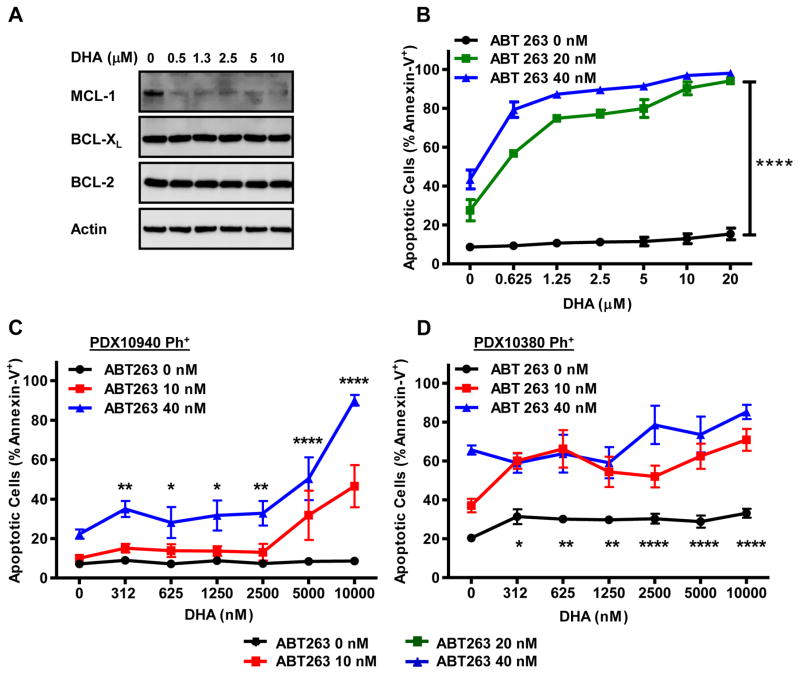
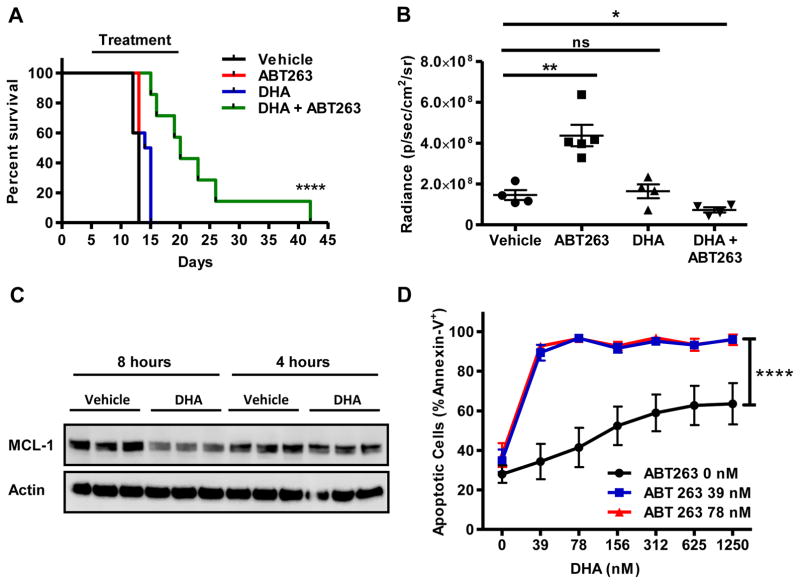
Purpose: BCR-ABL+ B-ALL leukemic cells are highly dependent on the expression of endogenous antiapoptotic MCL-1 to promote viability and are resistant to BH3-mimetic agents such as navitoclax (ABT-263) that target BCL-2, BCL-XL, and BCL-W. However, the survival of most normal blood cells and other cell types is also dependent on Mcl-1 Despite the requirement for MCL-1 in these cell types, initial reports of MCL-1-specific BH3-mimetics have not described any overt toxicities associated with single-agent use, but these agents are still early in clinical development. Therefore, we sought to identify approved drugs that could sensitize leukemic cells to ABT-263.Experimental Design: A screen identified dihydroartemisinin (DHA), a water-soluble metabolite of the antimalarial artemisinin. Using mouse and human leukemic cell lines, and primary patient-derived xenografts, the effect of DHA on survival was tested, and mechanistic studies were carried out to discover how DHA functions. We further tested in vitro and in vivo whether combining DHA with ABT-263 could enhance the response of leukemic cells to combination therapy.Results: DHA causes the downmodulation of MCL-1 expression by triggering a cellular stress response that represses translation. The repression of MCL-1 renders leukemic cells highly sensitive to synergistic cell death induced by ABT-263 in a mouse model of BCR-ABL+ B-ALL both in vitro and in vivo Furthermore, DHA synergizes with ABT-263 in human Ph+ ALL cell lines, and primary patient-derived xenografts of Ph+ ALL in culture.Conclusions: Our findings suggest that combining DHA with ABT-263 can improve therapeutic response in BCR-ABL+ B-ALL. Clin Cancer Res; 23(24); 7558-68. ©2017 AACR.


Conflict of interest statement

Conflict of Interest

The authors declare no conflict of interest.

Figures

Figure 1
Figure 1. Dihydroartemisinin (DHA) induces apoptosis and represses MCL-1 expression in Mouse BCR-ABL+ B-ALL Cells
(A) BCR-ABL+ B-ALL wild-type and Bax and Bak-doubly deficient (DKO) cells were treated with indicated doses of DHA and the caspase inhibitor Q-VD (10 μM) for 24 hours. Apoptotic cells were determined by staining with Annexin-V and detection by flow cytometry. Data are average of 3 independent experiments (n=3) and error bars the S.E.M. One-way ANOVA with Bonferroni multiple comparison indicates significance p<0.001**** (B) BCR-ABL+ BALL cells were exposed to indicated doses of DHA for 24 hours and subjected to immunoblotting for expression of indicated proteins. Cleaved PARP detects the induction of apoptosis and Actin serves as loading control. (C) BCR-ABL+ B-ALL cells pretreated with Q-VD (10 μM) for 1 hour, followed by treatment with indicated doses of DHA for 24 hours and immunoblotted for indicated proteins. (D) BCR-ABL+ B-ALL were treated with indicated doses of DHA for 24 hours and the expression of anti-apoptotic BCL-2 family members was determined by quantitative PCR. Each measurement was performed from three biological replicates (in triplicate), normalized to Ubiquitin (Ubc), and compared to untreated cells. The average fold change is indicated and error bars the S.E.M. Two-way ANOVA with Bonferroni multiple comparison indicates significance p<0.05* and p<0.01**.
Figure 2
Figure 2. DHA treatment induces an ER stress response that represses MCL-1 expression
(A) Gene-set enrichment analysis (GSEA, version 2.2.3) was performed using microarray data from mouse BCR-ABL+ B-ALL cells treated for 4 hours with vehicle (control) versus 312 nM DHA and the c5.all.v5.2 symbol.gmt Gene ontology gene sets. (B) Mouse BCR-ABL+ B-ALL cells were treated with 1250 nM DHA or 5 nM thapsigargin (Thapsi, positive control for ER stress). Cell lysates were analyzed by immunoblot to detect indicated proteins. This experiment is representative of 3 independently performed assays. (C) SV40-transformed wild-type mouse embryonic fibroblasts (MEFs) were treated with indicated doses of DHA. As a positive control for ER stress induction, MEFs were treated with either 25 ng/ml tunicamycin (Tunica) or 20 nM thapsigargin. After 24 hours, the MEFs were harvested and cell lysates analyzed by immunoblot analysis. This experiment is representative of 3 independently-performed assays. (D) Wild-type (Ddit3 wt) or Ddit3-deficient (Ddit3 ko) SV40-transformed MEFs were treated with 10 μM DHA and lysates prepared after 24 hours. To induce ER stress, the cells were treated with thapsigargin (10 or 20 nM) or tunicamycin 25ng/ml. The expression of CHOP (encoded for by Ddit3 gene), MCL-1 and Actin proteins were detected by immunoblot. This experiment is representative of 3 independently-performed assays. (E) Wild-type (Ddit3 wt) or Ddit3-deficient (Ddit3 ko) mouse BCR-ABL+ B-ALL cells were treated with 1250 nM DHA and lysates prepared after 24 hours. To induce ER stress, the cells were treated with thapsigargin (5 nM). The expression of CHOP (encoded for by Ddit3 gene), MCL-1 and Actin proteins were detected by immunoblot. This experiment is representative of 3 independently-performed assays.
Figure 3
Figure 3. Synergism between DHA and ABT-263 in Mouse BCR-ABL+ B-ALL leukemia
Mouse (A) BCR-ABL+ and (B) BCR-ABLT315I B-ALL cells were cultured with ABT-263 (0 nM, 78 nM, or 156 nM concentrations) and DHA at indicated doses in culture. Following 24 hours of incubation, apoptosis was assessed (Annexin-V+). Each experiment was performed in triplicate 3 times and the average plotted with error bars indicating S.E.M. One-way ANOVA with Bonferroni multiple comparison indicates significance p<0.001**** between the DHA alone (0 nM ABT-263) and both combined treated arms (78 nM and 156 nM) at indicated doses. (C&D) Synergy was assessed by response surface modeling. The combination of DHA and ABT-263 showed a synergistic interaction in both the mouse (C) BCR-ABL+ (α=210; p=8.59×10⁻¹⁴) and (D) BCR-ABLT315I (α=61.4; p=3.44×10⁻¹⁵) B-ALL cells.
Figure 4
Figure 4. Synergistic effect of Ph+ human cell lines and primary patient samples to combined treatment with DHA and ABT-263
(A) Human Ph+ ALL cell line TOM-1 was treated with indicated doses of DHA. After 24 hours, the cells were lysed and immunoblotted for expression of indicated proteins. (B) TOM-1 human Ph+ cells were cultured with ABT-263 (0 nM, 20 nM, or 40 nM concentrations) and combined with DHA at indicated doses. Following 24 hours of incubation, apoptotic cells (Annexin-V+) were assessed by flow cytometry. Each experiment was performed 3 times in triplicate and the average plotted with S.E.M. One-way ANOVA with Bonferroni multiple comparison indicates significance p<0.001**** between the DHA alone (0 nM ABT-263) and both combined treated arms (20 nM and 40 nM) at indicated doses. Human primary patient xenograft (PDX) Ph+ B-ALL cells from (C) PDX10940 and (D) PDX10380 were cultured with ABT-263 (0 nM, 10 nM, or 40 nM concentrations) and combined with DHA at indicated doses in culture. Following 24 hours of incubation, apoptotic cells were assessed. Each experiment was performed from at least 3 separate recipient mice and each assay was carried out in triplicate. The average are plotted with S.E.M. One-way ANOVA with Bonferroni multiple comparison indicates significance p<0.001**** between the DHA alone (0 nM ABT-263) and both combined treated arms (10 nM and 40 nM) at indicated doses. The combination of DHA and ABT-263 showed a synergistic interaction in (B) TOM-1 Ph+ cells (α=9.43; p=0.004) (C) primary patient xenograft PDX10940 and (α=118; p=2.64×10⁻¹⁰) and (D) PDX10380 (α=13667; p=2.67×10⁻⁵) by response surface modeling.
Figure 5
Figure 5. Potentiated Response of BCR-ABL+ B-ALL cells treated in vivo with DHA and ABT-263
Mouse BCR-ABL+ B-ALL cells were adoptively transferred into syngeneic, non-irradiated C57BL/6 recipients. Five days after the transfer the recipients were divided into 4 treatment arms: vehicle controls, ABT-263 alone, DHA alone, and ABT-263 and DHA. Mice received the treatment daily (indicated by “Treatment”) for 15 days. (A) Kaplan-Meier survival curve of the cohorts of mice (n=10 per group). Log-rank test shows p<0.001**** for combined treatment group. (B) Quantification of bioluminescence measurements for the indicated mouse cohorts from analysis on day 13 after leukemia transplant. Each symbol represents one animal, the lines indicate the average radiance, and the error bars are the S.E.M. One-way ANOVA followed by t test with post-hoc correction for multiple comparisons indicate significance between indicated groups p<0.05* and p<0.01**. (C) Splenic blast cells harvested from mouse BCR-ABL+ B-ALL recipient mice, 4 or 8 hours after treatment with vehicle or DHA (200 mg/kg) were lysed and immunoblotted for indicated proteins. Significant repression was observed only at 8 hour time point. Each lane represents a recipient mouse. (D) Mouse BCR-ABL+ BALL cells from moribund recipients that received the combined treatment with ABT-263 and DHA (on day 42) were re-cultured with ABT-263 (0 nM, 39 nM, or 78 nM concentrations) and then combined with DHA at indicated doses in culture. Following 24 hours of incubation, cell viability was assessed. Each experiment was performed 3 times in triplicate and the average apoptotic cells (Annexin-V+) are plotted with S.E.M. Two-way ANOVA indicates significance p<0.001**** between the DHA alone (0 nM ABT-263)and both combined treated arms at all doses. The combination of DHA and ABT-263 still showed a synergistic interaction in ex vivo mouse BCR-ABL+ B-ALL cells (α=1871; p=3.24×10⁻³) by response surface modeling.

Similar articles

Cited by

References

    1. Pui CH, Jeha S. New therapeutic strategies for the treatment of acute lymphoblastic leukaemia. Nat Rev Drug Discov. 2007;6(2):149–65. - PubMed
    1. Burmeister T, Schwartz S, Bartram CR, Gokbuget N, Hoelzer D, Thiel E. Patients’ age and BCR-ABL frequency in adult B-precursor ALL: a retrospective analysis from the GMALL study group. Blood. 2008;112(3):918–9. - PubMed
    1. Rowley JD. Letter: A new consistent chromosomal abnormality in chronic myelogenous leukaemia identified by quinacrine fluorescence and Giemsa staining. Nature. 1973;243(5405):290–3. - PubMed
    1. Witte ON, Dasgupta A, Baltimore D. Abelson murine leukaemia virus protein is phosphorylated in vitro to form phosphotyrosine. Nature. 1980;283(5750):826–31. - PubMed
    1. Deininger M, Buchdunger E, Druker BJ. The development of imatinib as a therapeutic agent for chronic myeloid leukemia. Blood. 2005;105(7):2640–53. - PubMed

MeSH terms