. 2017 Oct;29(10):2413-2432.
doi: 10.1105/tpc.17.00568. Epub 2017 Oct 3.

POLYGALACTURONASE INVOLVED IN EXPANSION3 Functions in Seedling Development, Rosette Growth, and Stomatal Dynamics in Arabidopsis thaliana

Affiliations

POLYGALACTURONASE INVOLVED IN EXPANSION3 Functions in Seedling Development, Rosette Growth, and Stomatal Dynamics in Arabidopsis thaliana

Yue Rui et al. Plant Cell. 2017 Oct.

Abstract

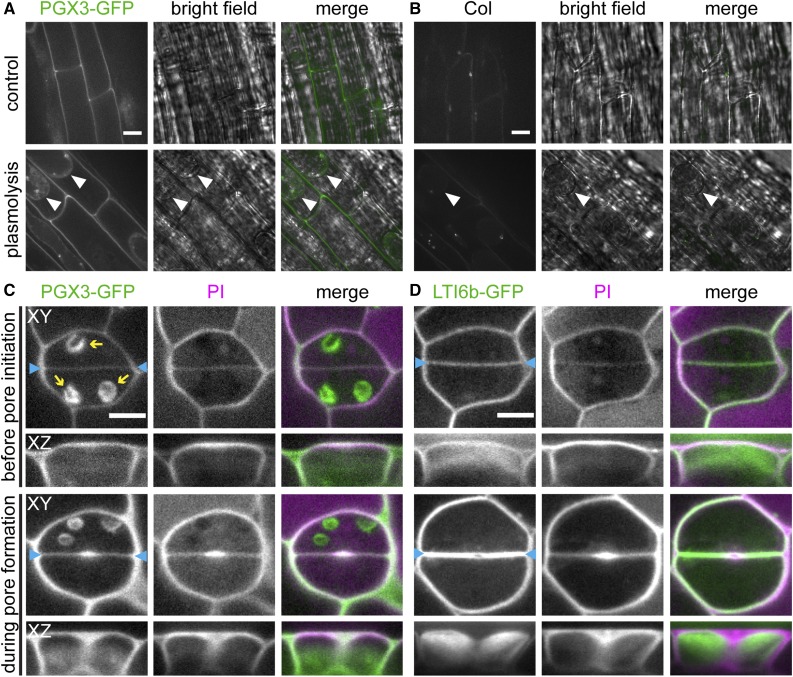
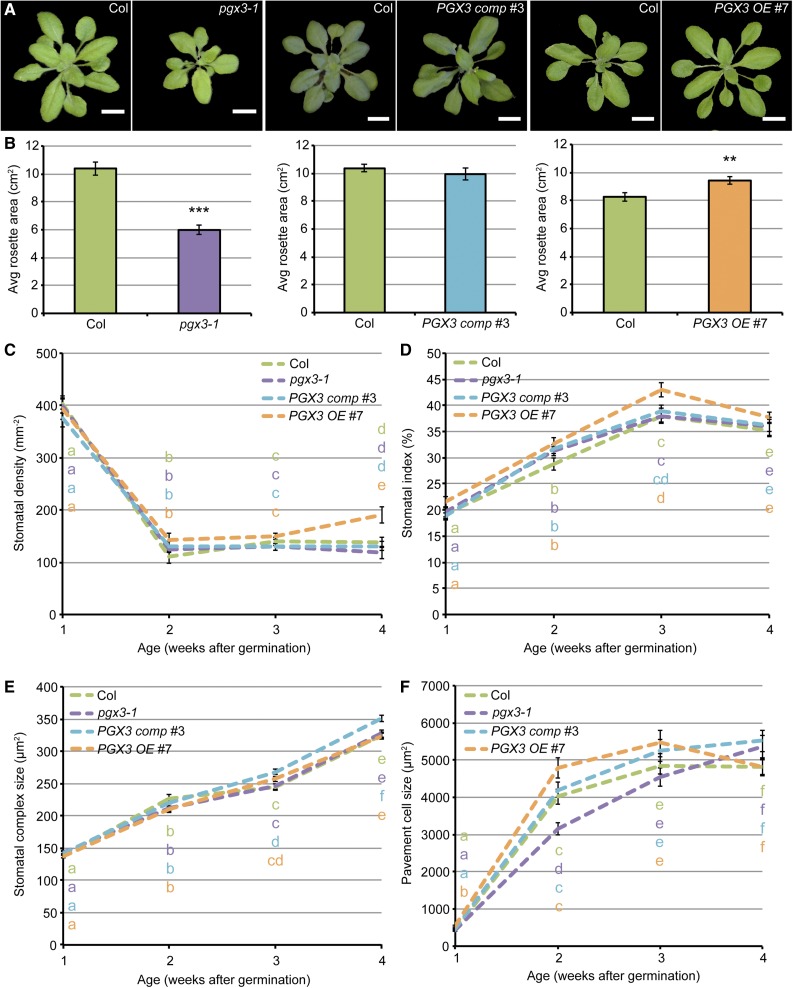
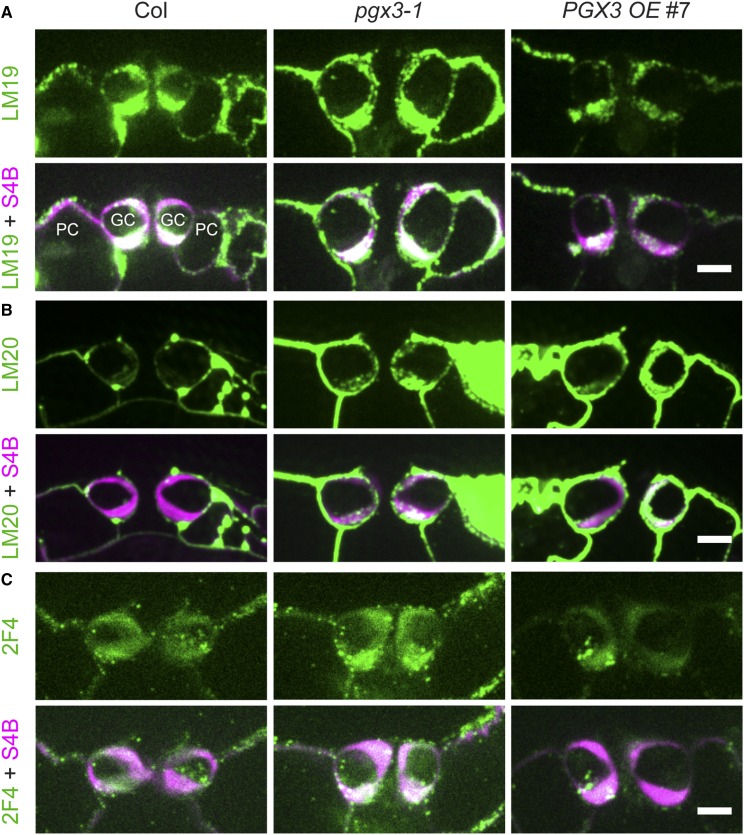
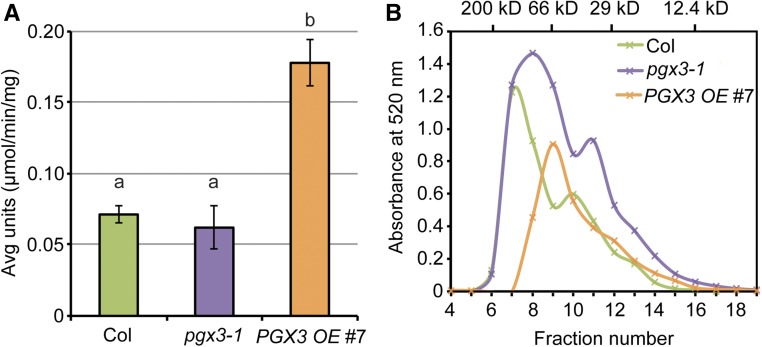
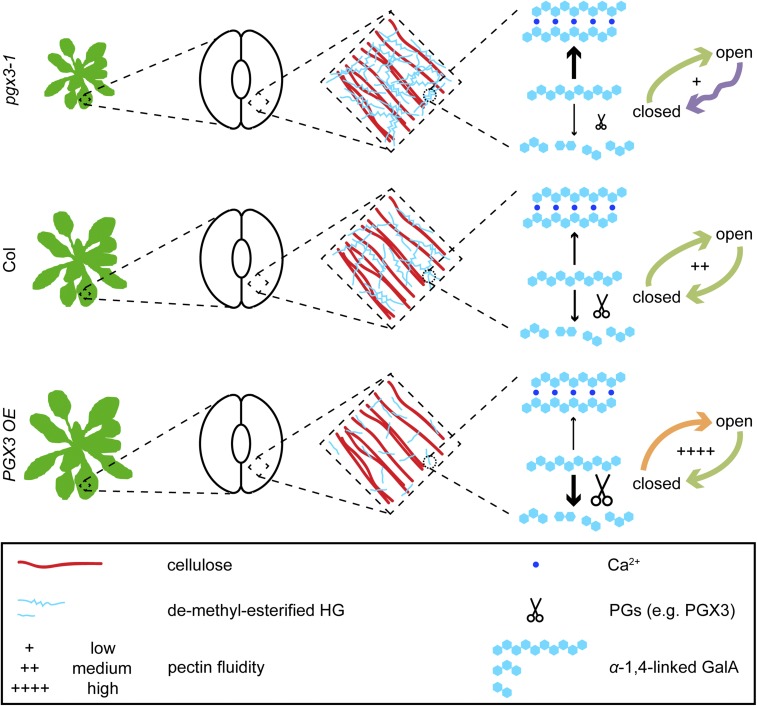
Plant cell separation and expansion require pectin degradation by endogenous pectinases such as polygalacturonases, few of which have been functionally characterized. Stomata are a unique system to study both processes because stomatal maturation involves limited separation between sister guard cells and stomatal responses require reversible guard cell elongation and contraction. However, the molecular mechanisms for how stomatal pores form and how guard cell walls facilitate dynamic stomatal responses remain poorly understood. We characterized POLYGALACTURONASE INVOLVED IN EXPANSION3 (PGX3), which is expressed in expanding tissues and guard cells. PGX3-GFP localizes to the cell wall and is enriched at sites of stomatal pore initiation in cotyledons. In seedlings, ablating or overexpressing PGX3 affects both cotyledon shape and the spacing and pore dimensions of developing stomata. In adult plants, PGX3 affects rosette size. Although stomata in true leaves display normal density and morphology when PGX3 expression is altered, loss of PGX3 prevents smooth stomatal closure, and overexpression of PGX3 accelerates stomatal opening. These phenotypes correspond with changes in pectin molecular mass and abundance that can affect wall mechanics. Together, these results demonstrate that PGX3-mediated pectin degradation affects stomatal development in cotyledons, promotes rosette expansion, and modulates guard cell mechanics in adult plants.


Figures

Figure 1.
Figure 1.
PGX3 Is Expressed in Multiple Tissues and Guard Cells. (A) to (O) GUS staining of ProPGX3:GUS transgenic plants. Images show a 6-d-old etiolated hypocotyl (A), a 6-d-old light-grown seedling (B) with close-up views of a lateral root (C) and the root tip (D), a 3-week-old rosette leaf (E), stomatal guard cells in 3-week-old rosette leaves at different developmental stages with a meristemoid in (F), a guard mother cell in (G), guard cells with an initiating pore (H), young guard cells (I), and mature guard cells in (J). Additional images show a 6-week-old inflorescence in (K), a flower in (L), siliques in (M) and (N), and a mature dry seed in (O). Arrows in (A) and (B) indicate collet, which is the junction between the root and the hypocotyl. Arrows indicate a lateral root initiation site in (C) and a funiculus in (N). Bars = 1 mm in (A), (B), (K), (L), and (N), 0.5 mm in (C) and (D), 0.5 cm in (E), 10 µm in (F) to (J), 0.25 cm in (M), and 100 µm in (O). (P) qPCR quantification of PGX3 expression in different tissues. The type and age of tissues used in qPCR experiments were consistent with those in GUS staining. ACT2 was used as an internal control, and PGX3 expression in hypocotyls was normalized to 1. Error bars are se and n = 3 biological replicates, with each biological replicate being an independent pool of tissues. For example, for 6-d-old etiolated hypocotyls, each biological replicate contained ∼40 dark-grown seedlings.
Figure 2.
Figure 2.
In Seedlings, PGX3-GFP Is Localized in the Cell Wall and Accumulates at Stomatal Pore Initiation Sites. (A) and (B) Fluorescence and bright-field images of 5-d-old roots. Images show roots expressing ProPGX3:PGX3-GFP (A) or Col roots (B) under the control condition (top panel) or plasmolyzed with 1 M mannitol for 5 min (bottom panel). White arrowheads indicate membranes separated from the cell wall. (C) and (D) PI staining in developing guard cells of 4-d-old seedlings. Images show seedlings expressing ProPGX3:PGX3-GFP (C) or a membrane marker, GFP-tagged LTI6b (D). Blue arrowheads indicate cell plates between sister guard cells. Yellow arrows indicate autofluorescence from chloroplasts. XY and XZ indicate projections in the XY and XZ directions, respectively. Bars = 10 µm in (A) and (B) and 5 µm in (C) and (D).
Figure 3.
Figure 3.
In Seedlings, PGX3 Functions in Root Elongation and Regulates Cotyledon Shape, Stomatal Spacing, and Stomatal Pore Size. (A) Primary root length of 4- to 8-d-old light-grown seedlings in Col and pgx3-1. Error bars are se (n ≥ 91 seedlings per genotype per day from three independent experiments; ***P < 0.001, Student’s t test). Relative growth rates (RGRs) of roots in each genotype are indicated in the graph. (B) and (C) Cotyledon shape of 6-d-old pgx3-1 mutants. Panels show representative images (B) and quantifications (C) (n ≥ 107 seedlings per genotype from three independent experiments). (D) and (E) Stomatal cluster analysis in cotyledons of 6-d-old Col and pgx3-1 seedlings. Panels show representative PI staining (D) and quantifications (E) (n ≥ 271 stomata from 12 seedlings per genotype, two independent experiments; ***P < 0.001, χ2 test). Red brackets in (D) indicate clustered stomata. (F) Stomatal dimensions. Shown are brackets representing pore length (1, blue), pore width (2, magenta), and guard cell pair height (3, green) along with representative PI staining images of stomata in 6-d-old seedlings of Col, pgx3-1, PGX3 comp #3, and PGX3 OE #7. (G) to (J) Measurements of pore length (G), pore width (H), guard cell pair height (I), and the ratio of pore length to guard cell pair height (J) in 6-d-old Col, pgx3-1, PGX3 comp #3, and PGX3 OE #7 seedlings. Numbers in black boxes on the graphs correspond to numbers in stomatal dimension legend in (F). Error bars are se, and lowercase letters represent significantly different groups (n ≥ 140 stomata from at least 10 seedlings per genotype, two independent experiments; P < 0.05, one-way ANOVA and Tukey test). Bars = 1 mm in (B), 10 µm in (D), and 5 µm in (F).
Figure 4.
Figure 4.
PGX3 Is Required for Rosette Expansion, but Does Not Affect Stomatal Density or Size in True Leaves. (A) and (B) Representative segmented images of rosettes (A) and measurements of rosette area (B) in 3-week-old Col, pgx3-1, PGX3 comp #3, and PGX3 OE #7 plants. Bars = 1 cm in (A). Error bars are se in (B) (n ≥ 46 plants per genotype from three independent experiments; **P < 0.01 and ***P < 0.001, Student’s t test). Note that side-by-side controls were always used for each genotype in every independent experiment. (C) to (F) Stomatal density (C), stomatal index (D), stomatal complex size (E), and pavement cell size (F) in 1-, 2-, 3-, and 4-week-old true leaves of Col, pgx3-1, PGX3 comp #3, and PGX3 OE #7 plants. Error bars are se. Lowercase letters represent significantly different groups and colors of the letters correspond to the colors of genotypes. For (C) and (D), n ≥ 3 fields of view from six individual plants per genotype. For (E), n ≥ 55 stomatal complexes from six individual plants per genotype. For (F), n ≥ 71 pavement cells from six individual plants per genotype. P < 0.05, one-way ANOVA and Tukey test.
Figure 5.
Figure 5.
PGX3 Modulates Stomatal Dynamics in Adult Plants. (A) and (B) Average stomatal response to 1 µM FC-induced opening (A) or 50 µM ABA-induced closure (B) on the population level in 3- to 4-week-old Col, pgx3-1, PGX3 comp #3, and PGX3 OE #7 plants. Error bars are se (n ≥ 94 stomata per genotype per time point from three independent experiments; *P < 0.05, **P < 0.01, and ***P < 0.001, Student’s t test). (C) and (D) Individual stomatal dynamics in 3- to 4-week-old Col controls, pgx3-1 mutants, and PGX3 OE #7 plants during 50 µM ABA-induced closure (n ≥ 30 stomata per genotype from at least four independent experiments). For each graph in (C), top, middle, and bottom lines correspond to the maximum, median, and minimum stomatal pore width values at each time point, respectively. Kymographs with quantifications in (D) were generated from the same set of images in Supplemental Movie 1. Double-headed arrows in each kymograph indicate stomatal pore width at the beginning or the end of ABA-induced closure.
Figure 6.
Figure 6.
PGX3 Regulates the Level of Demethylesterified HG in Guard Cells in True Leaves. (A) and (B) COS488 labeling in guard cells. Images show representative XY and XZ maximum projection images (A) and fluorescence intensity (B) quantified in the walls of individual guard cells in 3- to 4-week-old Col, pgx3-1, PGX3 comp #3, and PGX3 OE #7 plants. Error bars are se, and lowercase letters represent significantly different groups (n ≥ 42 guard cell pairs from six plants per genotype, two independent experiments; P < 0.05, one-way ANOVA and Tukey test). (C) and (D) PI staining in guard cells. Images show representative XY and XZ maximum projection images (C) and fluorescence intensity (D) quantified in the walls of individual guard cells in 3- to 4-week-old Col, pgx3-1, PGX3 comp #3, and PGX3 OE #7 plants. Error bars are se, and lowercase letters represent significantly different groups (n ≥ 36 guard cell pairs from six plants per genotype, two independent experiments; P < 0.05, one-way ANOVA and Tukey test). Images in (A) and (C) were applied with a fire look-up table to facilitate the comparison of fluorescence intensity. XZ projections in (A) and (C) were made from the midline in the Y direction. Bars = 5 µm in (A) and (C).
Figure 7.
Figure 7.
Immunolabeling in Guard Cell Walls Reveals Changes in Antibody Binding. (A) Colabeling of LM19, an antibody that recognizes demethylesterified HG, and S4B, a dye that binds to cellulose, in cross sections of guard cell pairs in 3- to 4-week-old Col, pgx3-1, and PGX3 OE #7 plants. Top panels, LM19 labeling; bottom panels, LM19 labeling (green) merged with S4B signals (magenta) in the same guard cell pair. GC, guard cells; PC, pavement cells. (B) Colabeling of LM20, an antibody that recognizes methylesterified HG, and S4B in cross sections of guard cell pairs in 3- to 4-week-old Col, pgx3-1, and PGX3 OE #7 plants. Top panels, LM20 labeling; bottom panels, LM20 labeling (green) merged with S4B signals (magenta) in the same guard cell pair. (C) Colabeling of 2F4, an antibody that recognizes Ca2+-cross-linked HG, and S4B in cross sections of guard cell pairs in 3- to 4-week-old Col, pgx3-1, and PGX3 OE #7 plants. Top panels, 2F4 labeling; bottom panels, 2F4 labeling (green) merged with S4B signals (magenta) in the same guard cell pair. Bars = 5 µm in (A) to (C).
Figure 8.
Figure 8.
Changes in PGX3 Expression Level Lead to Altered Total PG Activity and HG Molecular Mass. (A) Total PG activity in vivo is significantly higher in PGX3 OE #7 plants. Total plant proteins were isolated from 33-d-old flowers. One unit of PG activity is the amount of enzyme releasing 1 µmol reducing end group per min per mg total protein at 30°C. Error bars are se, and lowercase letters represent significantly different groups (n ≥ 3 technical replicates per genotype per biological replicate, two biological replicates, and each biological replicate is an independent pool of flowers; P < 0.05, one-way ANOVA and Tukey test). (B) Molecular mass analysis of CDTA-soluble pectins extracted from 34-d-old Col, pgx3-1, and PGX3 OE #7 rosette leaves. Molecular mass of the standards (β-amylase, 200 kD; BSA, 66 kD; carbonic anhydrase, 29 kD; and cytochrome c, 12.4 kD) is shown on the x axis at the top (n = 2 technical replicates per genotype per biological replicate, two biological replicates, and each biological replicate is an independent pool of rosette leaves).
Figure 9.
Figure 9.
Schematic for How PGX3 Regulates Rosette Expansion and Stomatal Dynamics. Demethylesterified HG can either be cross-linked by Ca2+ or be subject to degradation by PGs such as PGX3. The balance between these two processes maintain pectin fluidity in the walls that undergo irreversible expansion (e.g., in rosettes) and in guard cell walls that undergo reversible expansion and contraction. In pgx3-1 mutants, although there is no significant change in pectin size due to the absence of PGX3 expression, Ca2+-cross-linked HG formation occurs more frequently because the abundance of demethylesterified HG is increased. As a result, pectin fluidity is lessened and tissue growth is inhibited. Stomata exhibit stepwise closure, but guard cell walls are still fluid enough to allow for normal stomatal opening. In Col controls, pectin fluidity is maintained at intermediate levels due to a balance between Ca2+-cross-linking and pectin degradation, enabling normal stomatal opening or closure. In PGX3 OE plants, HG molecules are smaller due to excessive PGX3 expression and more pectin degradation, which, together with the observation that there is less demethylesterified HG, leads to enhanced pectin fluidity, increased rosette size, and faster stomatal opening.

References

    1. Amsbury S., Hunt L., Elhaddad N., Baillie A., Lundgren M., Verhertbruggen Y., Scheller H.V., Knox J.P., Fleming A.J., Gray J.E. (2016). Stomatal function requires pectin de-methyl-esterification of the guard cell wall. Curr. Biol. 26: 2899–2906. - PMC - PubMed
    1. Anderson C.T., Carroll A., Akhmetova L., Somerville C. (2010). Real-time imaging of cellulose reorientation during cell wall expansion in Arabidopsis roots. Plant Physiol. 152: 787–796. - PMC - PubMed
    1. Atkinson R.G., Schröder R., Hallett I.C., Cohen D., MacRae E.A. (2002). Overexpression of polygalacturonase in transgenic apple trees leads to a range of novel phenotypes involving changes in cell adhesion. Plant Physiol. 129: 122–133. - PMC - PubMed
    1. Atmodjo M.A., Hao Z., Mohnen D. (2013). Evolving views of pectin biosynthesis. Annu. Rev. Plant Biol. 64: 747–779. - PubMed
    1. Bates G.W., Rosenthal D.M., Sun J., Chattopadhyay M., Peffer E., Yang J., Ort D.R., Jones A.M. (2012). A comparative study of the Arabidopsis thaliana guard-cell transcriptome and its modulation by sucrose. PLoS One 7: e49641. - PMC - PubMed

MeSH terms

Substances

LinkOut - more resources