. 2017 Oct 1;144(19):3465-3474.
doi: 10.1242/dev.152520.

Differential interactions between Notch and ID factors control neurogenesis by modulating Hes factor autoregulation

Affiliations

Differential interactions between Notch and ID factors control neurogenesis by modulating Hes factor autoregulation

Marcelo Boareto et al. Development. .

Abstract

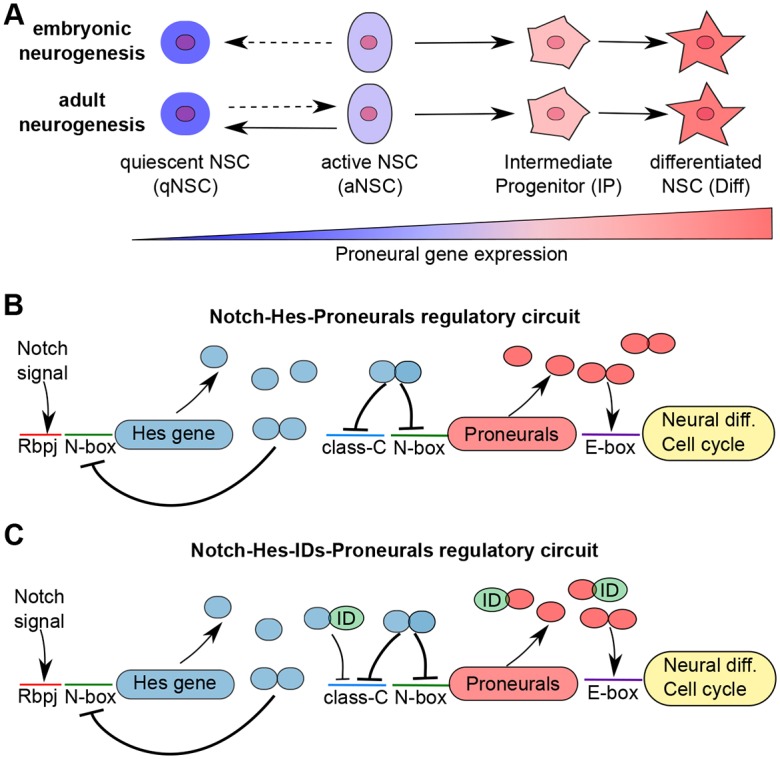
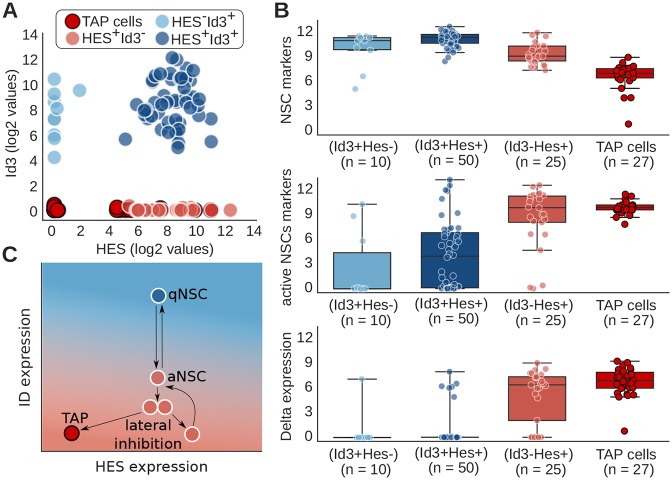
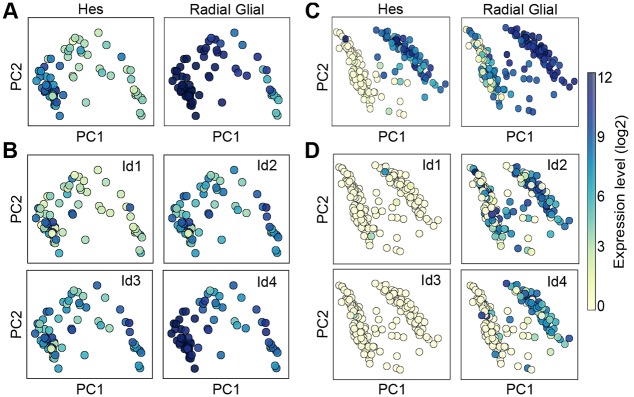
During embryonic and adult neurogenesis, neural stem cells (NSCs) generate the correct number and types of neurons in a temporospatial fashion. Control of NSC activity and fate is crucial for brain formation and homeostasis. Neurogenesis in the embryonic and adult brain differ considerably, but Notch signaling and inhibitor of DNA-binding (ID) factors are pivotal in both. Notch and ID factors regulate NSC maintenance; however, it has been difficult to evaluate how these pathways potentially interact. Here, we combined mathematical modeling with analysis of single-cell transcriptomic data to elucidate unforeseen interactions between the Notch and ID factor pathways. During brain development, Notch signaling dominates and directly regulates Id4 expression, preventing other ID factors from inducing NSC quiescence. Conversely, during adult neurogenesis, Notch signaling and Id2/3 regulate neurogenesis in a complementary manner and ID factors can induce NSC maintenance and quiescence in the absence of Notch. Our analyses unveil key molecular interactions underlying NSC maintenance and mechanistic differences between embryonic and adult neurogenesis. Similar Notch and ID factor interactions may be crucial in other stem cell systems.

Keywords: Computational biology; Id transcription factors; Neural stem cells; Neurogenesis; Notch signaling.


Conflict of interest statement

Competing interestsThe authors declare no competing or financial interests.

Figures

Fig. 1.
Fig. 1.
The NSC differentiation processes in the embryonic and adult brain and its regulatory network. (A) NSC fate in the embryonic and adult brain is dependent on the levels of proneural transcription factor expression. During embryonic neurogenesis, the majority of the NSCs are in a mitotically active state (aNSC) while a few will enter quiescence (qNSC) and remain inactive until adulthood. In the adult neurogenic niches, most NSCs are mitotically inactive (qNSC) and rarely transit to the mitotically active, neurogenic state (aNSC). In aNSCs, low levels of proneural activity drive cell cycle progression but is insufficient to induce differentiation. In the absence of proneural transcription factor activity, NSCs are quiescent (qNSC) and high proneural transcription factor activity drives neural differentiation (Diff). (B) The Notch-Hes-Proneural transcription factor interaction network. Notch signaling through the DNA-binding protein Rbpj activates expression of Hes genes. Hes protein homodimers repress proneural gene expression, including Ascl1 and Neurog2 via N-box and class-C sites, and their own expression by binding to N-box sites in their promotor regions. Proneural transcription factors activate cell cycle progression and differentiation via E-box sites. (C) The current known Notch-Hes-IDs-proneural interactions. IDs form heterodimers with Hes transcription factors, which are unable to bind to N-box sites but can bind to class-C sites, although with lower efficiency than Hes homodimers. IDs also form heterodimers with proneural factors that are unable to activate the differentiation and cell cycle progression genes.
Fig. 2.
Fig. 2.
Notch-Hes-Proneural regulatory module can regulate NSC differentiation but cannot drive NSCs into quiescence. (A) Hes mRNA levels oscillate with a periodicity of ∼140 min. (B) A minimum activation of gene expression is required for oscillatory behavior, which is induced in response to a large range of Notch signal activation. Upper and lower curves represent the maximum and minimum expression levels of Hes mRNA during the oscillations (as indicated by the red and green circles, respectively). Dashed curve represents the temporal average expression of Hes mRNA. The mean expression level of Hes mRNA does not change dramatically in the oscillatory region of expression, irrespective of the levels of Notch signal activity. (C) Expression level of proneural genes as a function of Notch signaling activity. Proneural gene expression becomes oscillatory at the same level of Notch signal due to the oscillatory expression of Hes factors. (D) Predictions of proneural gene expression and NSC fate at different levels of Notch signal and Hes mRNA production rate. Changes in Hes basal production rate have little effect on proneural gene expression (blue to red heat map) at any given level of Notch signal. Low Notch signal activity leads to high proneural expression (red) and this results in NSC differentiation (Diff). In contrast, high Notch activity leads to low-intermediate levels of proneural expression (light blue) leading to active, proliferative NSCs (aNSC). Production rates are in mRNA/min and the yellow circle indicates the standard value determined experimentally and used in all simulations (see Material and Methods).
Fig. 3.
Fig. 3.
Release of Hes auto-repression drives complete repression of proneural expression. (A) Period of oscillations of Hes expression for different values of Notch signal and Hes protein half-life. White area indicates the region where Hes does not oscillate (sustained expression). Yellow circle indicates the standard value used in all simulations. (B) Proneural expression levels for different values of Notch signal and Hes protein half-life. Low Notch activity leads to NSC differentiation (Diff), whereas high Notch activity maintains NSCs active/proliferative (aNSC). Changes in Hes protein degradation have little effect on proneural expression. (C) Period of oscillations of Hes expression and (D) proneural expression levels for different values of Notch signal and intronic delay. Low Notch activity leads to NSC differentiation (Diff), whereas high Notch activity maintains NSCs active/proliferative (aNSC). Changes in intronic delay have little effect on proneural expression. (E) Period of oscillations of Hes expression and (F) proneural expression levels for different values of Notch signal and Hes auto-repression. Release of Hes auto-repression, together with high Notch activity, can drive complete repression of proneural activity, leading to NSC quiescence (qNCS).
Fig. 4.
Fig. 4.
Combined effect of Notch and IDs can drive NSC differentiation, proliferation and quiescence. (A) Expression level of Hes mRNA for different levels of ID expression in the presence of constant Notch activity (I=500 molecules). (B) Expression level of Hes mRNA relative to different levels of ID expression and Notch activity. (C) Expression level of proneural factor mRNAs for different values of ID expression in the presence of constant Notch activity. (D) Levels of proneural factor activity (protein level) for different levels of Notch activity and ID expression. IDs potentiate the effect of Notch signaling by releasing Hes auto-repression and can act in concert with Notch, forming a three-way switch that segregates NSCs into quiescent (qNSC) (high IDs), proliferative/active (aNSC) (low IDs, high Notch/Hes) or differentiated (Diff) (low IDs, low Notch/Hes). The oscillatory region is presented in Fig. S2.
Fig. 5.
Fig. 5.
Expression pattern of adult NSCs at the single-cell level and mechanistic interplay between Notch/Hes and IDs. (A) Single cells from adult murine brain are represented based on their levels of Hes (Hes1, Hes5) and Id3 (Llorens-Bobadilla et al., 2015). Color code represents three subpopulations of NSCs: Id3+Hes−, Id3+Hes+ and Id3−Hes+; and transient amplified progenitors (TAP) cells. (B) Expression level of NSC markers (Slc1a3, Nr2e1, Sox9, Vcam1), active NSC/progenitor markers (Ascl1, Fos, Egr1, Sox4, Sox11) and Delta ligands (Dll1, Dll3, Dll4) for different populations of NSCs and TAP cells. NSC markers and active NSC/progenitor markers were chosen based on the analysis of the expression profile of adult NSCs (Llorens-Bobadilla et al., 2015). (C) Schematic representation of adult neurogenesis based on the modeling presented in Fig. 4D and on experimental results presented in B. High levels of IDs drive NSC quiescence. By decreasing IDs, the NSC become proliferative and stimulate the expression of the Notch ligand Delta. Notch-Delta lateral inhibition segregates neighboring active NSCs into high and low Notch signal. While the NSC with low Notch differentiates into a TAP cell, the NSCs with high Notch remain proliferative and can go another round of differentiation. Similar results are found using Id2 instead of Id3, or considering all IDs (Id1-Id4) together, and for an alternative choice of NSC and proliferative markers (Figs S5-8).
Fig. 6.
Fig. 6.
Hes and IDs expression profile in mouse and human NSCs during embryonic brain development. (A) PCA representation of single cells from the murine embryo (Kawaguchi et al., 2008). Color represents the expression levels of Hes genes (Hes1, Hes5) and radial glia (embryonic NSC) markers (Slc1a3, Pax6, Sox2, Pdgfd, Gli3). (B) Color represents the expression level of Id1-Id4 genes (log2 scale). (C) PCA representation of single cells from the ventricular zone of the human embryo (Pollen et al., 2015). Color represents the expression levels of Hes genes (Hes1, Hes5) and radial glia markers (Slc1a3, Pax6, Sox2, Pdgfd, Gli3). (D) Color represents the expression level of Id1-Id4 genes (log2 scale).

References

    1. Andersen J., Urbán N., Achimastou A., Ito A., Simic M., Ullom K., Martynoga B., Lebel M., Göritz C., Frisén J. et al. (2014). A transcriptional mechanism integrating inputs from extracellular signals to activate hippocampal stem cells. Neuron 83, 1085-1097. 10.1016/j.neuron.2014.08.004 - DOI - PMC - PubMed
    1. Ay A., Knierer S., Sperlea A., Holland J. and Ozbudak E. M. (2013). Short-lived Her proteins drive robust synchronized oscillations in the zebrafish segmentation clock. Development 140, 3244-3253. 10.1242/dev.093278 - DOI - PubMed
    1. Ay A., Holland J., Sperlea A., Devakanmalai G. S., Knierer S., Sangervasi S., Stevenson A. and Ozbudak E. M. (2014). Spatial gradients of protein-level time delays set the pace of the traveling segmentation clock waves. Development 141, 4158-4167. 10.1242/dev.111930 - DOI - PMC - PubMed
    1. Baek J. H., Hatakeyama J., Sakamoto S., Ohtsuka T. and Kageyama R. (2006). Persistent and high levels of Hes1 expression regulate boundary formation in the developing central nervous system. Development 133, 2467-2476. 10.1242/dev.02403 - DOI - PubMed
    1. Bai G., Sheng N., Xie Z., Bian W., Yokota Y., Benezra R., Kageyama R., Guillemot F. and Jing N. (2007). Id sustains Hes1 expression to inhibit precocious neurogenesis by releasing negative autoregulation of Hes1. Dev. Cell 13, 283-297. 10.1016/j.devcel.2007.05.014 - DOI - PubMed

Publication types

LinkOut - more resources