. 2017 Oct 1;144(19):3533-3546.
doi: 10.1242/dev.155598.

An essential role for IGF2 in cartilage development and glucose metabolism during postnatal long bone growth

Affiliations

An essential role for IGF2 in cartilage development and glucose metabolism during postnatal long bone growth

Tomoya Uchimura et al. Development. .

Abstract

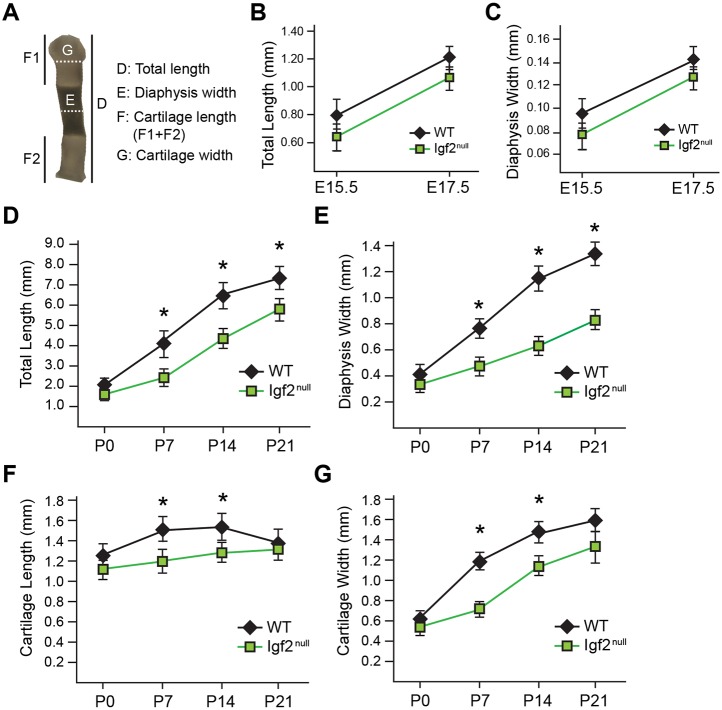
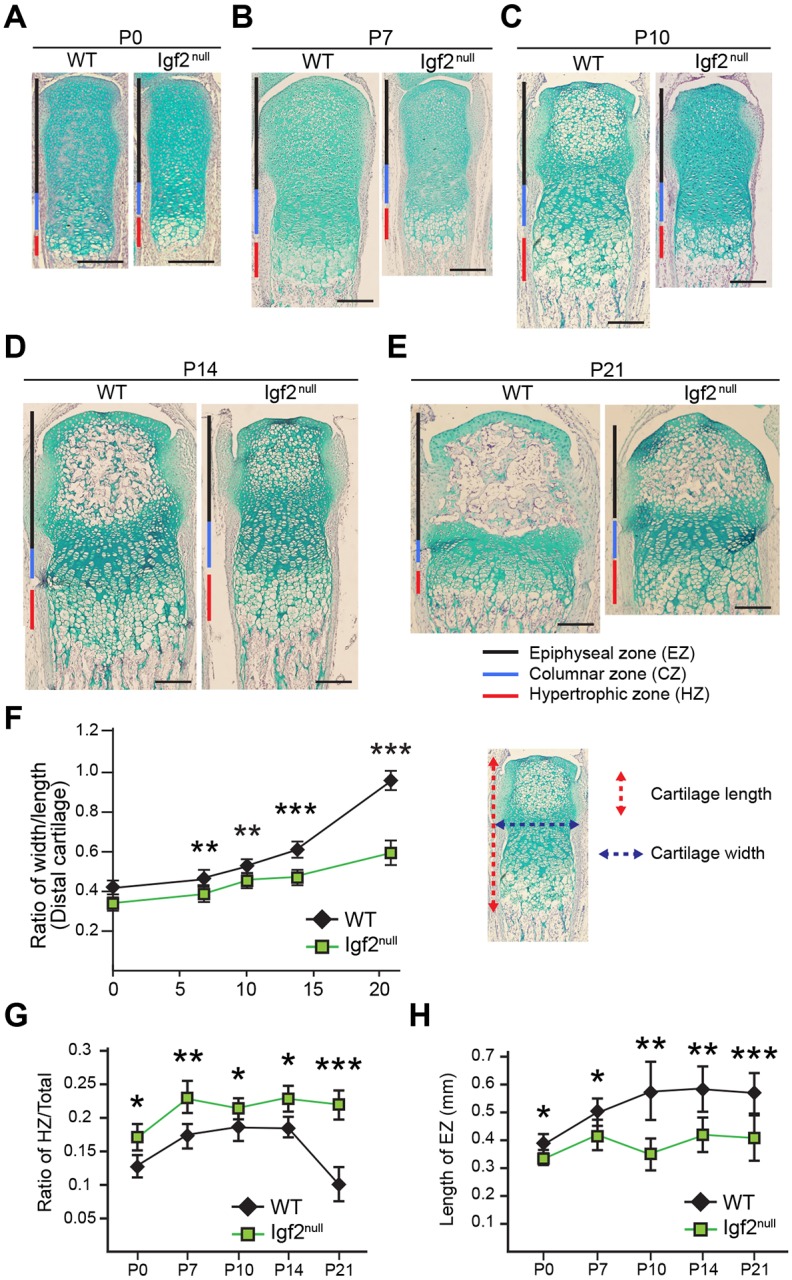
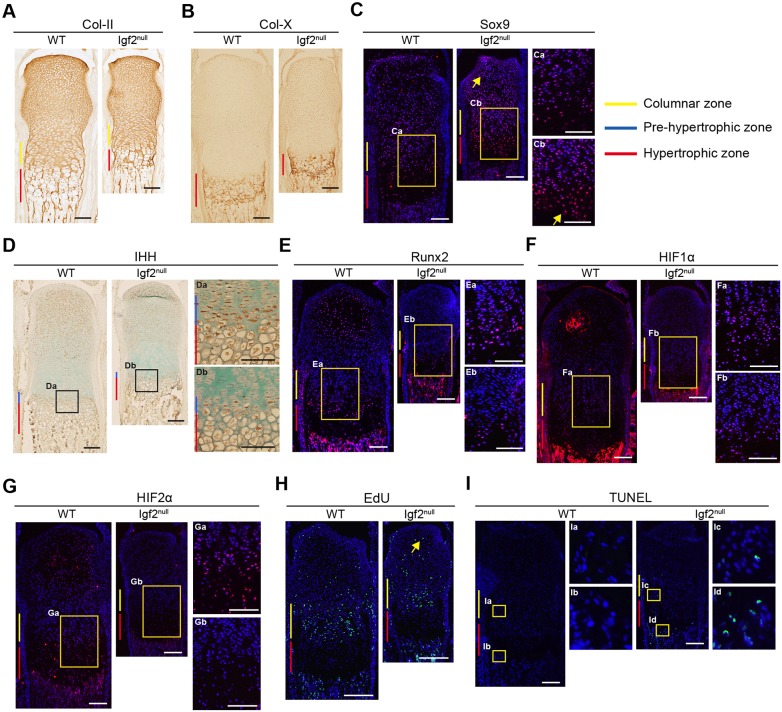
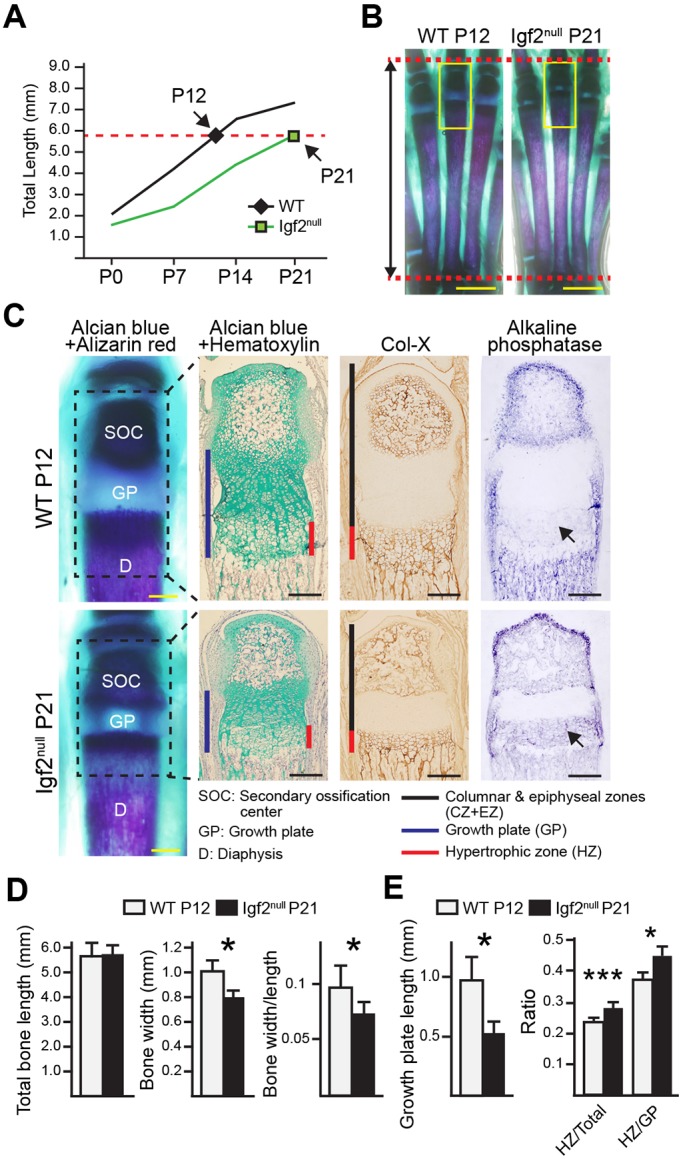
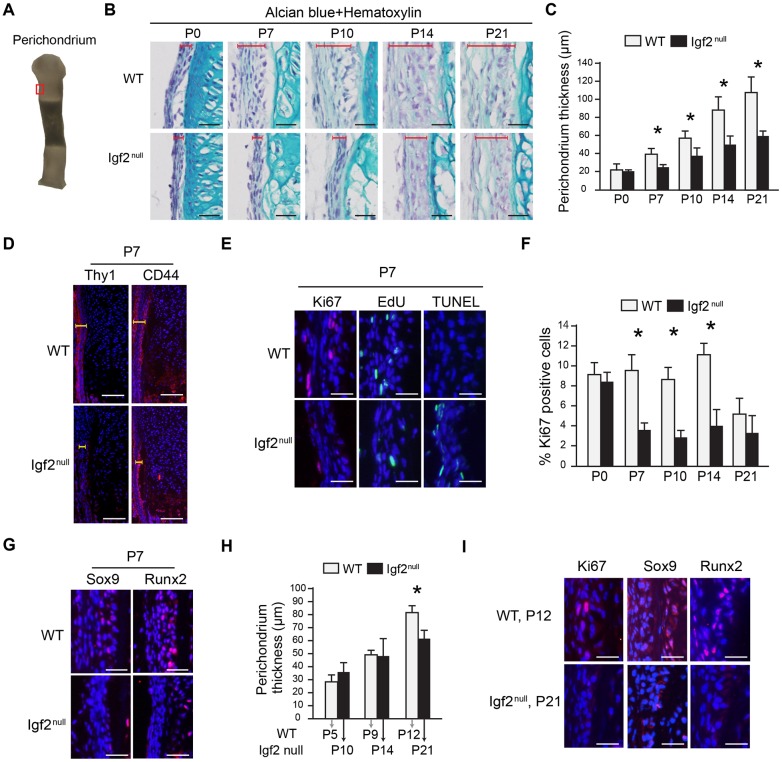
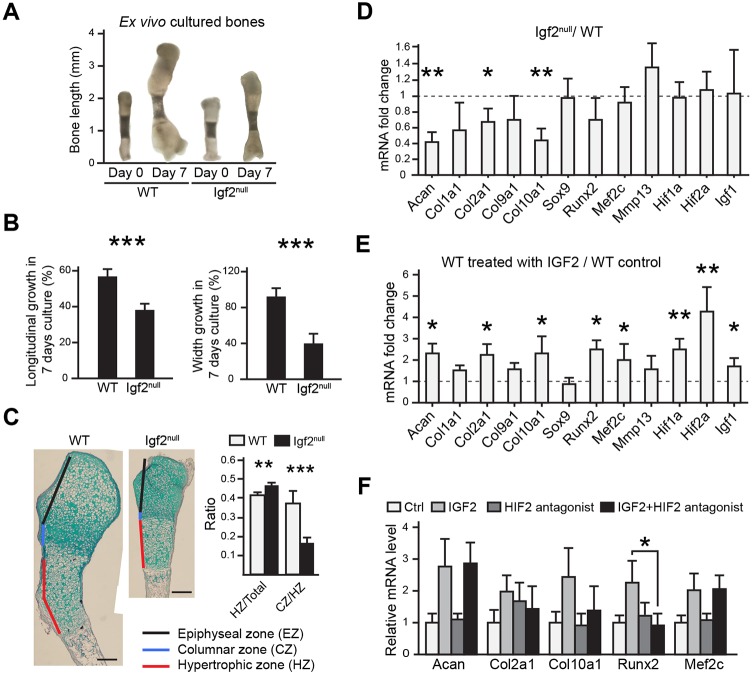
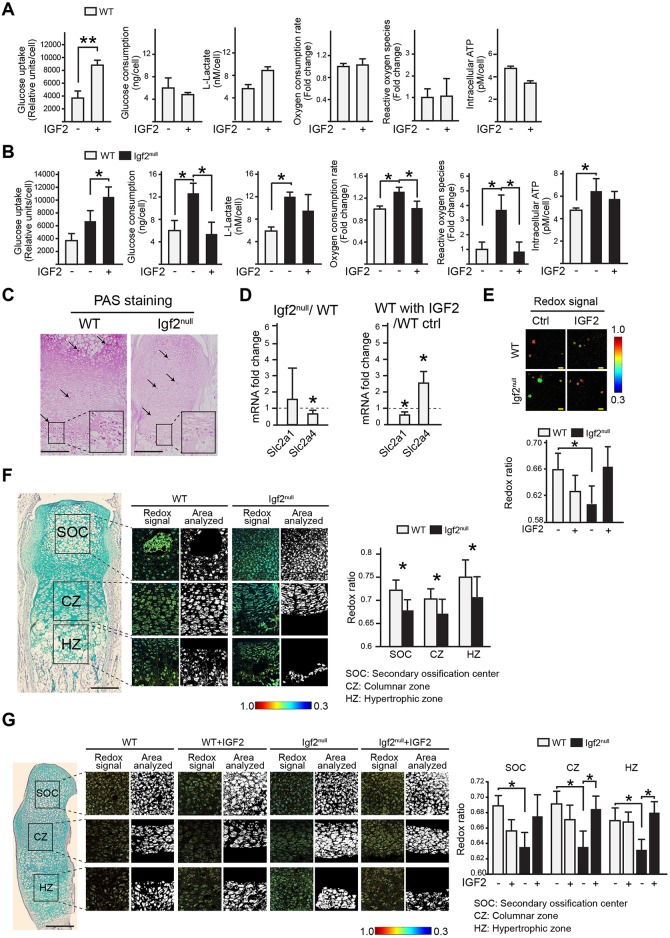
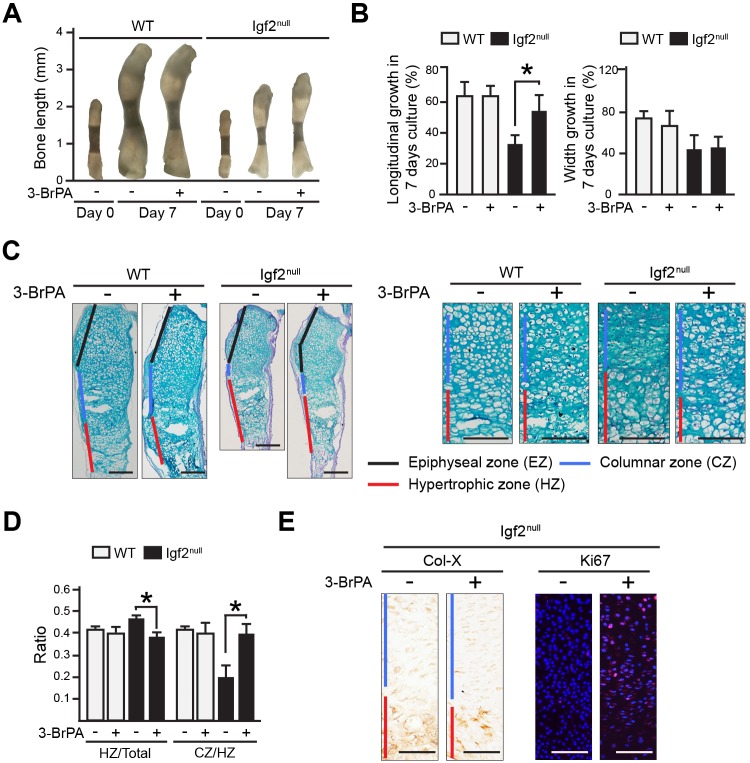
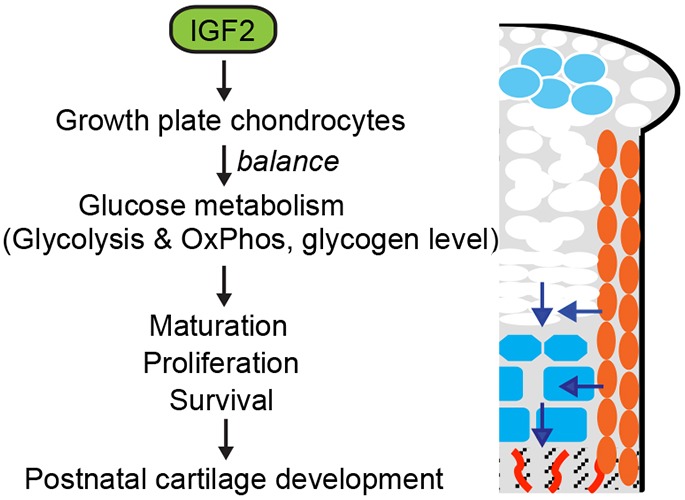
Postnatal bone growth involves a dramatic increase in length and girth. Intriguingly, this period of growth is independent of growth hormone and the underlying mechanism is poorly understood. Recently, an IGF2 mutation was identified in humans with early postnatal growth restriction. Here, we show that IGF2 is essential for longitudinal and appositional murine postnatal bone development, which involves proper timing of chondrocyte maturation and perichondrial cell differentiation and survival. Importantly, the Igf2 null mouse model does not represent a simple delay of growth but instead uncoordinated growth plate development. Furthermore, biochemical and two-photon imaging analyses identified elevated and imbalanced glucose metabolism in the Igf2 null mouse. Attenuation of glycolysis rescued the mutant phenotype of premature cartilage maturation, thereby indicating that IGF2 controls bone growth by regulating glucose metabolism in chondrocytes. This work links glucose metabolism with cartilage development and provides insight into the fundamental understanding of human growth abnormalities.

Keywords: Cartilage; Endochondral ossification; Glucose metabolism; Growth plate; IGF2; Postnatal.


Conflict of interest statement

Competing interestsThe authors declare no competing or financial interests.

Figures

Fig. 1.
Fig. 1.
Igf2 null mutants exhibit abnormalities in postnatal metatarsal bone growth. (A) Parameters used in metatarsal bone measurement. The darker area in the diaphysis indicates mineralized bone and calcified cartilage. Note that the same image is used in Fig. 5A. (B) Comparison of bone length between WT and Igf2 null bones at E15.5 and E17.5. (C) Comparison of bone width between WT and Igf2 null bones at E15.5 and E17.5. (D-G) Comparison of total bone length (D), bone width at diaphysis (E), length of the cartilage portion at metaphysis (F) and width of the cartilage portion at metaphysis (G) in WT and Igf2 null bones at postnatal stages P0-P21. At least eight embryonic bones/group and six postnatal bones/group were analyzed. Mean±s.d. *P<0.05 (unpaired t-tests between WT and Igf2 null).
Fig. 2.
Fig. 2.
Igf2 null mutant metatarsal bones have abnormal growth plate architecture and delayed secondary ossification center formation in postnatal development. (A-E) Alcian Blue and Hematoxylin staining of the cartilage portion from the distal end of the middle metatarsal bone at P0, 7, 10, 14 and 21. Red, blue and black bars indicate the hypertrophic zone (HZ), the columnar zone (CZ) and the epiphyseal zone (EZ), respectively. (F) Comparison of width/length ratio of the cartilage template between WT and Igf2 null bones. The length is the sum of the lengths of HZ, CZ and EZ. (G) Comparison of the ratio of the HZ in the cartilage template (HZ/total) between WT and Igf2 null bones. (H) Comparison of EZ length between WT and Igf2 null bones. Scale bars: 200 µm. At least six bones/group were analyzed. Mean±s.d. *P<0.05, **P<0.01, ***P<0.001 (unpaired t-tests between WT and Igf2 null).
Fig. 3.
Fig. 3.
Histological analysis of the growth plate of WT and Igf2 null metatarsal bones at P7. (A-G) Collagen II (Col-II) (A), collagen X (Col-X) (B), Sox9 (C), IHH (D), Runx2 (E), HIF1α (F) and HIF2α (G) IHC. Arrows in C indicate areas with abundant Sox9-positive cells in the Igf2 null compared with the WT [hypertrophic zone and the secondary ossification center (SOC)]. (H) EdU incorporation. The arrow indicates EdU-positive cells in the SOC of the Igf2 null bone. (I) TUNEL assay. Arrows indicate TUNEL-positive cells in the proliferating zone as well as the hypertrophic zone in the Igf2 null bone. Boxed areas are magnified as indicated. At least six bones/group were analyzed. Scale bars: 200 µm.
Fig. 4.
Fig. 4.
Histological analysis of length-matched Igf2 null and WT metatarsal bones. (A) P21 Igf2 null bones and P12 WT bones were length-matched pairs. (B) Whole-mount Alizarin Red/Alcian Blue staining images. Scale bars: 2 mm. (C) Magnified images of the boxed areas in B. Black dashed lined squares indicate the area for which Alcian Blue/Hematoxylin, collagen X and alkaline phosphatase (AP) staining is shown to the right. Arrows indicate areas with positive AP activity. Scale bars: 200 μm. (D) Analysis of total bone length, bone width, and the ratio of bone width/length in Igf2 null and WT bones. (E) Analysis of growth plate (GP) length and ratios of hypertrophic zone (HZ)/total (length of the cartilage portion) and HZ/GP in the cartilage template. At least six bones/group were analyzed. Mean±s.d. *P<0.05, ***P<0.001 (unpaired t-tests between WT and Igf2 null).
Fig. 5.
Fig. 5.
Histological analysis of the perichondrium in the Igf2 null and the WT metatarsal bone in postnatal stages. (A) Area of the perichondrium focused in histological analysis (red rectangle). Note that this is the same image as shown in Fig. 1A. (B) Comparison of perichondrium thickness between the Igf2 null and the WT using histological sections. Red brackets indicate the thickness of perichondrium. (C) Quantification of perichondrium thickness from P0 to P21. (D) IHC analysis of Thy1 and CD44 of the Igf2 and WT perichondrium at P7. Yellow brackets indicate the thickness of perichondrium. (E) IHC of Ki67, EdU incorporation, and TUNEL staining in the perichondrium. (F) Quantification on the percentage of Ki67-positive cells in the perichondrium. (G) IHC of Sox9 and Runx2 in the cartilage template. (H) Quantification of perichondrium thickness in metatarsal bones of the same length. (I) IHC of Ki67, Sox9 and Runx2 in metatarsal bones of P12 WT and P21 Igf2 null mice. Scale bars: 50 µm in all histographs. At least six bones/group were analyzed. At least three repeats were performed. Mean±s.d. *P<0.05 (unpaired t-tests between WT and Igf2 null).
Fig. 6.
Fig. 6.
Ex vivo bone organ culture and in vitro chondrocyte analyses of the Igf2 null bone. (A) Representative images of metatarsal bones of WT and Igf2 null after 7 days of ex vivo culture. (B) Percentage of growth in length and width of metatarsal bones after 7 days of culture. (C) Alcian Blue and Hematoxylin staining of the metatarsal bones after 7 days of culture. The ratio of the lengths of hypertrophic zone (HZ)/total length of the cartilage template, as well as the ratio of the columnar zone (CZ)/HZ between the WT and Igf2 null bones were compared. For A-C, at least ten bones were analyzed for each group (WT and Igf2 null). Scale bars: 200 μm. (D) RT-qPCR analysis of Igf2 null and WT epiphyseal chondrocytes after 1 week of culturing in alginate beads. Data are presented as the ratio of Igf2 null/WT gene expression. (E) RT-qPCR analysis of epiphyseal chondrocytes treated with exogenous 10 ng/ml IGF2 and cultured in 3D alginate beads for 1 week. Data are presented as the ratio of gene expression from IGF2 treatment versus non-treated control in WT chondrocytes. (F) RT-qPCR analysis of selected genes after the treatment with an HIF2α inhibitor, HIF2 antagonist 2. For D-F, the experiments were conducted with biological triplicates and repeated three times. Mean±s.d. *P<0.05, **P<0.01, ***P<0.001 (D,E: unpaired t-test between WT and Igf2 null; F: ANOVA followed by Dunnett's test).
Fig. 7.
Fig. 7.
Igf2 null chondrocytes have altered glucose metabolism. (A,B) Analysis of glucose uptake in chondrocytes at day 7 of culture, total glucose consumption after 7 days of culture, L-lactate levels, oxygen consumption rates (OCR), reactive oxygen species (ROS), and intracellular ATP levels at day 7 of culture in WT and Igf2 null in the absence or presence of IGF2. (C) PAS staining images of the metatarsal bones of P10 WT and Igf2 null sections. Arrows indicate punctate PAS-positive staining areas indicating glycogen deposits. The diffuse staining reflects other polysaccharides in the cartilage matrix (see Fig. S6). The magnified areas indicate intense PAS staining in the prehypertrophic zone. (D) RT-qPCR analysis of glucose transporters GLUT1 and GLUT4 in Igf2 null and WT epiphyseal chondrocytes after 1 week of culturing in alginate beads, or WT chondrocytes treated with 10 ng/ml of IGF2. Data are presented as the ratio of Igf2 null/WT gene expression, and the ratio of gene expression from IGF2 treatment versus non-treated control in WT chondrocytes, respectively. (E) Analysis of optic redox ratios FAD/(FAD+NADH) of epiphyseal chondrocytes. (F) Analysis of optic redox ratios FAD/(FAD+NADH) in the columnar zone (CZ), hypertrophic zone (HZ) and secondary ossification center (SOC) using sections of the WT and Igf2 null bones. Mineralized areas in SOC and HZ were not analyzed owing to their endogenous fluorescence. (G) Analysis of optical redox ratios FAD/(FAD+NADH) of chondrocytes using sections of WT and Igf2 null newborn bones cultured in the absence or presence of 10 ng/ml IGF2 for 7 days. Three mice/genotype and four sections/mouse were analyzed. Mean±s.d. *P<0.05 (A,B,D,E,G: ANOVA followed by Dunnett's test; F: unpaired t-test between WT and Igf2 null). Scale bars: 200 µm (C,F,G); 50 µm (E).
Fig. 8.
Fig. 8.
Attenuating glycolysis rescues the phenotype of Igf2 null bones. (A) Representative images of ex vivo WT and Igf2 null metatarsal bones cultured in the absence or presence of 1 µM glycolysis inhibitor 3-BrPA for 7 days. (B) Percentage of growth of metatarsal bones after 7 days of culture. (C) Alcian Blue and Hematoxylin staining of the metatarsal bones after 7 days of culture. Magnified views of the proliferation and hypertrophic zones of the growth plate are presented on the right. (D) The ratio of the lengths of hypertrophic zone (HZ)/total length of the cartilage template, as well as the ratio of the columnar zone (CZ)/HZ between the WT and Igf2 null bones were compared. Six bones/group were analyzed. (E) Images of IHC for Col-X and Ki67 in Igf2 null metatarsal bones grown the absence or presence of 3-BrPA. In C and E, red, blue and black bars indicate the hypertrophic zone (HZ), the columnar zone (CZ) and the epiphyseal zone (EZ), respectively. Scale bars: 200 µm. Mean±s.d. At least three repeats were performed. *P<0.05 (ANOVA followed by Dunnett's test).
Fig. 9.
Fig. 9.
Model of the role of IGF2 in regulating postnatal bone growth. IGF2 maintains the balance of glycolysis and glucose metabolism, as wells as glycogen levels, controlling the pace of hypertrophic differentiation and chondrocyte cell survival and cell proliferation during postnatal long bone growth. Blue represents hypertrophic chondrocytes; orange represents periochondrial cells. Arrows indicate direction of movement as cells mature.

References

    1. Adeva-Andany M. M., González-Lucán M., Donapetry-García C., Fernández-Fernández C. and Ameneiros-Rodriguez E. (2016). Glycogen metabolism in humans. BBA Clin 5, 85-100. 10.1016/j.bbacli.2016.02.001 - DOI - PMC - PubMed
    1. Akiyama H., Chaboissier M. C., Martin J. F., Schedl A. and de Crombrugghe B. (2002). The transcription factor Sox9 has essential roles in successive steps of the chondrocyte differentiation pathway and is required for expression of Sox5 and Sox6. Genes Dev. 16, 2813-2828. 10.1101/gad.1017802 - DOI - PMC - PubMed
    1. Amarilio R., Viukov S. V., Sharir A., Eshkar-Oren I., Johnson R. S. and Zelzer E. (2007). HIF1alpha regulation of Sox9 is necessary to maintain differentiation of hypoxic prechondrogenic cells during early skeletogenesis. Development 134, 3917-3928. 10.1242/dev.008441 - DOI - PubMed
    1. Araldi E. and Schipani E. (2010). Hypoxia, HIFs and bone development. Bone 47, 190-196. 10.1016/j.bone.2010.04.606 - DOI - PMC - PubMed
    1. Baker J., Liu J.-P., Robertson E. J. and Efstratiadis A. (1993). Role of insulin-like growth factors in embryonic and postnatal growth. Cell 75, 73-82. 10.1016/S0092-8674(05)80085-6 - DOI - PubMed

Publication types

MeSH terms

LinkOut - more resources