. 2017 Oct 3;7(1):12582.
doi: 10.1038/s41598-017-12692-x.

Succinate promotes stem cell migration through the GPR91-dependent regulation of DRP1-mediated mitochondrial fission

Affiliations

Succinate promotes stem cell migration through the GPR91-dependent regulation of DRP1-mediated mitochondrial fission

So Hee Ko et al. Sci Rep. .

Erratum in

Abstract

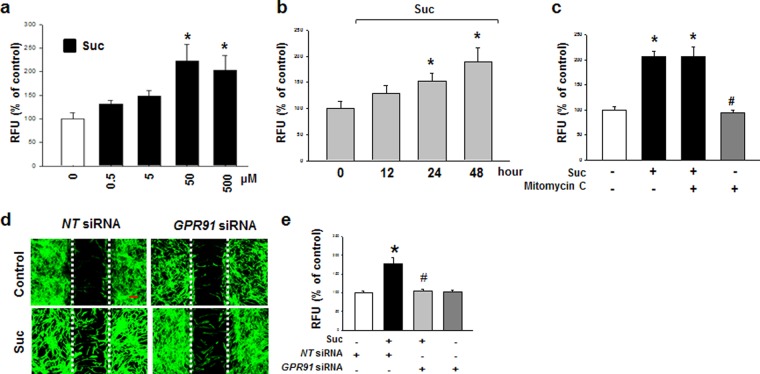
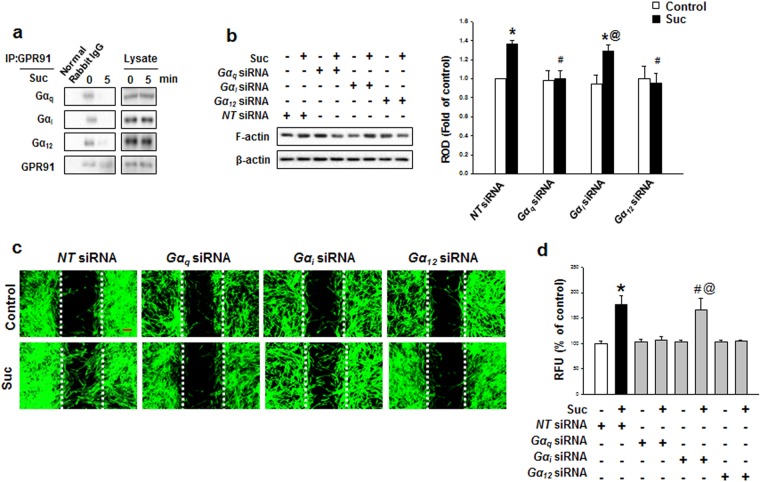
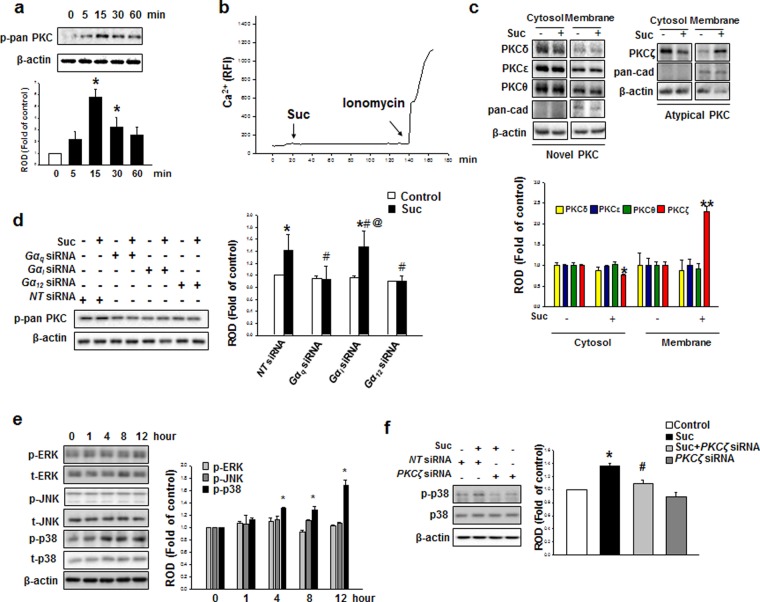
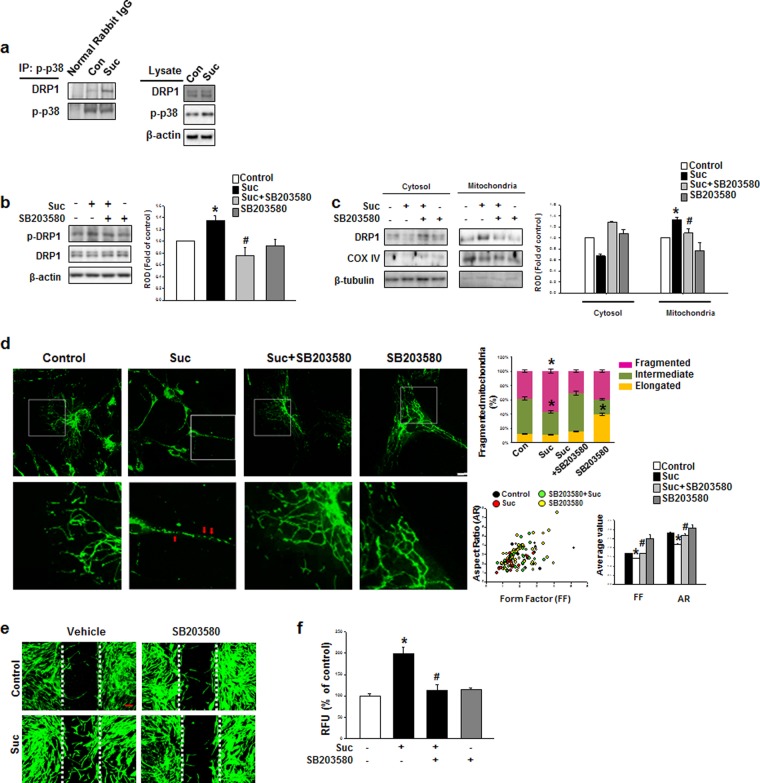
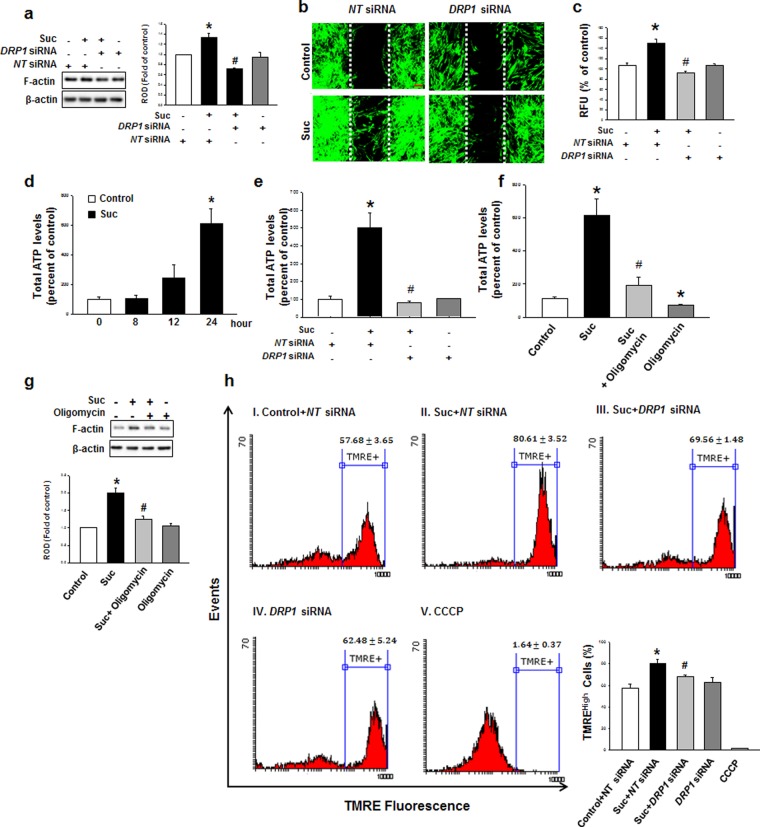
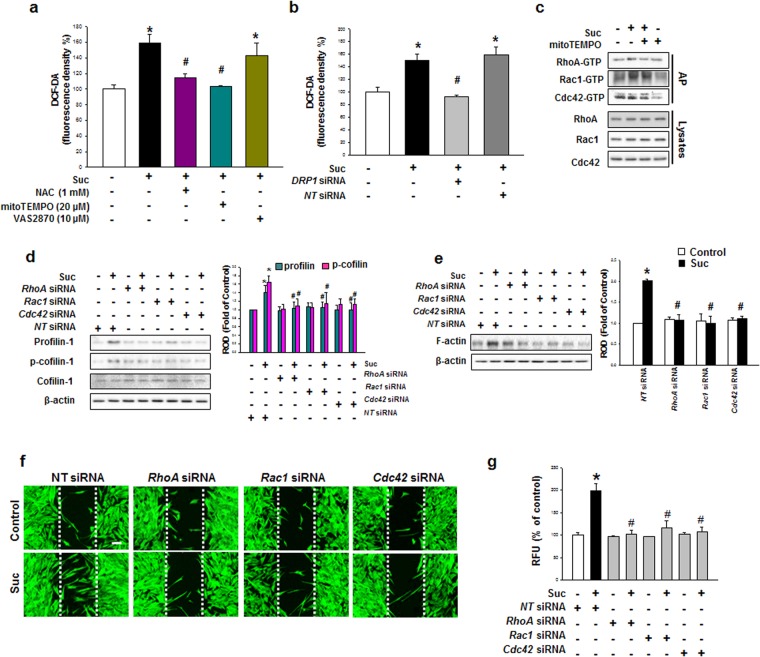
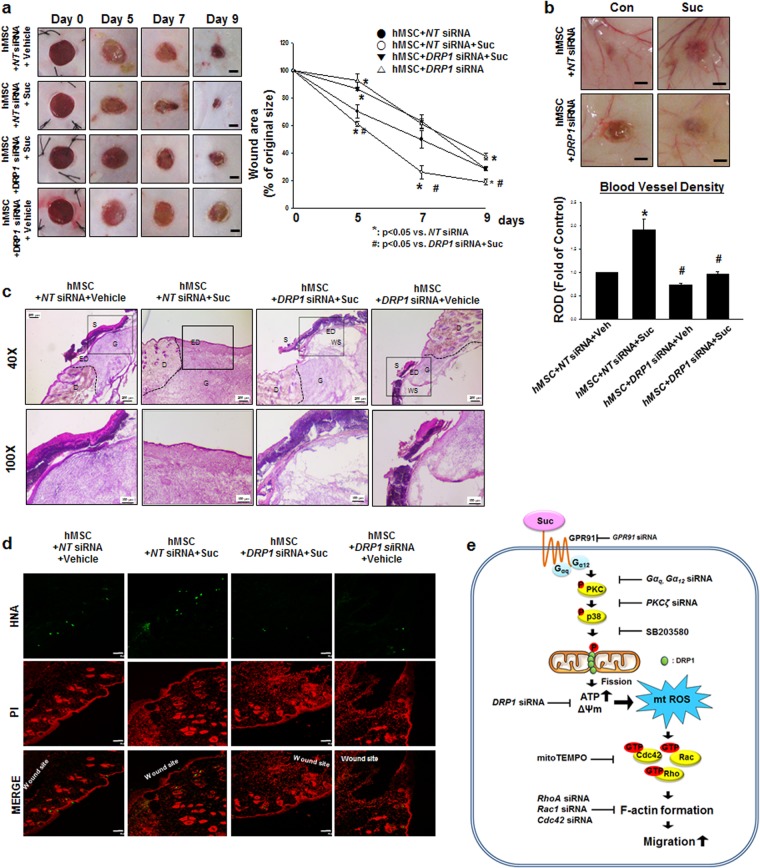
The role of metabolites produced from stem cell metabolism has been emerged as signaling molecules to regulate stem cell behaviors such as migration. The mitochondrial morphology is closely associated with the metabolic balance and stem cell function. However, the physiological role of succinate on human mesenchymal stem cell (hMSC) migration by regulating the mitochondrial morphology remains unclear. Here, we investigate the effect of succinate on hMSC migration via regulation of mitochondrial dynamics and its related signaling pathway. Succinate (50 μM) significantly accelerates hMSC migration. Succinate increases phosphorylation of pan-PKC, especially the atypical PKCζ level which was blocked by the knockdown of Gαq and Gα12. Activated PKCζ subsequently phosphorylates p38 MAPK. Cytosolic DRP1 is phosphorylated by p38 MAPK and results in DRP1 translocation to the mitochondria outer membrane, eventually inducing mitochondrial fragmentation. Mitochondrial fission-induced mitochondrial function elevates mitochondrial ROS (mtROS) levels and activates Rho GTPases, which then induces F-actin formation. Furthermore, in a skin excisional wound model, we found the effects of succinate-pretreated hMSC enhanced wound closure, vascularization and re-epithelialization and confirmed that DRP1 has a vital role in injured tissue regeneration. Overall, succinate promotes DRP1-mediated mitochondrial fission via GPR91, consequently stimulating the hMSC migration through mtROS-induced F-actin formation.


Conflict of interest statement

The authors declare that they have no competing interests.

Figures

Figure 1
Figure 1
Effect of succinate on hMSC migration. (a) Dose responses of succinate in Oris cell migration assay were shown. Data represent the mean ± SEM. n = 4, *p < 0.05 versus control. (b) Time responses of succinate in Oris™ cell migration assay were shown. Data represent the mean ± SEM. n = 4. *p < 0.05 versus control. (c) Effect of mitomycin C in succinate-induced hMSC migration. Cells were treated with mitomycin C (1 μg/ml) for 90 min before succinate exposure. Data represent the mean ± SEM. n = 4. *p < 0.01 versus control. #p < 0.05 versus succinate alone. (d) To determine whether GPR91 involved in the succinate-induced hMSC migration, GPR91 siRNA were transfected. Cells were stained with phalloidin AlexaFlour 488 (Green) to identify the migrated cells. Scale bar = 50 μm, magnification; ×80. (e) hMSC migration quantified with Oris cell migration assay was shown. Data indicate means ± SEM. n = 4, *p < 0.05 versus NT siRNA transfected cells, #p < 0.01 versus succinate with NT siRNA transfected sample. Abbreviations: RFU, relative fluorescence units.
Figure 2
Figure 2
Involvements of GPR91 and and Gα complex in succinate-induced hMSC migration. (a) hMSC were treated with succinate for 5 min. GPR91 co-immunoprecipitated with Gαq, Gαi, and Gα12 and the level of each protein is shown. (b) q, i, and 12 siRNA transfected to hMSC prior to treatment of succinate for 24 hrs. Cells were harvested for western blotting using anti-F-actin antibody. Data represent the mean ± SEM. n = 3. *p < 0.01 versus control, #p < 0.05 versus succinate treated cell, @p < 0.05 versus i siRNA alone. (c) Cells were transfected with Gα complex siRNA prior to exposure to succinate and then Wound healing assay was performed to identify succinate-induced cell migration. Scale bar = 50 μm, magnification; ×80. (d) Gα complex siRNA transfected hMSC migration was quantified with Oris™ cell migration assay. Data represent the mean ± SEM. n = 3, *p < 0.05 versus control, #p < 0.01 versus succinate alone, @p < 0.01 versus i siRNA alone. Abbreviations: RFU, relative fluorescence units; ROD, relative optical density.
Figure 3
Figure 3
Succinate-induced PKC phosphorylation involved in p38 MAPK activation. (a) The cells were incubated with succinate (50 μM) and then harvested. Total protein was analyzed by western blotting with phospho PKC antibodies. Data represent the mean ± SEM. n = 3, *p < 0.05 versus control. (b) Cells were stained with Fluo-3AM (2 mM) for 40 min and treated with succinate. Ionomycin (10 μM) was used as positive control. The changes of Fluo-3AM fluorescence were represented in relative fluorescence intensity (RFI, F/F0%, arbitrary unit). (c) Cells were treated with succinate for 15 min and harvested for cytosolic/membrane fractionation. Translocation of PKC was detected with novel PKC and atypical PKC antibodies. Data represent the mean ± SEM. n = 3. *p < 0.05 versus cytosolic control. **p < 0.05 versus membrane part control. (d) Cells were transfected with q, i, and 12 siRNA prior to succinate exposure for 15 min and then harvested for western blot analysis with detecting p-pan PKC. Data represent the mean ± SEM. n = 3, *p < 0.05 versus control, #p < 0.05 versus hMSC with succinate, @p < 0.05 versus i siRNA alone. (e) hMSCs were treated with succinate and then harvested for western blotting to show the phosphorylation of MAPKs. Data represent the mean ± SEM. n = 4, *p < 0.05 versus 0 time. (f) Cells were transfected with PKCζ siRNA prior to succinate exposure for 12 hr and then western blotting to show the phosphorylation of p38 MAPK. Data represent the mean ± SEM. n = 3, *p < 0.05 versus control, #p < 0.05 versus hMSC with succinate. Abbreviations: ROD, relative optical density.
Figure 4
Figure 4
Succinate-induced p38 MAPK activation regulates DRP1 phosphorylation. (a) Cells were treated with succinate for 12 hr and the total lysate were used for performing immunoprecipitation using normal rabbit IgG or p-p38 antibody to determine the protein binding. (b) hMSCs were with/without SB203580 (1 μM) for 30 min, and then exposed to succinate for 12 hr. The cell lysates were analyzed with western blotting, and detected with phospho-DRP1 antibody. Data denote the mean ± SEM. n = 3, *p < 0.05 versus control, #p < 0.05 versus succinate alone. (c) Cells were pretreated with SB203580 (1 μM) for 30 min before succinate treatment for 12 hr and lysate was performed for mitochondrial fractionation. Data represent the mean ± SEM. n = 3, *p < 0.05 versus control, #p < 0.05 versus succinate alone. (d) hMSCs were pre-treated with SB203580 (1 μM) for 30 min and then exposed to succinate and then loaded with MitoTracker Green (200 nM) for 30 min. Representative images were obtained by confocal microscopy. The individual mitochondrial length was assessed, classified into three different categories and quantified as percentage. Data denote the mean ± SEM. n = 10. Scale bar = 50 μm, magnification; ×200, *p < 0.05 versus control. (e) Cells were pretreated with SB203580 (1 μM) for 30 min prior to succinate exposure for 24 hr. After incubation, wound healing assay performed with phalloidin staining to identified migrating cell. Scale bar = 50 μm, magnification; ×80. (f) Migrated cells were quantified with Oris migration assay. Data represent the mean ± SEM. n = 3, *p < 0.05 versus control, #p < 0.05 versus succinate alone. Abbreviations: RFU, relative fluorescence units; ROD, relative optical density.
Figure 5
Figure 5
DRP1-mediated mitochondrial fission enhances mitochondrial ATP production. (a) DRP1 siRNA was transfected in hMSC before succinate treatment. After incubation with succinate, cells were analyzed by western blotting with anti-F-actin antibody. Data represent the mean ± SEM. n = 6, *p < 0.05 versus NT siRNA, #p < 0.05 versus succinate with NT siRNA. (b) Cells were cultured in ibidi confocal dish and transfected with DRP1 siRNA. Then cells were stained with phalloidin and observed with confocal microscopy. Scale bar = 50 μm, magnification; ×80. (c) Migrated cells were quantified with Oris migration assay. Data represent the mean ± SEM. n = 3, *p < 0.05 versus control, #p < 0.05 versus succinate with NT siRNA. (d) After incubation of hMSC with/without succinate, cells were lysed and reacted with ATP luciferase reagent. Then ATP levels were detected with luminometer. Data represent the mean ± SEM. n = 6. *p < 0.05 versus control. (e) Cells were transfected with DRP1 siRNA prior to succinate treatment. Total cellular ATP levels were analyzed using ATP assay kit to detect luminescent ATP. Data represent the mean ± SEM. n = 6, *p < 0.05 versus NT siRNA, #p < 0.05 versus succinate with NT siRNA. (f) hMSCs were pretreated with oligomycin before succinate treatment. Total ATP levels were represented mean ± SEM. n = 6. *p < 0.05 versus control, #p < 0.05 versus succinate. (g) hMSCs were treated with Oligomycin (1 μM) for 1 hr prior to expose to succinate. Cells were harvested subjected to western blot and detected using F-actin antibody. Data represent the mean ± SEM. n = 3, *p < 0.05 versus control, #p < 0.05 versus succinate. (h) hMSCs were treated with succinate for the indicated time, and mitochondrial memebrane potential was asscessed by TMRE staining. Mitochondrial membrane potential stained with TMRE (400 nM) was measured using FACS analysis (Total cell counts = 5 × 103 cells). CCCP (20 μM) treatment for 1 hr was used for negative control. Data represent the mean ± SEM. n = 3, *p < 0.05 versus control + NT siRNA, #p < 0.05 versus succinate + NT siRNA. Abbreviations: ROD, relative optical density.
Figure 6
Figure 6
Involvements of mtROS in F-actin formation. (a) hMSC was pretreated with NAC, mitoTEMPO and VAS2870 in and incubated with succinate. Then hMSC was stained with DCF-DA and ROS levels were measured using luminometer. Data represent the mean ± SEM. n = 3, *p < 0.01 versus control, #p < 0.05 versus succinate. (b) hMSC was transfected with DRP1 siRNA and treated with succinate for 24 hr. Data represent the mean ± SEM. n = 6, *p < 0.05 versus control, #p < 0.05 versus succinate. (c) hMSC was treated with mitoTEMPO (20 μM) prior to expose to 12 h succinate and the total lysates were incubated with agarose bead. The bound activated GTP-RhoA, GTP-Rac1, GTP-cdc42 were dectected with western blot analysis. (d) Cells were transfected RHO GTPases siRNA and then treated with succinate. Western blot performed to detect profilin, p-cofilin and cofilin protein expression. Data represent the mean ± SEM. n = 3, *p < 0.05 versus control with NT siRNA, #p < 0.05 versus succinate with NT siRNA. (e) RHO GTPases siRNA transfected cells were treated for 24 hr and F-actin protein expression was detected with western blotting. Data represent the mean ± SEM. n = 3, *p < 0.05 versus NT siRNA alone, #p < 0.05 versus succinate with NT siRNA. (f) hMSC was cultured with ibidi dish and transfected with RhoA, Rac1, and Cdc42 siRNA prior to 24 hr succinate treatment. Cells were stained with phalloidin and observed with confocal microscopy. (g) RHO GTPases siRNA-transfected cell was incubated with succinate and the hMSC migration was quantified with Oris migration assay. Data represent the mean ± SEM. n = 4, *p < 0.05 versus NT siRNA alone, #p < 0.05 versus succinate with NT siRNA. Abbreviations: ROD, relative optical density.
Figure 7
Figure 7
The role of DRP1 on skin wound healing in vivo. (a) Representative gross images of skin wound healing at day 0, 5, 7, and 9 are shown. Mouse skin wounds were surgically made by 6-mm-diameter biopsy punch and treated with hMSC + NT siRNA + vehicle, hMSC + NT siRNA + succinate, hMSC + DRP1 siRNA + succinate or hMSC + DRP1 siRNA + vehicle, respectively. (left panel). Wound healing was determined by assessing the percentage of wound closures relative to original wound size. Data represent mean ± SEM. n = 6, *p < 0.05 versus NT siRNA, #p < 0.05 versus DRP1 siRNA + succinate (right panel), Scale bars = 2 mm. (b) The quantified vascularity wound area at day 9 was shown. Data represent mean ± SEM. n = 6, *p < 0.05 versus hMSC with NT siRNA, #p < 0.05 versus hMSC with NT siRNA and succinate, Scale bars = 2 mm. (c) Representative wound tissues stained with H&E at day 9 were shown. n = 6, Scale bars = 200 μm or 100 μm, magnification; ×40 or ×100, respectively. (d) Engraftment of hMSCs on wound at day 9 was observed by using confocal microscopy. Human nuclear antigen (HNA, green) was used for hMSC nuclear staining. Propidium iodide (PI, red) was used for nuclear counter staining, Scale bars = 100 μm, magnification; ×100. (e) Hypothetical model for the effect of succinate on hMSC migration through mitochondrial fission. Succinate induced PKC phosphorylation through GPR91 activation. Then PKC activated p38 MAPKs and subsequently DRP1 phosphorylation. DRP1 phosphorylation caused mitochondrial fission and finally enhancement of mitochondrial ATP production and mitochondrial membrane potential. In result of increased mitochondrial functions, mtROS was produced and induced Rho GTPases activation. Finally, activated Rho GTPases caused F-actin formation to promote hMSC motility. Abbreviations: S, scab; D, dermis; ED, epidermis; G, granular tissue; WS, wound site; ΔΨm, mitochondrial membrane potential.

Similar articles

Cited by

References

    1. Folmes CDL, Terzic A. Energy metabolism in the acquisition and maintenance of stemness. Seminars in Cell & Developmental Biology. 2016;52:68–75. doi: 10.1016/j.semcdb.2016.02.010. - DOI - PMC - PubMed
    1. Lee HJ, et al. Novel Pathway for Hypoxia-Induced Proliferation and Migration in Human Mesenchymal Stem Cells: Involvement of HIF-1alpha, FASN, and mTORC1. Stem Cells. 2015;33:2182–2195. doi: 10.1002/stem.2020. - DOI - PubMed
    1. Buravkova LB, Andreeva ER, Gogvadze V, Zhivotovsky B. Mesenchymal stem cells and hypoxia: where are we? Mitochondrion. 2014;19(Pt A):105–112. doi: 10.1016/j.mito.2014.07.005. - DOI - PubMed
    1. Wanet A, Arnould T, Najimi M, Renard P. Connecting Mitochondria, Metabolism, and Stem Cell Fate. Stem Cells and Development. 2015;24:1957–1971. doi: 10.1089/scd.2015.0117. - DOI - PMC - PubMed
    1. Carey BW, Finley LW, Cross JR, Allis CD, Thompson CB. Intracellular alpha-ketoglutarate maintains the pluripotency of embryonic stem cells. Nature. 2015;518:413–416. doi: 10.1038/nature13981. - DOI - PMC - PubMed

Publication types

MeSH terms

LinkOut - more resources