. 2017 Oct 3;7(1):12575.
doi: 10.1038/s41598-017-12981-5.

Timing and localization of human dystrophin isoform expression provide insights into the cognitive phenotype of Duchenne muscular dystrophy

Affiliations

Timing and localization of human dystrophin isoform expression provide insights into the cognitive phenotype of Duchenne muscular dystrophy

Nathalie Doorenweerd et al. Sci Rep. .

Erratum in

Abstract

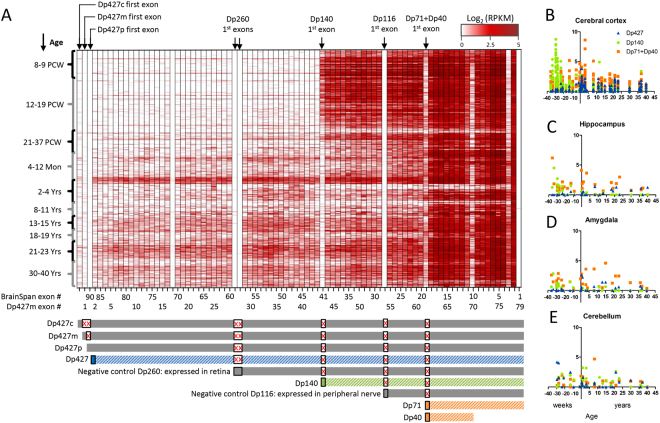
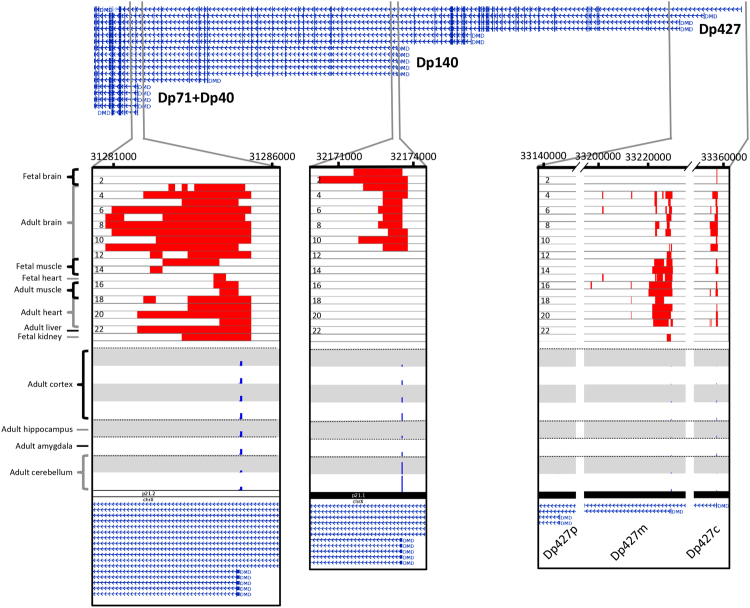
Duchenne muscular dystrophy (DMD) is a muscular dystrophy with high incidence of learning and behavioural problems and is associated with neurodevelopmental disorders. To gain more insights into the role of dystrophin in this cognitive phenotype, we performed a comprehensive analysis of the expression patterns of dystrophin isoforms across human brain development, using unique transcriptomic data from Allen Human Brain and BrainSpan atlases. Dystrophin isoforms show large changes in expression through life with pronounced differences between the foetal and adult human brain. The Dp140 isoform was expressed in the cerebral cortex only in foetal life stages, while in the cerebellum it was also expressed postnatally. The Purkinje isoform Dp427p was virtually absent. The expression of dystrophin isoforms was significantly associated with genes implicated in neurodevelopmental disorders, like autism spectrum disorders or attention-deficit hyper-activity disorders, which are known to be associated to DMD. We also identified relevant functional associations of the different isoforms, like an association with axon guidance or neuron differentiation during early development. Our results point to the crucial role of several dystrophin isoforms in the development and function of the human brain.


Conflict of interest statement

The authors declare that they have no competing interests.

Figures

Figure 1
Figure 1
Human dystrophin isoforms. Dystrophin isoforms derived from the DMD gene located on the X chromosome (GRCh37.p13, RefSeq Release 74: NG_012232.1). The vertical green dashes indicate individual exons. The full-length dystrophins (Dp427) have 79 exons, with isoforms starting at unique first exons. For some isoforms, multiple splice variants have been identified (indicated on the right-hand side). The shorter isoforms (relative to the full-length isoforms Dp427) have unique first exons (i.e. not included in any other isoform), with the exception of Dp71 and Dp40 which share a first exon but use alternative polyadenylation sites. The red boxes indicate the position of the promoter region of each isoform. The second exon of Dp427c,m,p was used to represent the full-length dystrophin as a group (indicated by a purple box). This figure was generated using the NCBI’s Sequence Viewer.
Figure 2
Figure 2
Dystrophin isoforms expression across brain development. (A) Dystrophin exons expression throughout brain development. The isoform unique first exons are indicated on top of the heatmap. The developmental stages are indicated on the left in post-conceptual weeks and months or years after birth. The BrainSpan atlas exon number is indicated below the heatmap together with the Dp427m exon numbering for reference. Bars below the heatmap indicate the different isoform groups. The grey bars corresponding to Dp427c,m,p are grouped together using exon 2 in further analysis (blue). The grey bars corresponding to Dp260 and Dp116 are expressed in the retina and peripheral nerves and are excluded from further analysis. The first exon of Dp140 (green) and Dp71 + Dp40 (orange) is used for further analysis. Boxes with a red ‘X’ indicate exons that are not part of the transcript. Expression values are presented as log2(RPKM). Brain region specific expression across development is shown for the cerebral cortex (B), hippocampus (C), amygdala (D) and cerebellum (E) of Dp427 (2nd exon), Dp140 (1st exon) and Dp71 + Dp40 (1st exon). PCW: post-conception week, Mon: months, Yrs: years.
Figure 3
Figure 3
DMD gene expression across the adult human brain. DMD expression in the adult human brain at high spatial resolution averaged from six adult donors (five males and one female; mean age 42 years). Data is shown relative to the average expression across the whole brain (z-score normalization). (A) The spatial distribution is highlighted in three cross-sections of the brain showing the high sub-structural expression in the amygdala and hippocampus in contrast to the low expression throughout the cerebellum. (B) The brain was subdivided into 22 non-overlapping anatomical regions. For each region, the average expression in each of the donors was calculated separately (after z-score normalization) and all six average values are shown in a boxplot. The number of samples are indicated on the right. Significantly higher expression was found in the subthalamus, amygdala, parahippocampus and hippocampal formation. Significantly lower expression was found in the cerebellum and pons (Mann-Whitney U-test; *P < 0.05, **P < 0.01, ***P < 0.001). Full structure names for the indicated acronyms can be found in the Materials and Methods.
Figure 4
Figure 4
DMD transcription start sites. Genome browser view of the different TSSs within the DMD gene. Active TSS state based on histone markers within the DMD gene are shown for 23 samples including foetal and adult brain, muscle, heart, liver and kidney. See Materials and Methods for detailed sample information. Red bars indicate an active TSS state as defined by the Roadmap Epigenomic Consortium. The bottom eight tracks show the TSS activity (blue bars) within the first exons of the different isoforms captured by CAGE sequencing from the FANTOM5 project,. All the active TSSs have been highlighted by zooming in on the first exons of the different isoform groups, from left to right: Dp71 + Dp40, Dp140, and Dp427. Note the absence of any TSS activity or epigenetic markers for Dp427p. Data is aligned to the human reference genome (GRCh37) and RefSeq transcripts are shown at the top. Data is plotted using the WashU Epigenome Browser.
Figure 5
Figure 5
Genes co-expressed with dystrophin isoforms are enriched in disease-related genes. Genes co-expressed with DMD gene across the adult human brain as well as the dystrophin isoforms across brain development (rows) are analysed for enrichment in genes harbouring rare de novo variants in ASD and ID probands, a curated set of ASD risk genes (SFARI ASD), ADD-, OCD-, and dyslexia-related genes. Heatmap colours correspond to −log10(FDR-corrected P-value). All enrichment values for the lists enriched at P < 0.05 (one-sided Mann-Whitney U-test; FDR-corrected) are shown.
Figure 6
Figure 6
Dystrophin isoform co-expression networks and their associated GO-terms. Co-expression networks showing the top 25 positive correlating genes to the dystrophin isoforms Dp427, Dp140 and Dp71 + Dp40 across development. Edges between nodes represent correlation strength (the thicker the line the more correlated the genes). Correlations to dystrophin isoforms are shown in red (not weighted). Genes are color-coded according to their disease associations from DisGeNet. The bar plot shows the top terms enriched within the top 200 correlated genes. The vertical red line indicates the significance level (FDR-corrected P-value of <0.05).

References

    1. Cotton S, Voudouris NJ, Greenwood KM. Intelligence and Duchenne muscular dystrophy: full-scale, verbal, and performance intelligence quotients. Dev. Med. Child Neurol. 2001;43:497–501. doi: 10.1017/S0012162201000913. - DOI - PubMed
    1. Billard C, et al. Cognitive functions in Duchenne muscular dystrophy: a reappraisal and comparison with spinal muscular atrophy. Neuromuscul. Disord. 1992;2:371–378. doi: 10.1016/S0960-8966(06)80008-8. - DOI - PubMed
    1. Dorman C, Hurley AD, D’Avignon J. Language and learning disorders of older boys with Duchenne muscular dystrophy. Dev.Med. Child Neurol. 1988;30:316–327. doi: 10.1111/j.1469-8749.1988.tb14556.x. - DOI - PubMed
    1. Castles A, Coltheart M. Varieties of developmental dyslexia. Cognition. 1993;47:149–80. doi: 10.1016/0010-0277(93)90003-E. - DOI - PubMed
    1. Banihani R, et al. Cognitive and Neurobehavioral Profile in Boys With Duchenne Muscular Dystrophy. J. Child Neurol. 2015;30:1472–1482. doi: 10.1177/0883073815570154. - DOI - PubMed

Publication types

MeSH terms