. 2017 Oct 3;7(1):12642.
doi: 10.1038/s41598-017-12879-2.

Time-lapse imaging of microRNA activity reveals the kinetics of microRNA activation in single living cells

Affiliations

Time-lapse imaging of microRNA activity reveals the kinetics of microRNA activation in single living cells

Hideaki Ando et al. Sci Rep. .

Abstract

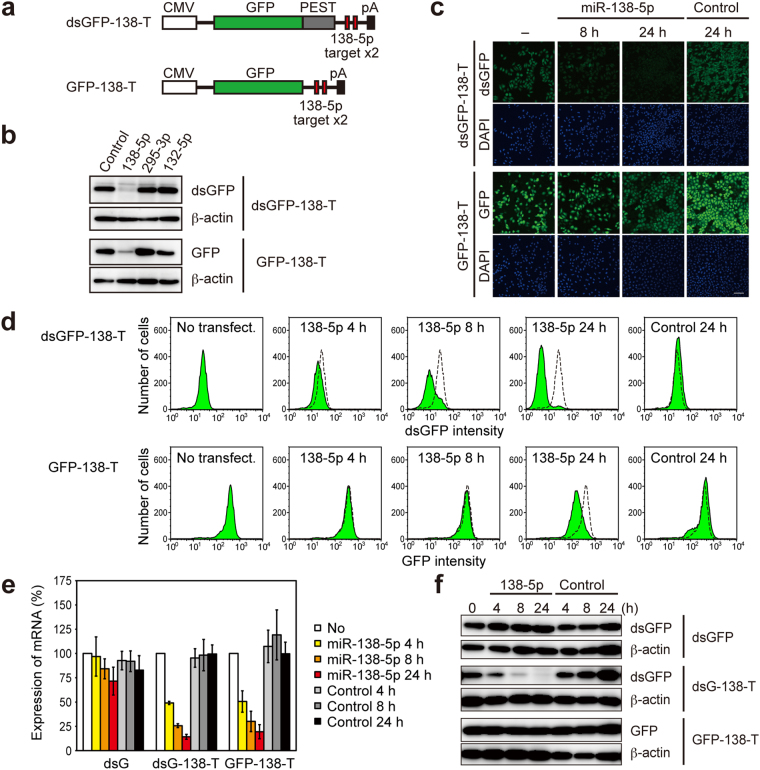
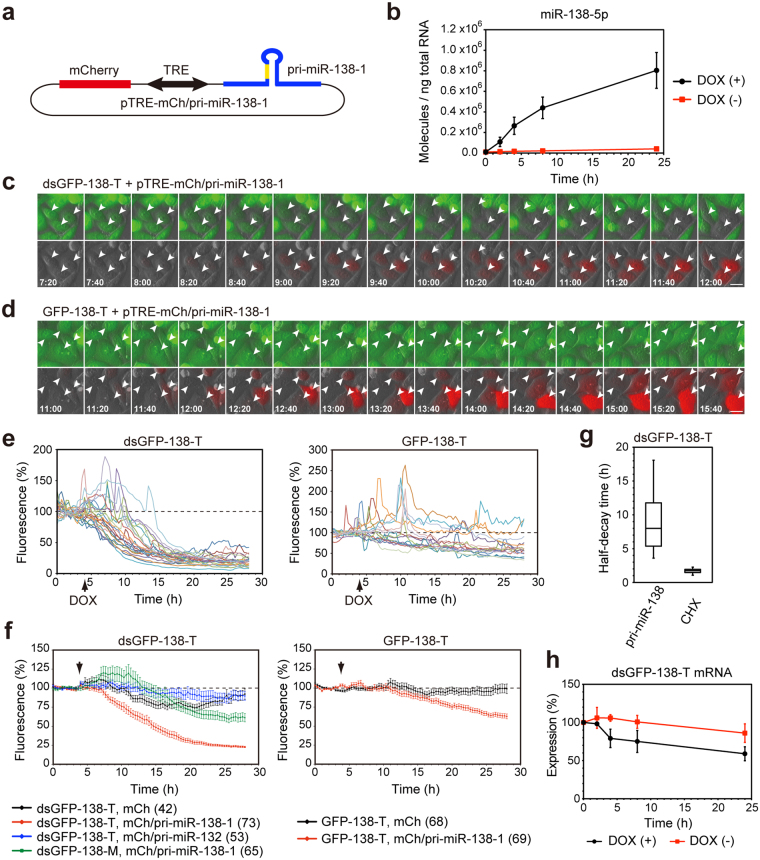
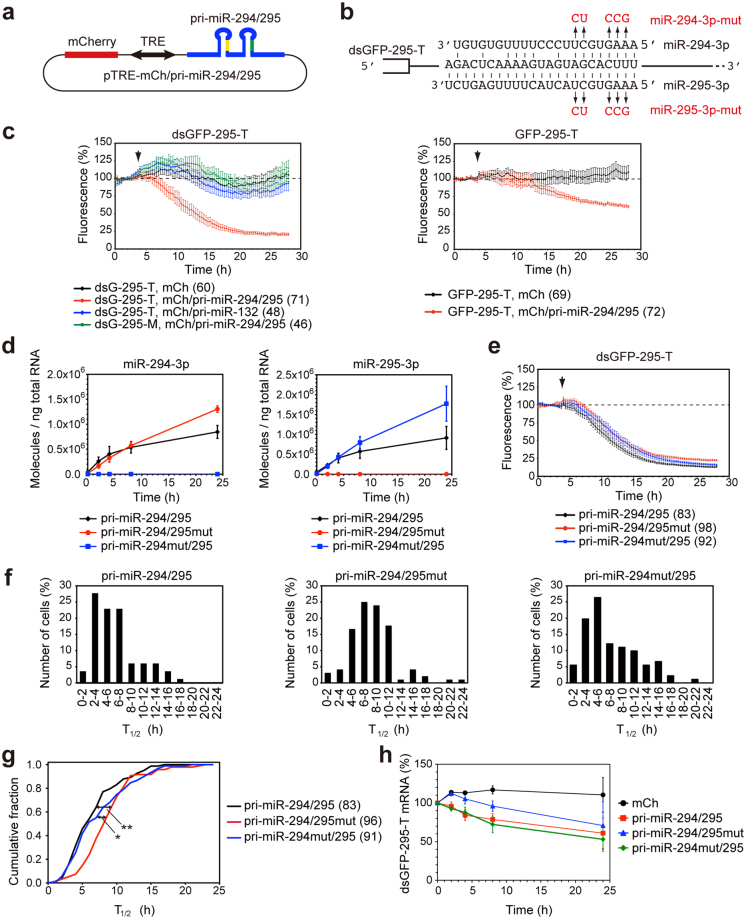
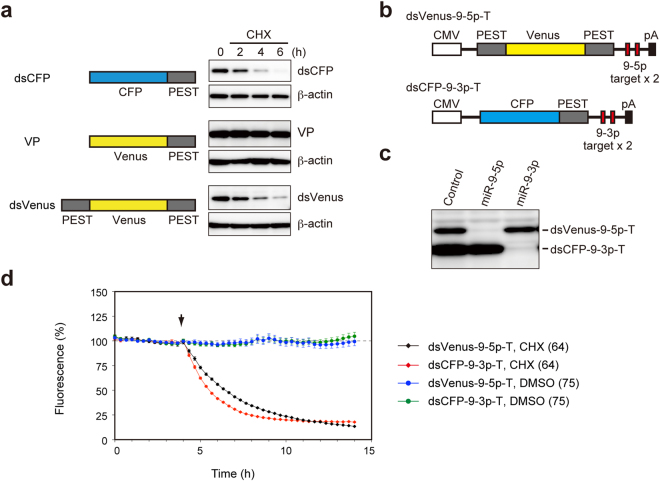
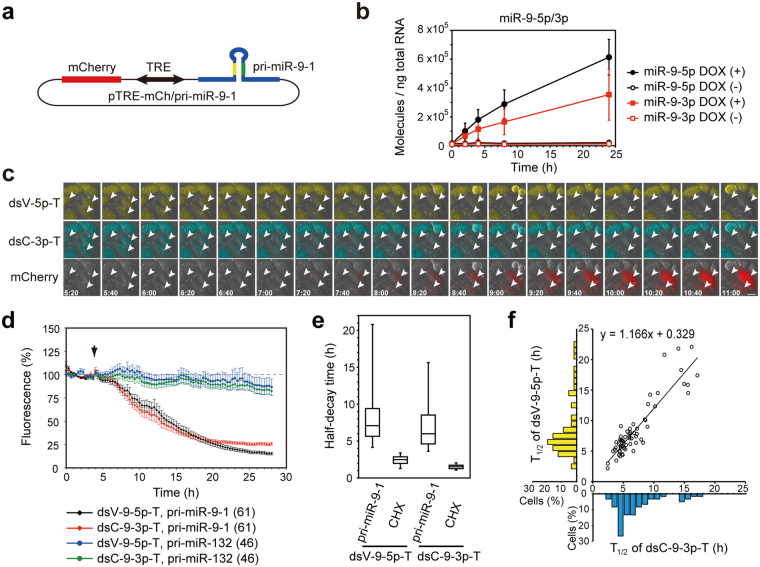
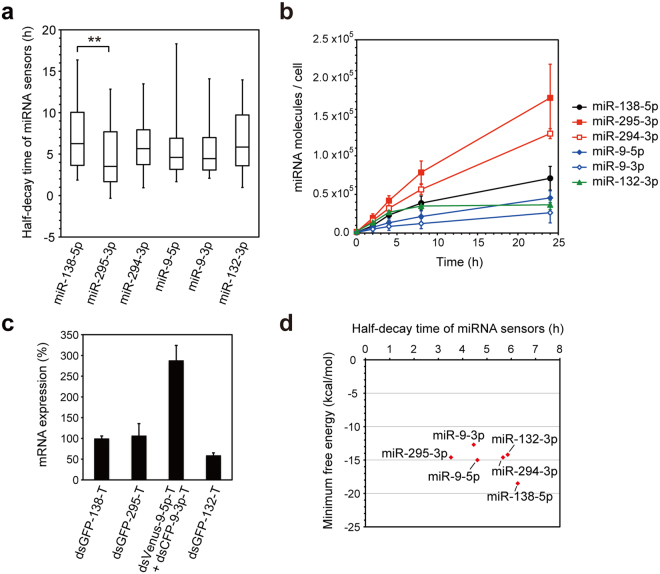
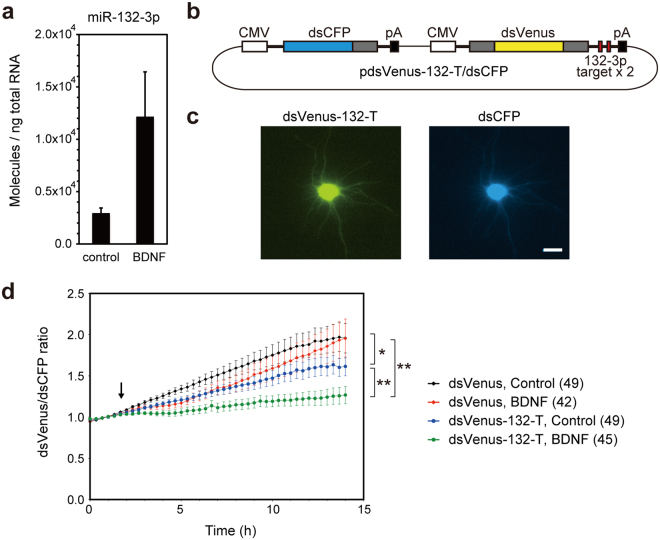
MicroRNAs (miRNAs) are small, non-coding RNAs that play critical roles in the post-transcriptional regulation of gene expression. Although the molecular mechanisms of the biogenesis and activation of miRNA have been extensively studied, the details of their kinetics within individual living cells remain largely unknown. We developed a novel method for time-lapse imaging of the rapid dynamics of miRNA activity in living cells using destabilized fluorescent proteins (dsFPs). Real-time monitoring of dsFP-based miRNA sensors revealed the duration necessary for miRNA biogenesis to occur, from primary miRNA transcription to mature miRNA activation, at single-cell resolution. Mathematical modeling, which included the decay kinetics of the fluorescence of the miRNA sensors, demonstrated that miRNAs induce translational repression depending on their complementarity with targets. We also developed a dual-color imaging system, and demonstrated that miR-9-5p and miR-9-3p were produced and activated from a common hairpin precursor with similar kinetics, in single cells. Furthermore, a dsFP-based miR-132 sensor revealed the rapid kinetics of miR-132 activation in cortical neurons under physiological conditions. The timescale of miRNA biogenesis and activation is much shorter than the median half-lives of the proteome, suggesting that the degradation rates of miRNA target proteins are the dominant rate-limiting factors for miRNA-mediated gene silencing.


Conflict of interest statement

The authors declare that they have no competing interests.

Figures

Figure 1
Figure 1
Rapid suppression of the dsGFP-based miRNA sensor. (a) Structure of miR-138-5p sensors. (b) Plasmids encoding dsGFP-138-T or GFP-138-T (0.5 µg) were co-transfected with 1 nM miR-138-5p, miR-295-3p, miR-132-3p, or control miRNA mimics into HeLa cells. 24 h after transfection, cells were analyzed by western blotting with anti-GFP and anti-β-actin antibodies. (c,d) Stable HeLa cells expressing dsGFP-138-T or GFP-138-T were transfected with 1 nM miR-138-5p or control miRNA mimics. Fluorescence of miRNA sensors was analyzed by confocal microscopy (c) or flow cytometry (d). Scale bars: 100 µm. (e) Stable HeLa cells expressing dsGFP, dsGFP-138-T, or GFP-138-T were transfected with 1 nM miR-138-5p or control miRNA mimics. mRNA expression levels of miRNA sensors were analyzed by quantitative RT-PCR. Data are expressed as mean ± SD (n = 3). (f) Stable HeLa cells transfected with miRNA mimics were analyzed by western blotting with anti-GFP and anti-β-actin antibodies.
Figure 2
Figure 2
Time-lapse imaging of the miR-138-5p sensors in living cells. (a) pTRE-mCh/pri-miR-138-1 vector. (b) Stable HeLa cells expressing dsGFP-138-T were transfected with pTRE-mCh/pri-miR-138-1 and tTA, and the cells were incubated with or without 1 µg/mL doxycycline for 2, 4, 8 or 24 h. miR-138-5p expression was analyzed by quantitative RT-PCR. Data are expressed as mean ± SD (n = 3). (c,d) Stable HeLa cells expressing dsGFP-138-T (c) or GFP-138-T (d) were transfected with pTRE-mCh/pri-miR-138-1 and tTA, and expression of pri-miR-138-1 and mCherry were induced by doxycycline. Fluorescence of miR-138-5p sensors and mCherry were captured every 20 min at 37 °C. mCherry-expressing cells are indicated by arrowheads. Scale bars: 20 µm. (e) Representative time courses of fluorescence intensities of single cells expressing dsGFP-138-T (left) and GFP-138-T (right). Pri-miR-138-1 expression was induced at the indicated time (DOX). Note that sharp peaks were caused by cell-rounding during cell division. (f) Relative fluorescence intensities of dsGFP-138-T and dsGFP-138-M (left) and GFP-138-T (right) are presented as mean ± SEM. Numbers of cells analyzed are shown in parentheses. (g) Box-plot of half-decay time (T1/2) of dsGFP-138-T. The box represents the 25th and 75th percentiles. Whiskers show 5th and 95th percentiles. (h) Stable HeLa cells expressing dsGFP-138-T were transfected with pTRE-mCh/pri-miR-138-1 and tTA, and the cells were incubated with or without 1 µg/mL doxycycline for 2, 4, 8 or 24 h. The levels of dsGFP-138-T mRNA were analyzed by quantitative RT-PCR. Data are expressed as mean ± SD (n = 3).
Figure 3
Figure 3
Time-lapse imaging of the miR-295-3p sensor in living cells. (a) pTRE-mCh/pri-miR-294/295 vector. (b) Sequences of miR-294-3p, miR-295-3p, and the miRNA target site in the dsGFP-295-T sensor. Mutations introduced into pTRE-mCh/pri-miR-294/295 are indicated by red. (c) Stable HeLa cells expressing dsGFP-295-T, dsGFP-295-M or GFP-295-T were transfected with pTRE-mCh/pri-miR-294/295 and tTA, and the expression of pri-miR-294/295 and mCherry were induced by doxycycline at the indicated time. Relative fluorescence intensities of dsGFP-295-T and dsGFP-295-M (left) and GFP-295-T (right) are presented as mean ± SEM. Numbers of cells analyzed are shown in parentheses. (dh) dsGFP-295-T expressing cells were transfected with pTRE-mCh/pri-miR-294/295, pTRE-mCh/pri-miR-294/295mut, or pTRE-mCh/pri-miR-294mut/295 with tTA, and the expression of pri-miRNAs were induced by doxycycline. (d) Expression of miR-294-3p and miR-295-3p was analyzed by quantitative RT-PCR. Data are expressed as mean ± SD (n = 3). (e) Fluorescence of dsGFP-295-T was analyzed by time-lapse imaging. Relative fluorescence intensities of dsGFP-295-T are expressed as mean ± SEM. (f) Distribution of T1/2 of dsGFP-295-T in individual cells. (g) Cumulative distributions of T1/2. Numbers of cells analyzed are shown in parentheses. *P < 0.05, **P < 0.01 (Kruskal-Wallis test followed by Steel-Dwass test). (h) The levels of dsGFP-295-T mRNA were analyzed by quantitative RT-PCR. Data are expressed as mean ± SD (n = 3).
Figure 4
Figure 4
Mathematical model of the miRNA-mediated regulation of the miRNA sensors. (a) Models of miRNA function. The up-regulation of target mRNA degradation and the down-regulation of translation by miRNA are expressed by nonlinear functions of miRNA. The cooperativity in the regulations is expressed as n (up-regulation of degradation) and m (down-regulation of translation). (bd) We attempted to reproduce the time series of the target protein (green) using the experimental data of the time series of the expression of the miRNA (red) and target mRNA (orange) as well as the measured half-lives of dsGFP-138-T and dsGFP-295-T. First, we obtained the degradation rate of the target protein from the measured half-lives (see text). Second, we searched for the parameter set for the dynamics of the miRNA and target mRNA, which reproduced the experimental data of the time series of the miRNA and target mRNA (red and orange dots, respectively). Using these parameters, which reproduced the data of miRNA and target mRNA, we estimated the time series of the target protein (green). (b) Decay of dsGFP-138-T by pri-miR-138-1 induction. Experimental data are derived from Fig. 2b,f and h. (cd) Decay of dsGFP-295-T by pri-miR-294/295 induction (c) or pri-miR-294/295mut induction (d). Experimental data are derived from Fig. 3d,e and h.
Figure 5
Figure 5
Development of miR-9-5p and miR-9-3p sensors using destabilized CFP and Venus. (a) HeLa cells transfected with dsCFP, VP, or dsVenus were treated with 100 µg/mL CHX and analyzed by western blotting with anti-GFP and anti-β-actin antibodies. (b) Structure of miR-9-5p and miR-9-3p sensors. (c) Stable HeLa cells expressing both dsVenus-9-5p-T and dsCFP-9-3p-T were transfected with 1 nM miR-9-5p, miR-9-3p, or control miRNA mimics and were analyzed by western blotting with anti-GFP antibody. (d) Stable HeLa cells expressing both dsVenus-9-5p-T and dsCFP-9-3p-T were treated with 100 µg/mL CHX or 0.1% DMSO. Fluorescence intensities of dsVenus-9-5p-T and dsCFP-9-3p-T were analyzed by time-lapse imaging and are presented as mean ± SEM. Numbers of cells analyzed are shown in parentheses.
Figure 6
Figure 6
Dual-imaging of activation of miR-9-5p and miR-9-3p in living cells. (a) pTRE-mCh/pri-miR-9-1 vector. (b) Stable HeLa cells expressing both dsVenus-9-5p-T and dsCFP-9-3p-T were transfected with pTRE-mCh/pri-miR-9-1 and tTA, and the cells were incubated with or without 1 µg/mL doxycycline for 2, 4, 8 or 24 h. Expression of miR-9-5p and miR-9-3p were analyzed by quantitative RT-PCR. Data are expressed as mean ± SD (n = 5). (c) Stable HeLa cells expressing both dsVenus-9-5p-T and dsCFP-9-3p-T were transfected with pTRE-mCh/pri-miR-9-1 and tTA, and expression of pri-miR-9-1 and mCherry was induced by doxycycline. Fluorescence of dsVenus-9-5p-T, dsCFP-9-3p-T and mCherry were captured every 20 min at 37 °C. mCherry-expressing cells are indicated by arrowheads. Scale bar: 20 µm. (d) Relative fluorescence intensities of dsVenus-9-5p-T and dsCFP-9-3p-T are presented as mean ± SEM. Numbers of cells analyzed are shown in parentheses. (e) Box-plot of T1/2 of dsVenus-9-5p-T and dsCFP-9-3p-T. The box represents the 25th and 75th percentiles. Whiskers show 5th and 95th percentiles. (f) T1/2 of dsCFP-9-3p-T (x-axis) and dsVenus-9-5p-T (y-axis) in individual cells are plotted (60 cells). Marginal histograms show distributions of T1/2 of dsCFP-9-3p-T (bottom) and dsVenus-9-5p-T (left).
Figure 7
Figure 7
Comparison of the kinetics of miRNA activation. (a) Box-plot of the half-decay time of the dsFP-based miRNA sensors. Median half-decay time periods of the corresponding dsFP-based miRNA sensors caused by CHX (Fig. 5d, Supplementary Fig. S2, S5) were subtracted from the half-decay time periods of dsGFP-138-T, dsGFP-295-T, dsVenus-9-5p-T and dsCFP-9-3p-T, and dsGFP-132-T, whose decay was caused by the induction of pri-miR-138-1 (Fig. 2f), pri-miR-294mut/295 or pri-miR-294/295mut (Fig. 3e), pri-miR-9-1 (Fig. 6d), and pri-miR-132 (Supplementary Fig. S5), respectively. The box represents the 25th and 75th percentiles. Whiskers show 5th and 95th percentiles. **P < 0.01 (Kruskal-Wallis test followed by Steel-Dwass test). (b) Molecule numbers of the mature miRNAs in a single transfected cell were calculated from the miRNA expression data (Figs 2b, 3d, 6b, Supplementary Fig. S5), the total amount of RNA in a single HeLa cell (32.5 pg/cell), and the co-transfection efficiency of mCherry/pri-miRNAs and tTA (Supplementary Fig. S3). Data are expressed as mean ± SD (n = 3–5). (c) Relative expression levels of the miRNA sensor mRNAs in the stable HeLa cell lines were analyzed by quantitative RT-PCR. The total of dsVenus-9-5p-T and dsCFP-9-3p-T mRNAs is shown, because it was technically difficult to discriminate between them because of their sequence similarity. Data are expressed as mean ± SD (n = 3). (d) The minimum free energies of the binding of the 8 nucleotides at the 5′-terminal of the miRNAs to the target sites of the miRNA sensors were predicted by RNAhybrid.
Figure 8
Figure 8
Time-lapse imaging of miR-132-3p activation in living neurons. (a) Cortical neurons (DIV 5) were stimulated with 50 ng/mL BDNF for 12 h. Expression of miR-132-3p was analyzed by quantitative RT-PCR. Data are expressed as mean ± SD (n = 6). (b) pdsVenus-132-T/dsCFP vector. (c) Cortical neurons were transfected with pdsVenus-132-T/dsCFP. Fluorescence of dsVenus-132-T (left) and dsCFP (right) are shown. Scale bars: 20 µm. (d) Neurons were transfected with pdsVenus/dsCFP or pdsVenus-132-T/dsCFP and were analyzed by time-lapse imaging. Fluorescence of dsVenus and dsCFP were captured every 20 min at 37 °C. BDNF (50 ng/mL) was added at the indicated time. The dsVenus/dsCFP ratio are presented as mean ± SEM. Numbers of cells analyzed are shown in parentheses. *P < 0.05, **P < 0.01 (two-way repeated measures ANOVA).

Similar articles

Cited by

References

    1. Bartel DP. MicroRNAs: target recognition and regulatory functions. Cell. 2009;136:215–233. doi: 10.1016/j.cell.2009.01.002. - DOI - PMC - PubMed
    1. Lee Y, et al. MicroRNA genes are transcribed by RNA polymerase II. EMBO J. 2004;23:4051–4060. doi: 10.1038/sj.emboj.7600385. - DOI - PMC - PubMed
    1. Cai X, Hagedorn CH, Cullen BR. Human microRNAs are processed from capped, polyadenylated transcripts that can also function as mRNAs. RNA. 2004;10:1957–1966. doi: 10.1261/rna.7135204. - DOI - PMC - PubMed
    1. Lee Y, et al. The nuclear RNase III Drosha initiates microRNA processing. Nature. 2003;425:415–419. doi: 10.1038/nature01957. - DOI - PubMed
    1. Yi R, Qin Y, Macara IG, Cullen BR. Exportin-5 mediates the nuclear export of pre-microRNAs and short hairpin RNAs. Genes Dev. 2003;17:3011–3016. doi: 10.1101/gad.1158803. - DOI - PMC - PubMed

Publication types

LinkOut - more resources