. 2017 Oct 3;7(1):12434.
doi: 10.1038/s41598-017-10845-6.

Identification of key regions and residues controlling Aβ folding and assembly

Affiliations

Identification of key regions and residues controlling Aβ folding and assembly

Eric Y Hayden et al. Sci Rep. .

Abstract

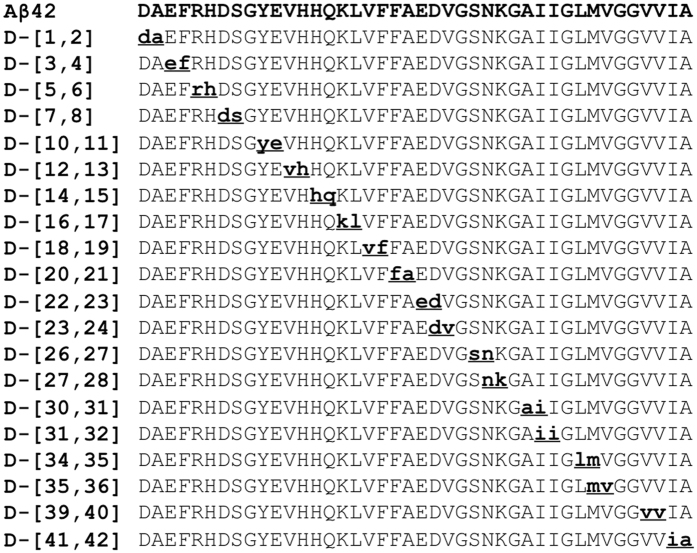
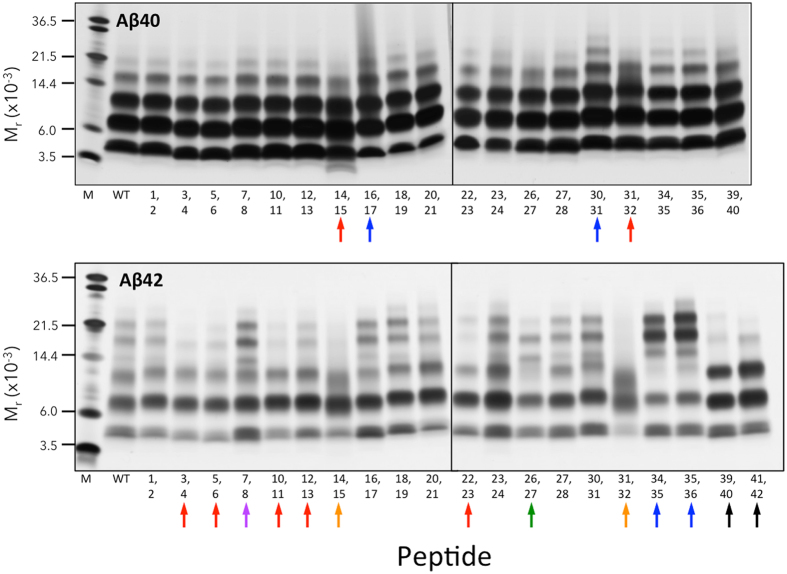
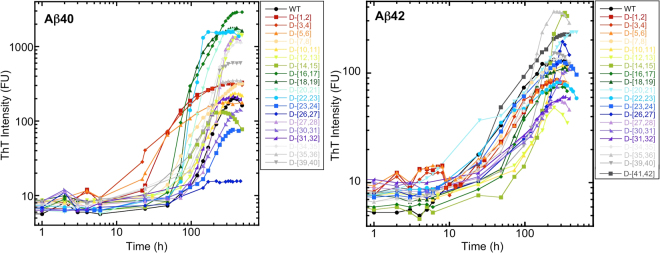
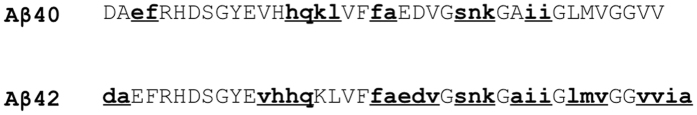
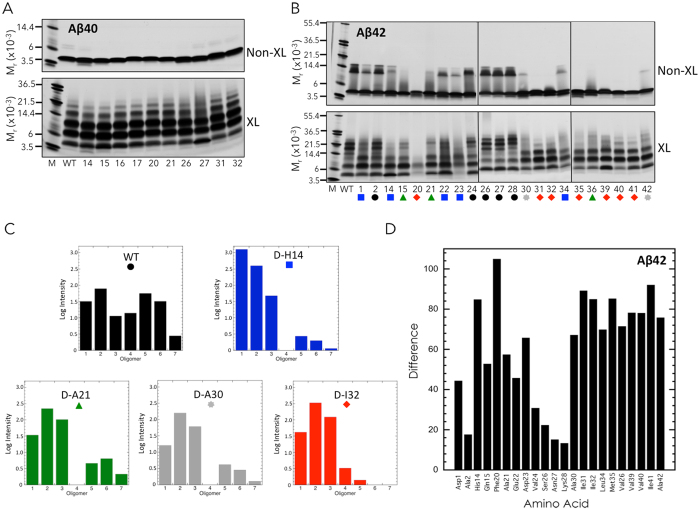
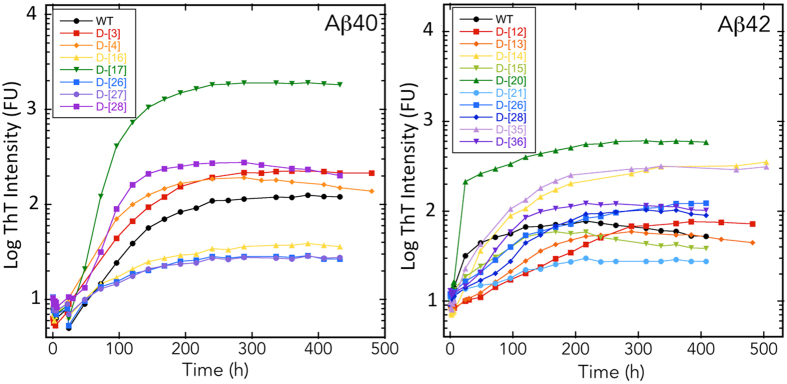
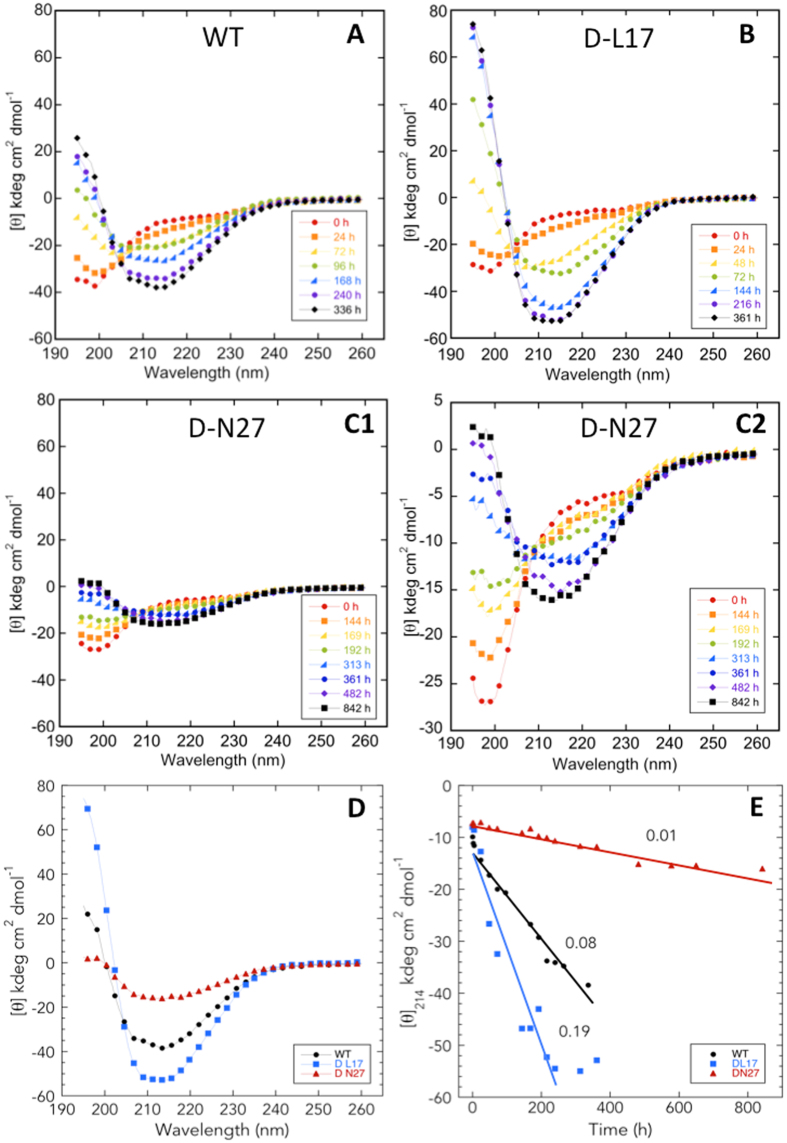
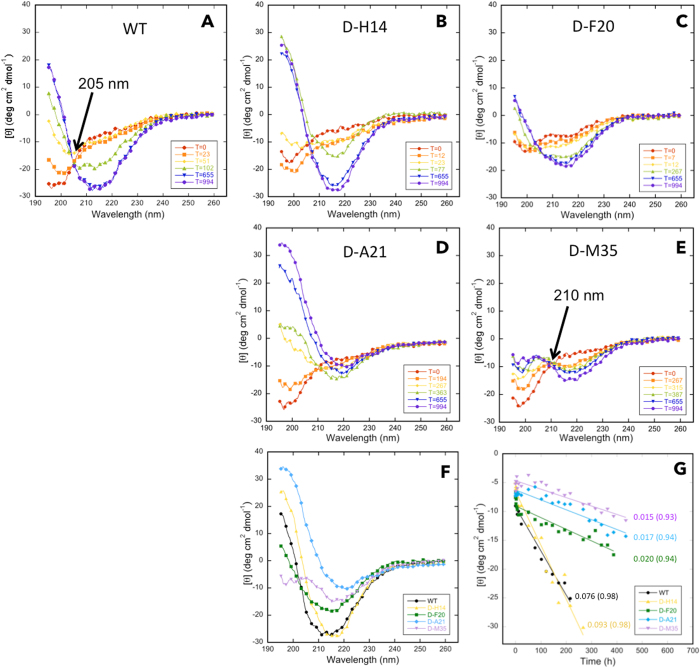
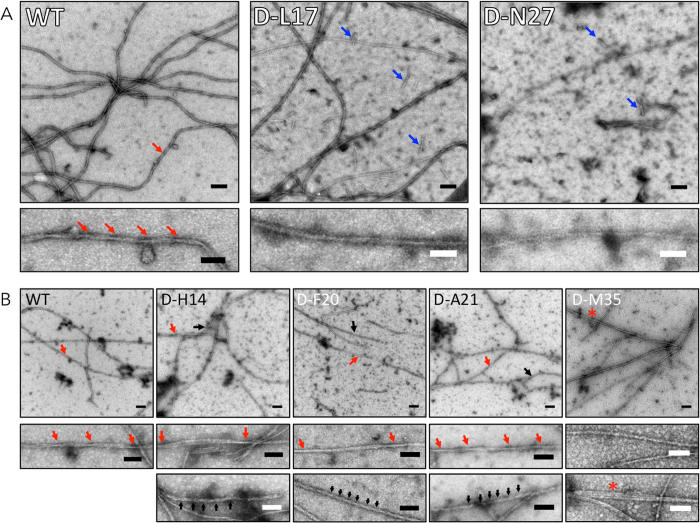
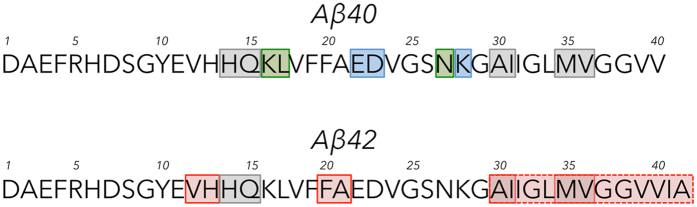
Amyloid β-protein (Aβ) assembly is hypothesized to be a seminal neuropathologic event in Alzheimer's disease (AD). We used an unbiased D-amino acid substitution strategy to determine structure-assembly relationships of 76 different Aβ40 and Aβ42 peptides. We determined the effects of the substitutions on peptide oligomerization, secondary structure dynamics, fibril assembly dynamics, and fibril morphology. Our experiments revealed that the assembly of Aβ42 was more sensitive to chiral substitutions than was Aβ40 assembly. Substitutions at identical positions in the two peptides often, but not always, produced the same effects on assembly. Sites causing substantial effects in both Aβ40 and Aβ42 include His14, Gln15, Ala30, Ile31, Met35, and Val36. Sites whose effects were unique to Aβ40 include Lys16, Leu17, and Asn 27, whereas sites unique to Aβ42 include Phe20 and Ala21. These sites may be appropriate targets for therapeutic agents that inhibit or potentiate, respectively, these effects.


Conflict of interest statement

The authors declare that they have no competing interests.

Figures

Figure 1
Figure 1
Location of di-D-amino acid substitutions. Substitutions are indicated by bolded, underlined, lower-case letters. The substitutions were identical for Aβ40 and Aβ42, except for the additional ia at the 41 and 42 positions in Aβ42.
Figure 2
Figure 2
Oligomerization of di-D-amino acid substituted Aβ. Peptides were cross-linked using PICUP. SDS-PAGE and silver staining were then performed to reveal the effects of D-amino acid substitutions on Aβ40 and Aβ42 oligomerization. Mr indicates apparent molecular weight. Lanes “M” are molecular weight markers. WT indicates the wild type peptide. Positions of D-amino acid substitutions are indicated by numbers below each gel. Colored arrows represent different classes of oligomerization (see text). Gels are representative of results in each of three independent experiments.
Figure 3
Figure 3
Fibril formation kinetics of di-D-amino acid substituted Aβ. Peptides (40 μM Aβ40, 20 μM Aβ42) were mixed with Thioflavin T in 10 mM sodium phosphate, pH 7.4, and incubated with shaking at 37 °C. (A) Aβ40 with di-D-amino acid substitutions. (B) Aβ42 with di-D-amino acid substitutions. The peptides examined are shown in the boxes to the right of each sub-figure. Note that log-log plots are shown. (Fig. S1 shows semi-log plots of the same data.)
Figure 4
Figure 4
Locations of single D-amino acid substitutions in Aβ40 and Aβ42. Each position in which a single D-amino acid substitution was made is indicated by bolded, underlined, lower-case letters. Thirteen Aβ40 peptides and 24 Aβ42 peptides were studied.
Figure 5
Figure 5
Oligomerization of single D-amino acid substituted Aβ. Non-cross-linked and cross-linked Aβ40 (A) and Aβ42 (B) were analyzed using SDS-PAGE and silver staining (colored symbols represent different classes of oligomerization; see text). Gels are representative of results in each of three independent experiments. (C) Oligomer frequency distributions. Each histogram and its color correspond to one of the five classes of oligomerization pattern shown in panel (B). (D) Histogram of the difference metric for Aβ42 variants (see Materials and Methods). Amino acid position is indicated on the abscissa. The sum of the absolute values of the differences in intensities of wild type bands compared with bands in substituted Aβ42 peptides is indicated on the ordinate.
Figure 6
Figure 6
Fibril formation kinetics of single D-amino acid substituted Aβ. Peptides (40 μM Aβ40, 20 μM Aβ42) were mixed with Thioflavin T in 10 mM sodium phosphate, pH 7.4, and incubated with shaking at 37 °C. (A) Aβ40 with single D-amino acid substitutions. (B) Aβ42 with single D-amino acid substitutions. The peptides examined are shown in the boxes inside each panel. Note that semi-log plots are shown. (Figure S5 shows linear plots).
Figure 7
Figure 7
Secondary structure dynamics of WT and singly substituted variants of Aβ40. Forty μM Aβ40 was prepared in 10 mM sodium phosphate, pH 7.4, and incubated with shaking at 37 °C. Secondary structure dynamics were assessed using CD during 842 h of incubation. Panels are (A) WT, (B) D-L17, and (C1 and C2) D-N27. The data from panel C1 are plotted in panel C2 with a narrower molar ellipticity range to make spectral comparison easier. (D) Spectra of WT and substituted variants at the end of secondary structure changes. (E) Values of [θ]214 are plotted versus incubation time (h). Lines obtained from linear regression analysis of the data were used to determine assembly rates dθ/dt. Numbers adjacent to each line are the calculated rates in kdeg cm2 dmol−1/hour.
Figure 8
Figure 8
Secondary structure dynamics of WT and singly substituted variants of Aβ42. Twenty μM Aβ42 was prepared in 10 mM sodium phosphate, pH 7.4, and incubated with shaking at 37 °C. Secondary structure dynamics were assessed using CD during 994 h of incubation. Panels are (A) WT, (B) D-H14, (C) D-F20, (D) D-A21, and (E) D-M35. (F) Spectra of WT and substituted variants at the end of the assembly process. (G) Molar ellipticity for each peptide was determined at that wavelength at which the molar ellipticity was at a minimum in the final secondary structure formed. Lines obtained from linear regression analysis of the data were used to determine assembly rates dθ/dt. Numbers adjacent to each line are the calculated rates in kdeg cm2 dmol−1/hour.
Figure 9
Figure 9
Morphology of WT and singly substituted Aβ40 and Aβ42. Morphology was examined using negative stain transmission electron microscopy. Electron micrographs of fibrils formed by (A) WT Aβ40, Aβ40 D-L17, Aβ40 D-N27; and (B) WT Aβ42, Aβ42 D-H14, Aβ42 D-F20, Aβ42 D-A21, and Aβ42 M35 are shown. Upper panels show representative regions of the grids. Lower panels are high magnification images of the assemblies indicated by arrows in the upper panels. The colors in the lower panels correspond to those in the upper panels. Scale bars are 100 nm in the upper panels and 50 nm in the lower panels. Arrows in the lower panels indicate the periodicity of helical segments of fibrils. Blue arrows in D-L17 Aβ40 and D-N27 Aβ40 indicate short fibrils. The asterisk in D-M35 Aβ42 indicates a trifilar structure.
Figure 10
Figure 10
Map of individual amino acids important in controlling Aβ folding and assembly. Amino acids with particularly strong effects on assembly are indicated by shading. Amino acids affecting both Aβ40 and Aβ42 are in grey boxes. Amino acids unique to Aβ40 are in green boxes and those unique to Aβ42 are in red boxes. Amino acids that displayed strong effects by one metric but not all are in blue boxes. The C-terminal region of Aβ42, which we found to be especially sensitive to substitution, is indicated by a red box formed with dashed lines.

Similar articles

Cited by

References

    1. Moschetti K, Cummings PL, Sorvillo F, Kuo T. Burden of Alzheimer’s disease-related mortality in the United States, 1999–2008. J Am Geriatr Soc. 2012;60:1509–1514. doi: 10.1111/j.1532-5415.2012.04056.x. - DOI - PubMed
    1. James BD, et al. Contribution of Alzheimer disease to mortality in the United States. Neurology. 2014;82:1045–1050. doi: 10.1212/WNL.0000000000000240. - DOI - PMC - PubMed
    1. Goure WF, Krafft GA, Jerecic J, Hefti F. Targeting the proper amyloid-β neuronal toxins: a path forward for Alzheimer’s disease immunotherapeutics. Alzheimers Res Ther. 2014;6:42. doi: 10.1186/alzrt272. - DOI - PMC - PubMed
    1. De Strooper B. Proteases and proteolysis in Alzheimer disease: a multifactorial view on the disease process. Phys Rev. 2010;90:465–494. - PubMed
    1. Gardberg AS, et al. Molecular basis for passive immunotherapy of Alzheimer’s disease. Proc Natl Acad Sci USA. 2007;104:15659–15664. doi: 10.1073/pnas.0705888104. - DOI - PMC - PubMed

Publication types